OPEN-SOURCE SCRIPT
Updated Spectral Gating (SG)
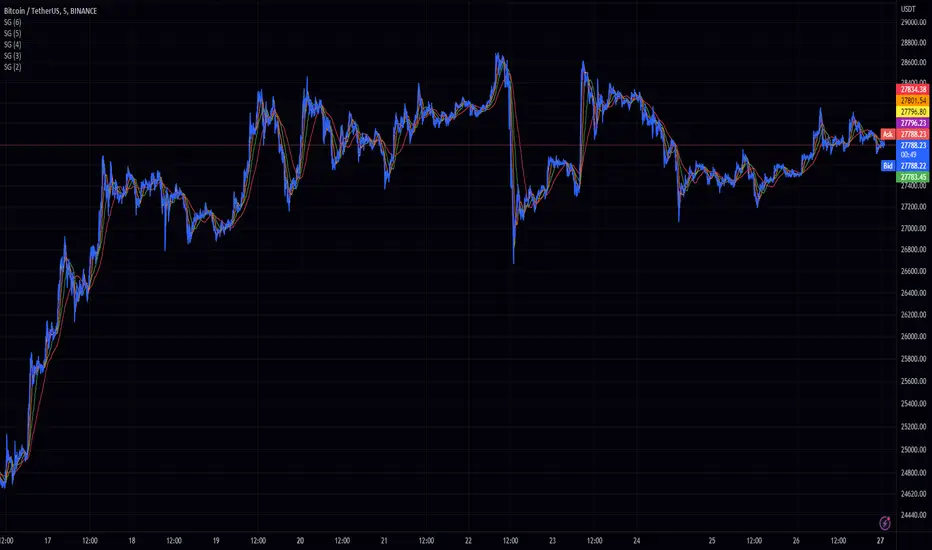
The Spectral Gating (SG) Indicator is a technical analysis tool inspired by music production techniques. It aims to help traders reduce noise in their charts by focusing on the significant frequency components of the data, providing a clearer view of market trends.
By incorporating complex number operations and Fast Fourier Transform (FFT) algorithms, the SG Indicator efficiently processes market data. The indicator transforms input data into the frequency domain and applies a threshold to the power spectrum, filtering out noise and retaining only the frequency components that exceed the threshold.
Key aspects of the Spectral Gating Indicator include:
Adjustable Window Size: Customize the window size (ranging from 2 to 6) to control the amount of data considered during the analysis, giving you the flexibility to adapt the indicator to your trading strategy.
Complex Number Arithmetic: The indicator uses complex number addition, subtraction, and multiplication, as well as radius calculations for accurate data processing.
Iterative FFT and IFFT: The SG Indicator features iterative FFT and Inverse Fast Fourier Transform (IFFT) algorithms for rapid data analysis. The FFT algorithm converts input data into the frequency domain, while the IFFT algorithm restores the filtered data back to the time domain.
Spectral Gating: At the heart of the indicator, the spectral gating function applies a threshold to the power spectrum, suppressing frequency components below the threshold. This process helps to enhance the clarity of the data by reducing noise and focusing on the more significant frequency components.
Visualization: The indicator plots the filtered data on the chart with a simple blue line, providing a clean and easily interpretable representation of the results.
Although the Spectral Gating Indicator may not be a one-size-fits-all solution for all trading scenarios, it serves as a valuable tool for traders looking to reduce noise and concentrate on relevant market trends. By incorporating this indicator into your analysis toolkit, you can potentially make more informed trading decisions.
Release Notes
added a source Open-source script
In true TradingView spirit, the creator of this script has made it open-source, so that traders can review and verify its functionality. Kudos to the author! While you can use it for free, remember that republishing the code is subject to our House Rules.
For quick access on a chart, add this script to your favorites — learn more here.
Disclaimer
The information and publications are not meant to be, and do not constitute, financial, investment, trading, or other types of advice or recommendations supplied or endorsed by TradingView. Read more in the Terms of Use.
Open-source script
In true TradingView spirit, the creator of this script has made it open-source, so that traders can review and verify its functionality. Kudos to the author! While you can use it for free, remember that republishing the code is subject to our House Rules.
For quick access on a chart, add this script to your favorites — learn more here.
Disclaimer
The information and publications are not meant to be, and do not constitute, financial, investment, trading, or other types of advice or recommendations supplied or endorsed by TradingView. Read more in the Terms of Use.