OPEN-SOURCE SCRIPT
Updated MTF EMAS
Multi time frame EMA
This script will plot the configured EMAS on the current time frame (CTF) and also the same EMAS on a higher time frame (HTF).
Hard coded according:
* 5m EMAS will be plotted on TF bellow 5m
* Daily EMA will be plotted on TF above 5m and bellow 1D
* Weekly EMA will be plotted on daily TF
* Monthly EMA will be plotted on weekly TF
This configuration give us the opportunity to watch EMA support/resistance from HTF on the CTF
Release Notes
some cleanupsRelease Notes
fix issue with security plot and change colorsRelease Notes
Update chartRelease Notes
changed default ema 3 from 50 to 100Release Notes
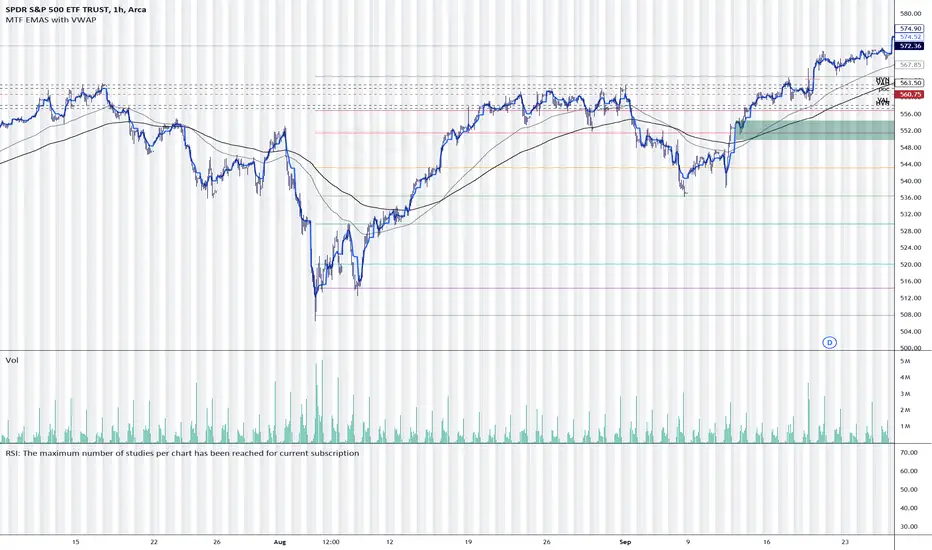
This advanced technical analysis indicator combines Multiple Timeframe Exponential Moving Averages (EMAs) with a customizable Volume Weighted Average Price (VWAP). It's designed to provide traders and analysts with a comprehensive view of price trends across different timeframes while also offering volume-based price analysis.Key Features:
- []Multi-Timeframe EMAs:
- []Displays four EMAs on the current timeframe (CTF) []Shows four corresponding EMAs from a higher timeframe (HTF) []EMA periods are customizable (default: 12, 26, 100, 200) []Automatically adjusts higher timeframe based on the chart's current timeframe
- []Option to show or hide VWAP []Customizable VWAP source (default: HLC3) []Adjustable VWAP anchor periods: Session (daily), Week, or Month
- []EMAs are color-coded for easy identification []CTF EMAs are displayed with thin lines, HTF EMAs with thicker lines
- VWAP is plotted as a distinct blue line
Use Cases:
- []Trend Analysis: Use EMAs to identify short-term and long-term trends across multiple timeframes []Support/Resistance: Higher timeframe EMAs often act as dynamic support/resistance levels []Volume-Based Analysis: VWAP provides insights into the average price weighted by volume []Multi-Factor Decision Making: Combine EMA crossovers with VWAP positioning for potential trade signals
This indicator is suitable for various trading styles and can be applied to different financial instruments, including stocks, forex, and cryptocurrencies. It's particularly useful for traders who incorporate multiple timeframe analysis and volume considerations into their trading strategies.
Open-source script
In true TradingView spirit, the creator of this script has made it open-source, so that traders can review and verify its functionality. Kudos to the author! While you can use it for free, remember that republishing the code is subject to our House Rules.
For quick access on a chart, add this script to your favorites — learn more here.
Disclaimer
The information and publications are not meant to be, and do not constitute, financial, investment, trading, or other types of advice or recommendations supplied or endorsed by TradingView. Read more in the Terms of Use.