OPEN-SOURCE SCRIPT
Updated [SGM Ordinal Patterns]
An ordinal pattern is a concept used in mathematics and time series analysis. It is a way of describing the relative order of values in a sequence. Rather than focusing on the exact values, we are interested in how they compare to each other.
An ordinal pattern will tell you how these values are positioned relative to each other.
We do not look at the exact values, but only their order.
Concrete Example
• 4 (position 1 in the original sequence) is in position 2 in the ordered sequence.
• 7 (position 2 in the original sequence) is in position 3 in the ordered sequence.
• 2 (position 3 in the original sequence) is in position 1 in the ordered sequence.
The ordinal pattern for this sequence is then (2,3,1)(2, 3, 1)(2,3,1).

Script Explanation
This script analyzes ordinal patterns based on the closing prices of the last three bars and calculates the future gains associated with each ordinal pattern.
The main elements of the script are:
1. ordinal_pattern Function:
o Determines the ordinal pattern based on three past closing values.
o Returns an index (from 0 to 5) corresponding to one of the six possible ordinal patterns.
2. Calculations and Storage:
o For each new bar, the last three closes are used to identify the ordinal pattern.
o Future gains are calculated and associated with the previous ordinal pattern.
o Return statistics (mean, standard deviation and Sharpe ratio) are calculated for each pattern.
3. Visualization:
o Draws lines connecting the last three closes.
o Tables displaying the number of occurrences, distributions, and return statistics for each ordinal pattern.
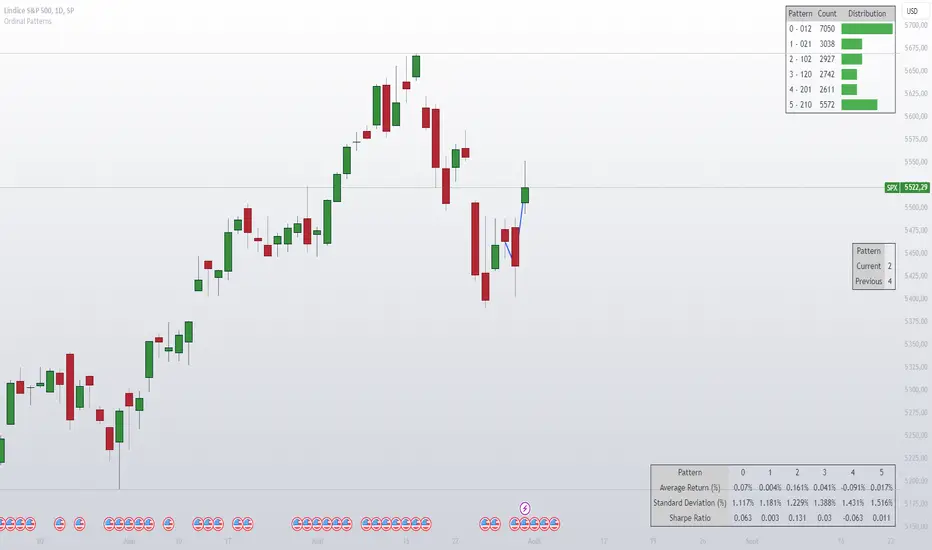
What the Script Shows:
• Table motifs_table : Number of occurrences and distribution of each ordinal pattern. An uneven distribution between patterns (different by one sixth for each pattern) can indicate market inefficiency.
• Table pattern_analysis : Analysis of returns (mean, standard deviation, Sharpe ratio) for each ordinal pattern.
• Table current_motif_table : Ordinal pattern of the last bar.
This script helps to understand and visualize how ordinal patterns influence future returns of financial asset prices. An uneven distribution of patterns can indicate market inefficiencies.
An ordinal pattern will tell you how these values are positioned relative to each other.
We do not look at the exact values, but only their order.
Concrete Example
• 4 (position 1 in the original sequence) is in position 2 in the ordered sequence.
• 7 (position 2 in the original sequence) is in position 3 in the ordered sequence.
• 2 (position 3 in the original sequence) is in position 1 in the ordered sequence.
The ordinal pattern for this sequence is then (2,3,1)(2, 3, 1)(2,3,1).
Script Explanation
This script analyzes ordinal patterns based on the closing prices of the last three bars and calculates the future gains associated with each ordinal pattern.
The main elements of the script are:
1. ordinal_pattern Function:
o Determines the ordinal pattern based on three past closing values.
o Returns an index (from 0 to 5) corresponding to one of the six possible ordinal patterns.
2. Calculations and Storage:
o For each new bar, the last three closes are used to identify the ordinal pattern.
o Future gains are calculated and associated with the previous ordinal pattern.
o Return statistics (mean, standard deviation and Sharpe ratio) are calculated for each pattern.
3. Visualization:
o Draws lines connecting the last three closes.
o Tables displaying the number of occurrences, distributions, and return statistics for each ordinal pattern.
What the Script Shows:
• Table motifs_table : Number of occurrences and distribution of each ordinal pattern. An uneven distribution between patterns (different by one sixth for each pattern) can indicate market inefficiency.
• Table pattern_analysis : Analysis of returns (mean, standard deviation, Sharpe ratio) for each ordinal pattern.
• Table current_motif_table : Ordinal pattern of the last bar.
This script helps to understand and visualize how ordinal patterns influence future returns of financial asset prices. An uneven distribution of patterns can indicate market inefficiencies.
Release Notes
adding the previous pattern in the tableOpen-source script
In true TradingView spirit, the creator of this script has made it open-source, so that traders can review and verify its functionality. Kudos to the author! While you can use it for free, remember that republishing the code is subject to our House Rules.
For quick access on a chart, add this script to your favorites — learn more here.
Sigaud | Junior Quantitative Trader & Developer
Combining technical expertise with analytical precision.
Gaining experience and growing in the field.
📧 Contact: from the website
Combining technical expertise with analytical precision.
Gaining experience and growing in the field.
📧 Contact: from the website
Disclaimer
The information and publications are not meant to be, and do not constitute, financial, investment, trading, or other types of advice or recommendations supplied or endorsed by TradingView. Read more in the Terms of Use.
Open-source script
In true TradingView spirit, the creator of this script has made it open-source, so that traders can review and verify its functionality. Kudos to the author! While you can use it for free, remember that republishing the code is subject to our House Rules.
For quick access on a chart, add this script to your favorites — learn more here.
Sigaud | Junior Quantitative Trader & Developer
Combining technical expertise with analytical precision.
Gaining experience and growing in the field.
📧 Contact: from the website
Combining technical expertise with analytical precision.
Gaining experience and growing in the field.
📧 Contact: from the website
Disclaimer
The information and publications are not meant to be, and do not constitute, financial, investment, trading, or other types of advice or recommendations supplied or endorsed by TradingView. Read more in the Terms of Use.