PROTECTED SOURCE SCRIPT
Updated ILM India Sectors NSDL FII/FPI Investments Fortnightly
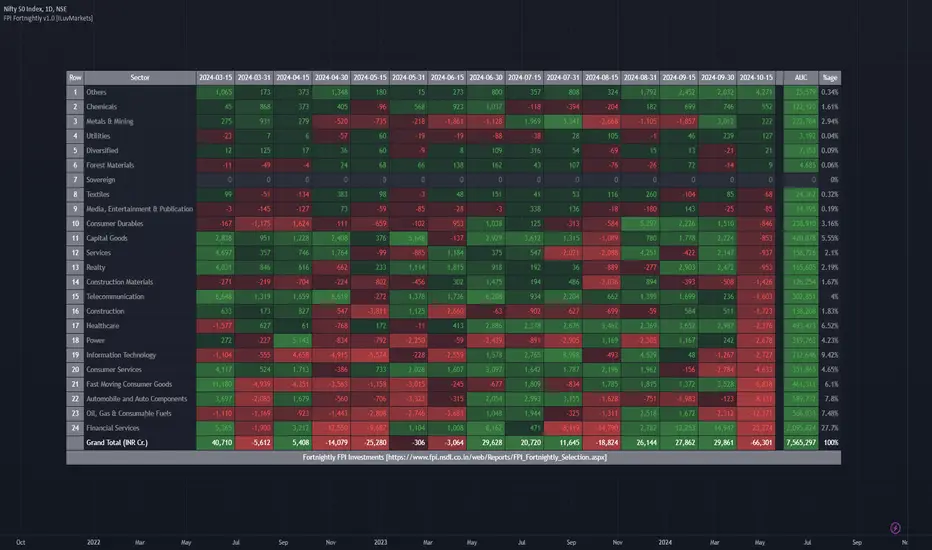
This indicator shows the FII/FPI fortnightly investments across various sectors for easy consumption.
This data is sourced from website
fpi.nsdl.co.in/web/Reports/FPI_Fortnightly_Selection.aspx
This data gets published on a fortnightly basis.
This data is very difficult to interpret and not easy to consume.
This indicator makes this data very easy to consume and make good investment decisions by tagging along with Smart Money.
Since Trading View does not expose this data via QUANDL or any other means, the data is updated in the indicator itself.
Hence, indicator needs to be updated as soon as the new data is available on a fortnightly basis.
All the numbers are in INR Cr.
The date columns represent the investment value for that fortnight for the sector
AUC column represents the total Assets held by FPI in that sector
%age column represents the %age of Assets in the sector compared to Total FPI investment
Features Planned in future
- Drill down to Group-A stocks in the sector and show the performance of the stock (% Change, Volume, Delivery) fortnightly so specific stock can be identified
Send me a DM if you would like to see any additional features on this indicator
Release Notes
Better screenshotRelease Notes
- Updated data for Nov 30th, 2022
Release Notes
- Updated data for 2022-12-15
Release Notes
- Updated for Dec 31, 2022
Release Notes
Updated data for Jan 15, 2023Release Notes
- Fixed row number
Release Notes
- Fixed row numbers
Release Notes
Data update for Jan 31, 2023Release Notes
Updated for Feb 15, 2023Release Notes
Updated data for Feb 28, 2023Release Notes
Added data for Mar 15, 2023Release Notes
FixRelease Notes
Fixed Row#Release Notes
Updated data for Mar 31, 2023Release Notes
Updated until Jul 31st 2023Release Notes
Updated data until Sep 15th, 2023Release Notes
Fixed Row#Release Notes
Updated data for Sep 30, 2023Release Notes
Update for Oct, 2023Release Notes
Updated data for Nov 2023Release Notes
Added data for Dec 15, 2023Release Notes
Updated till 2024-01-19Release Notes
Updated till Jan 31st, 2024Release Notes
Updated for Feb, 2024Release Notes
Updated for Mar 15, 2024Release Notes
Updated for Apr 4, 2024Release Notes
Updated for Apr 15, 2024Release Notes
Updated till May 15, 2024Release Notes
Updated till May 31, 2024Release Notes
Updated for Jun 2024Release Notes
Updated for July 2024Release Notes
Update for Aug 15, 2024Release Notes
Update till Oct 15, 2024Protected script
This script is published as closed-source. However, you can use it freely and without any limitations – learn more here.
Disclaimer
The information and publications are not meant to be, and do not constitute, financial, investment, trading, or other types of advice or recommendations supplied or endorsed by TradingView. Read more in the Terms of Use.
Protected script
This script is published as closed-source. However, you can use it freely and without any limitations – learn more here.
Disclaimer
The information and publications are not meant to be, and do not constitute, financial, investment, trading, or other types of advice or recommendations supplied or endorsed by TradingView. Read more in the Terms of Use.