OPEN-SOURCE SCRIPT
Change of Character Fan
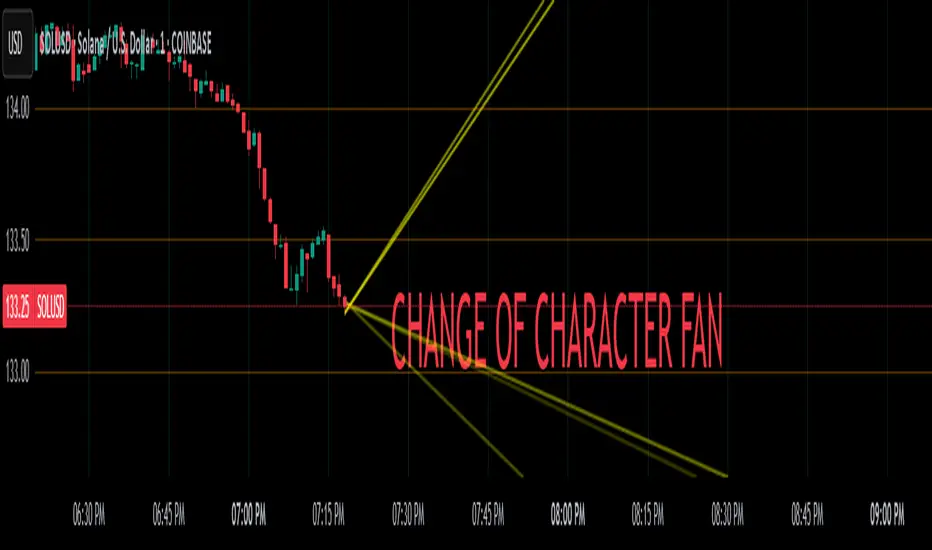
Change of Character Fan
Overview
The Change of Character Fan is designed to help traders detect shifts (changes of character) in market direction and sentiment before they become fully visible through traditional candlestick analysis. Instead of relying solely on the shape or close of candlesticks, this indicator offers a direct, real-time look at the internal price action occurring within a single bar. This visibility into intrabar dynamics can potentially allow traders to enter or exit trades earlier, minimize false signals, and reduce their dependence on multiple lower-timeframe charts.
How it Works:
The indicator plots a "fan" consisting of five distinct slope lines within the current bar. Each line represents the internal trend of price movement based on user-defined lower timeframe data intervals.
By default, these intervals are set to 3, 5, 8, 13, and 21 samples from 1-second timeframe data.
Each line only appears when it has collected the minimum required number of intrabar data points.
The fan lines use a progressive opacity scale (lighter to darker), visually highlighting the confidence level or probability of directional continuation within the current bar.
At the open of every new bar, the fan disappears completely and gradually reappears as new data is gathered, ensuring clarity and eliminating outdated signals.
Understanding the Mathematics: Linear Regression Model
This indicator is built around the concept of a linear regression model. Linear regression is a statistical technique used to model and analyze relationships between variables—in this case, time (independent variable) and price (dependent variable).
How Linear Regression Works:
Linear regression fits a straight line (called a "line of best fit") through a set of data points, minimizing the overall distance between each point and the line itself.
Mathematically, this is achieved by minimizing the squared differences (errors) between the observed values (actual prices) and the predicted values (prices on the line).
The linear model used here can be expressed in the form:
y = mx + b
where:
𝑦
y is the predicted price,
𝑥
x represents time (each data sample interval),
𝑚
m is the slope of the line, representing the direction and velocity of the trend,
𝑏
b is the intercept (the theoretical price when x=0).
Why a Linear Model is Beneficial in this Indicator:
Simplicity and Reliability: Linear regression is simple, robust, and widely accepted as a baseline predictive model. It requires minimal computational resources, providing instant updates in real-time trading conditions.
Immediate Directional Feedback: The slope derived from linear regression immediately communicates the directional tendency of recent price action. A positive slope indicates upward pressure, and a negative slope signals downward pressure.
Noise Reduction: Even when price fluctuations are noisy or erratic, linear regression summarizes overall direction clearly, making it easier to detect genuine directional shifts (change of character) rather than random price noise.
Intrabar Analysis: Traditional candlestick analysis relies on fully formed candles, potentially delaying signals. By using linear regression on very short-term (intrabar) data, traders can detect shifts in momentum more quickly, providing an earlier signal than conventional candle patterns alone.
Practical Application:
This indicator helps traders to visually identify:
Early Trend Reversals: Intrabar analysis reveals momentum shifts potentially signaling reversals before they become obvious on conventional candles.
Momentum Continuations: Confidence is gained when all lines in the fan are clearly pointing in the same direction, indicating strong intrabar conviction.
Reduced False Signals: Traditional candlestick signals (e.g., hammer candles) sometimes produce false signals due to intrabar noise. By looking directly into intrabar dynamics, traders gain better context on whether candle patterns reflect genuine directional change or merely noise.
Important Requirements and Recommendations:
Subscription Requirements:
A TradingView subscription that supports sub-minute data (e.g., 1-second or 5-second resolution) is strongly recommended.
If your subscription doesn't include this data granularity, you must use a 1-minute lower timeframe, significantly reducing responsiveness. In this scenario, it's best suited for a 15-minute or higher chart, adjusting intervals to shorter periods.
Live Data Essential:
Real-time market data subscription is essential for the accuracy and effectiveness of this indicator.
Using delayed data reduces responsiveness and weakens the indicator's primary advantage.
Recommended Settings for Different Chart Timeframes:
1-minute chart: Use 1-second lower timeframe intervals (default intervals: 3, 5, 8, 13, 21).
5-minute chart: Adjust to a 5- or 10-second lower timeframe, possibly reducing intervals to shorter periods (e.g., 3, 5, 8, 10, 12).
15-minute or higher charts: Adjust lower timeframe to 1-minute if granular data is unavailable, with reduced interval lengths to maintain responsiveness.
Conclusion:
The Change of Character Fan empowers traders with early insight into directional shifts within each candle, significantly enhancing reaction speed, signal accuracy, and reducing dependency on multiple charts. Built on robust linear regression mathematics, it combines clarity, responsiveness, and ease-of-use in a powerful intrabar analysis tool.
Trade smarter, see sooner, and react faster.
Open-source script
In true TradingView spirit, the creator of this script has made it open-source, so that traders can review and verify its functionality. Kudos to the author! While you can use it for free, remember that republishing the code is subject to our House Rules.
For quick access on a chart, add this script to your favorites — learn more here.
Disclaimer
The information and publications are not meant to be, and do not constitute, financial, investment, trading, or other types of advice or recommendations supplied or endorsed by TradingView. Read more in the Terms of Use.