OPEN-SOURCE SCRIPT
Normalized Equity/Bond Ratio
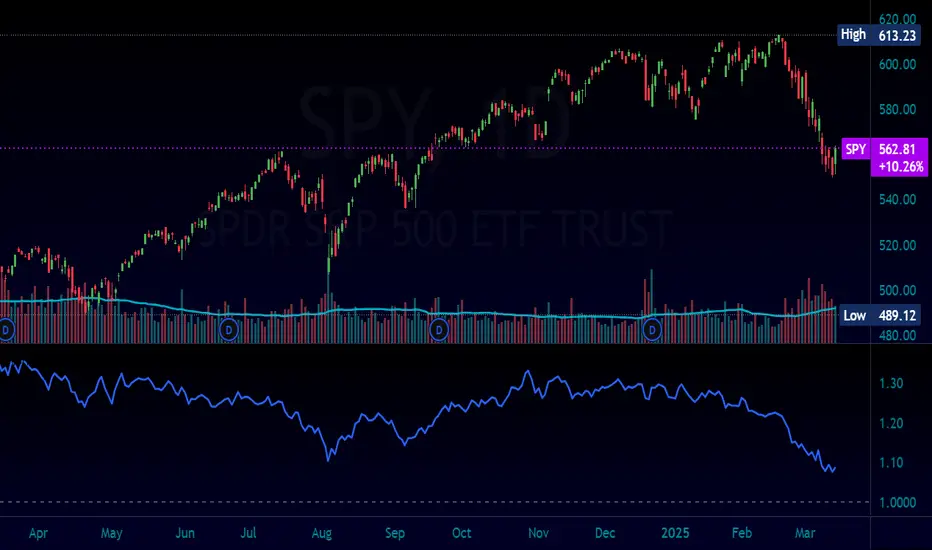
This indicator calculates a normalized equity-to-bond ratio over a 252-day lookback (~1 trading year) to assess risk-on vs. risk-off sentiment. It addresses the issue of direct ratios (e.g., SPY/TLT) being visually dominated by high nominal stock prices, which can obscure bond price movements.
A rising ratio indicates equities are outperforming bonds, suggesting risk-on conditions, while a declining ratio signals a shift toward bonds, often associated with risk-off behavior. The normalization ensures better visibility and comparability of the trend over time.
A ratio > 1 means the equity (e.g., SPY) is outperforming the bond (e.g., AGG) since the lookback. A ratio < 1 means bonds are outperforming.
Open-source script
In true TradingView spirit, the creator of this script has made it open-source, so that traders can review and verify its functionality. Kudos to the author! While you can use it for free, remember that republishing the code is subject to our House Rules.
For quick access on a chart, add this script to your favorites — learn more here.
Disclaimer
The information and publications are not meant to be, and do not constitute, financial, investment, trading, or other types of advice or recommendations supplied or endorsed by TradingView. Read more in the Terms of Use.