PROTECTED SOURCE SCRIPT
Candles History
Updated

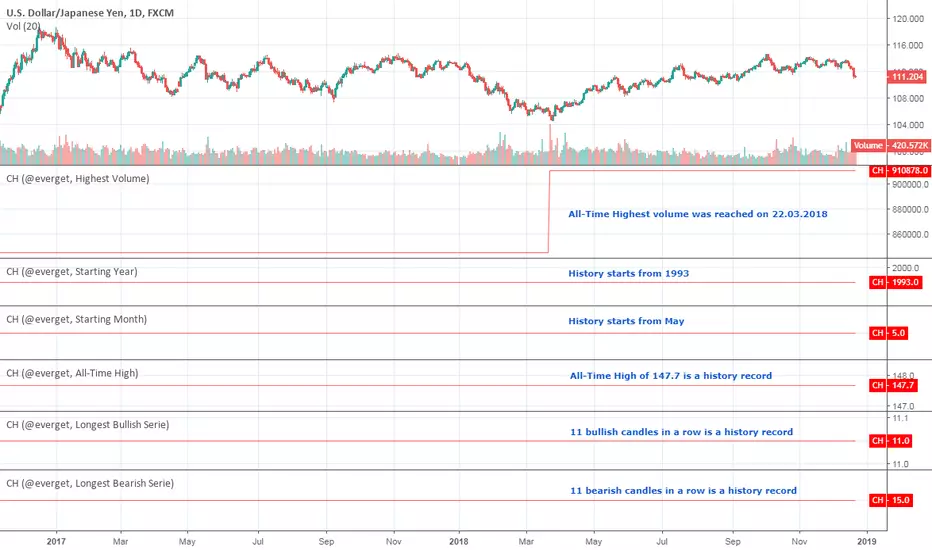
A utility tool to get some metrics from the whole candles history.
Consider it as my Christmas gift to the community.
Available metrics
Good luck!
Consider it as my Christmas gift to the community.
Available metrics
- Starting Year
- Starting Month
- Starting Day
- Starting Weekday
- Starting Hour
- Starting Minute
- Highest Volume (works correctly only on the tickers with available volume data)
- Lowest Volume (works correctly only on the tickers with available volume data)
- Longest Candle Range
- Average Candle Range
- Longest Candle Body
- Average Candle Body
- Available Candles
- Bullish Candles
- Bullish Trend Candles (body >= range / 2)
- Bearish Candles
- Bearish Trend Candles (body >= range / 2)
- Doji Candles
- Bullish Marubozu Candles
- Bearish Marubozu Candles
- Longest Bullish Serie
- Longest Bearish Serie
Good luck!
Release Notes
Add new metrics: - Longest Candle Range in Pips
- Average Candle Range in Pips
- Longest Candle Body Range in Pips
- Average Candle Body Range in Pips
- All-Time High
- All-Time Low
Protected script
This script is published closed-source and you may privately use it freely.
Want to use this script on a chart?
Freelance -> Telegram: @alex_everget
A list of FREE indicators:
bit.ly/2S7EPuN
A list of PAID indicators:
bit.ly/33MA81f
Earn $15:
tradingview.com/pricing/?share_your_love=everget
A list of FREE indicators:
bit.ly/2S7EPuN
A list of PAID indicators:
bit.ly/33MA81f
Earn $15:
tradingview.com/pricing/?share_your_love=everget
Disclaimer
The information and publications are not meant to be, and do not constitute, financial, investment, trading, or other types of advice or recommendations supplied or endorsed by TradingView. Read more in the Terms of Use.