INVITE-ONLY SCRIPT
PRO_Traiding Trend Indicator
Updated
This indicator helps to determine at what stage the market is.
What is included in this indicator:
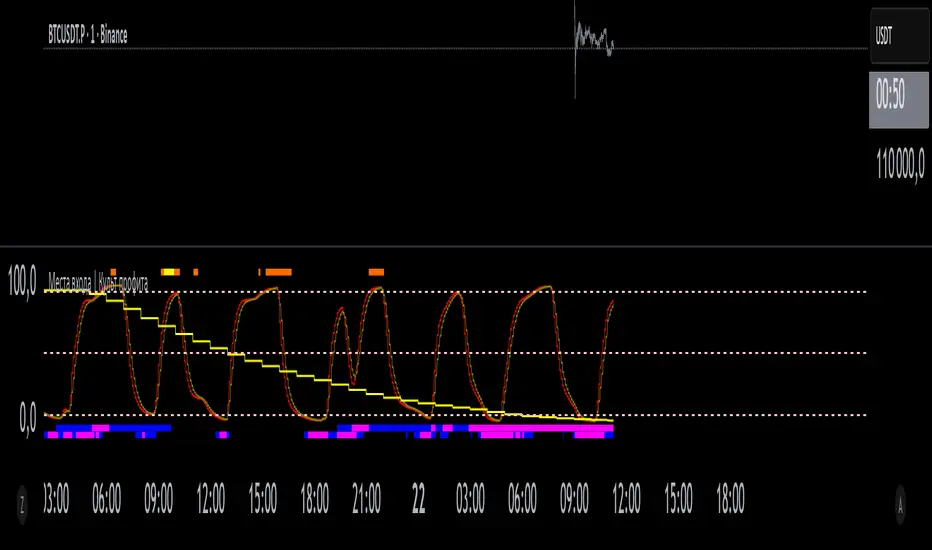
1. Trend Line - orande
2. ROP line - green and red
3. RSI Line - violet
What is the principle of the indicator?
1. Trend Line - orande
The principle of operation of this line is that at the entrance, data (closing and opening) / 2.
Further, with this data, the transformation is carried out. Then the data is fed into the RSI function.
2. ROP line - green and red
This is an auxiliary indicator based on a combined technical indicator of smoothed and weighted rates of price change from the book Martin Pring on Market Momentum
3. RSI Line - violet
Relative strength index is a technical analysis indicator that determines the strength of a trend and the likelihood of its change.
How does this indicator help in trading?
Trend Line - a trend line, orange on the chart.
This is an oscillator - showing the direction of the trend, as well as the phase in which the trend is.
The Trend Line ranges from 0 to 100. Control lines are drawn through 5 from the bottom of the Low Line, and 95 from the top (Upper Line).
Bullish trend
A bullish trend starts from the upward intersection of the Trend Line and the Low Line (5) and lasts until the intersection of the Trend Line and the Upper Line (95) from top to bottom.
In a phase when the trend is bullish and the Trend Line is above the Upper Line, a bull run may start. It is necessary to wait for the culmination of purchases.
What information and benefits we get from the indicator:
1. Knowing in what phase the market, ie. in the growth phase. You understand that you need to trade up. And don't go against the trend.
2. Seeing that the indicator is above line 95 (Upper Line), you understand that a bull run can happen, and you should also wait for the culmination of price growth and close long positions.
Bearish trend
The bearish trend starts from the top down intersection of the Trend Line and the Upper Line (95) and lasts until the upward intersection of the Trend Line and the Low Line (5).
In the phase when the trend is bearish and the Trend Line is below the Low Line, a panic sale may start. It is necessary to wait for the culmination of sales.
What information and benefits we get from the indicator:
1. Knowing in what phase the market, ie. in the fall phase. You understand that you need to trade down. And don't go against the trend.
2. Seeing that the indicator is below line 5 (Low Line), you understand that a panic sale can happen, and you should also wait for the culmination of the price fall and close the short position.
ROP line - Rate of price change
This is the price rate line. It helps to find the culmination point and reversal, as well as to understand the price direction.
This indicator consists of two lines:
- Green line - main;
- The red line is the signal line.
There is also a Zero Line.
Usage logic
Direction of movement and position of the relative Zero line
Bullish trend
If the indicator lines are above the Zero Line, as well as the green line above the red, this means an upward movement. The trend is bullish.
If the indicator lines are above the Zero Line, and the green line is below the red one, it means that the price has reversed and is in the phase of correction or reversal.
Bearish trend
If the indicator lines are below the Zero Line and the green line is below the red one, it means that the price is going down. The trend is bearish.
If the indicator lines are below the Zero Line, as well as the green line above the red, then the price has reversed and is either in a correction or reversal phase.
Climax points
Climax points are pivot points. A reversal occurs when the green and red lines cross.
When the green line crosses the red one upwards, the trend will go up.
When the green line crosses the red one downwards, the trend will go down.
The culmination of purchases and a reversal should be expected provided that the indicator lines are above the Zero Line, and the green line crosses the red one from top to bottom.
The climax of selling and a reversal must be expected provided that the indicator lines are below the Zero Line, and the green line crosses the red one from top to bottom.
3. RSI Line
The RSI line is needed as an auxiliary tool.
If you missed the entry point, then you need to enter the position on the pullback of the RSI line. In the same direction as that of the Trend Line.
Use the link below to obtain For more info and screenshots please visit Website Tab Trand Indicator.
Please do not ask permission to access the comments.
To get access, use the link below to obtain please refer to our website, there in the indicator section there is a return form for the application..
Who used this script, please leave a comment below.
What is included in this indicator:
1. Trend Line - orande
2. ROP line - green and red
3. RSI Line - violet
What is the principle of the indicator?
1. Trend Line - orande
The principle of operation of this line is that at the entrance, data (closing and opening) / 2.
Further, with this data, the transformation is carried out. Then the data is fed into the RSI function.
2. ROP line - green and red
This is an auxiliary indicator based on a combined technical indicator of smoothed and weighted rates of price change from the book Martin Pring on Market Momentum
3. RSI Line - violet
Relative strength index is a technical analysis indicator that determines the strength of a trend and the likelihood of its change.
How does this indicator help in trading?
Trend Line - a trend line, orange on the chart.
This is an oscillator - showing the direction of the trend, as well as the phase in which the trend is.
The Trend Line ranges from 0 to 100. Control lines are drawn through 5 from the bottom of the Low Line, and 95 from the top (Upper Line).
Bullish trend
A bullish trend starts from the upward intersection of the Trend Line and the Low Line (5) and lasts until the intersection of the Trend Line and the Upper Line (95) from top to bottom.
In a phase when the trend is bullish and the Trend Line is above the Upper Line, a bull run may start. It is necessary to wait for the culmination of purchases.
What information and benefits we get from the indicator:
1. Knowing in what phase the market, ie. in the growth phase. You understand that you need to trade up. And don't go against the trend.
2. Seeing that the indicator is above line 95 (Upper Line), you understand that a bull run can happen, and you should also wait for the culmination of price growth and close long positions.
Bearish trend
The bearish trend starts from the top down intersection of the Trend Line and the Upper Line (95) and lasts until the upward intersection of the Trend Line and the Low Line (5).
In the phase when the trend is bearish and the Trend Line is below the Low Line, a panic sale may start. It is necessary to wait for the culmination of sales.
What information and benefits we get from the indicator:
1. Knowing in what phase the market, ie. in the fall phase. You understand that you need to trade down. And don't go against the trend.
2. Seeing that the indicator is below line 5 (Low Line), you understand that a panic sale can happen, and you should also wait for the culmination of the price fall and close the short position.
ROP line - Rate of price change
This is the price rate line. It helps to find the culmination point and reversal, as well as to understand the price direction.
This indicator consists of two lines:
- Green line - main;
- The red line is the signal line.
There is also a Zero Line.
Usage logic
Direction of movement and position of the relative Zero line
Bullish trend
If the indicator lines are above the Zero Line, as well as the green line above the red, this means an upward movement. The trend is bullish.
If the indicator lines are above the Zero Line, and the green line is below the red one, it means that the price has reversed and is in the phase of correction or reversal.
Bearish trend
If the indicator lines are below the Zero Line and the green line is below the red one, it means that the price is going down. The trend is bearish.
If the indicator lines are below the Zero Line, as well as the green line above the red, then the price has reversed and is either in a correction or reversal phase.
Climax points
Climax points are pivot points. A reversal occurs when the green and red lines cross.
When the green line crosses the red one upwards, the trend will go up.
When the green line crosses the red one downwards, the trend will go down.
The culmination of purchases and a reversal should be expected provided that the indicator lines are above the Zero Line, and the green line crosses the red one from top to bottom.
The climax of selling and a reversal must be expected provided that the indicator lines are below the Zero Line, and the green line crosses the red one from top to bottom.
3. RSI Line
The RSI line is needed as an auxiliary tool.
If you missed the entry point, then you need to enter the position on the pullback of the RSI line. In the same direction as that of the Trend Line.
Use the link below to obtain For more info and screenshots please visit Website Tab Trand Indicator.
Please do not ask permission to access the comments.
To get access, use the link below to obtain please refer to our website, there in the indicator section there is a return form for the application..
Who used this script, please leave a comment below.
Release Notes
In this update, another line has been added - ROP RSI (red rop rsi line)This is RSI, with an incoming ROP.
What does this line show?
It has the same function as a regular ROP line.
Added for convenience.
What is the logic of work?
Sell when crossing line 95 from top to bottom.
It is even better if the Trend Line is also greater than line 95.
Buy when crossing line 5 from top to bottom.
It is even better if the Trend Line is also below line 5.
Release Notes
Added option to change time frame (resolution)Release Notes
Update scrin shotRelease Notes
add filter line for 5-8-15m strategy.update rsi line algoritm.
Release Notes
Opportunity to change boundaries 5-95.A simple way to install alerts.
Release Notes
Добавлен новый фильтр, NRFL - New Filter ROP.С помощью данного фильтра можно распознать разворот немного раньше ROP RSI. Что дает преимущество в торговле.
Используется на все тф, совместно с ROP RSI.
Release Notes
Добавлена возможность добавления на один индикатор линию ROP RSI, другого таймфрейма. Обновлен алгоритм линии RSI.
Release Notes
Добавлена возможность смены тайм фрейма на основных инструментах.Release Notes
Возможность изменять тайм фрейм rsi lineRelease Notes
По просьбам трудящихся RSI Line пере позиционирована.Release Notes
fixRelease Notes
10-я версия индикатора.- Подкорректирован алгоритм роботы ROP RSI, удалось убрать лишние шумы.
- Добавлена медленная линия slow ROP RSI (включается в настройках). С помощью нее можно контролировать направление ROP RSI, а так же ставить оповещения на разворот.
Подписчики могут получить доступ к старой версии запросив к ней доступ.
Release Notes
- Добавлен режим автоматическая \ ручная настройка- Добавлены исправление
- Убрана лишняя линия RSI
Release Notes
Переработка автоматической настройки, добавление дополнительного тайфмрейма.Release Notes
Убрана перефильтрованность. Обновлён индикатор trend. Trend используется для определения направления. Trend над 95 и зелёный - лонг.
Trend под 5 и красный - шорт.
Release Notes
Изменено отображения Trend line автоматического и ручного режима(чтоб не склеивались)Web site - pro-traiding.ru/
Telegramm chanel - t.me/theprotrade
Telegramm chanel - t.me/theprotrade
Invite-only script
Access to this script is restricted to users authorized by the author and usually requires payment. You can add it to your favorites, but you will only be able to use it after requesting permission and obtaining it from its author. Contact PRO_Traiding for more information, or follow the author's instructions below.
Please note that this is a private, invite-only script that was not analyzed by script moderators. Its compliance to House Rules is undetermined. TradingView does not suggest paying for a script and using it unless you 100% trust its author and understand how the script works. In many cases, you can find a good open-source alternative for free in our Community Scripts.
Author's instructions
″Перейдите на сайт в профиле, найдите статью в ней есть ссылка для получения доступа.
Want to use this script on a chart?
Warning: please read before requesting access.
Disclaimer
The information and publications are not meant to be, and do not constitute, financial, investment, trading, or other types of advice or recommendations supplied or endorsed by TradingView. Read more in the Terms of Use.