OPEN-SOURCE SCRIPT
Price Move Exceed % Threshold & BE Evaluation1
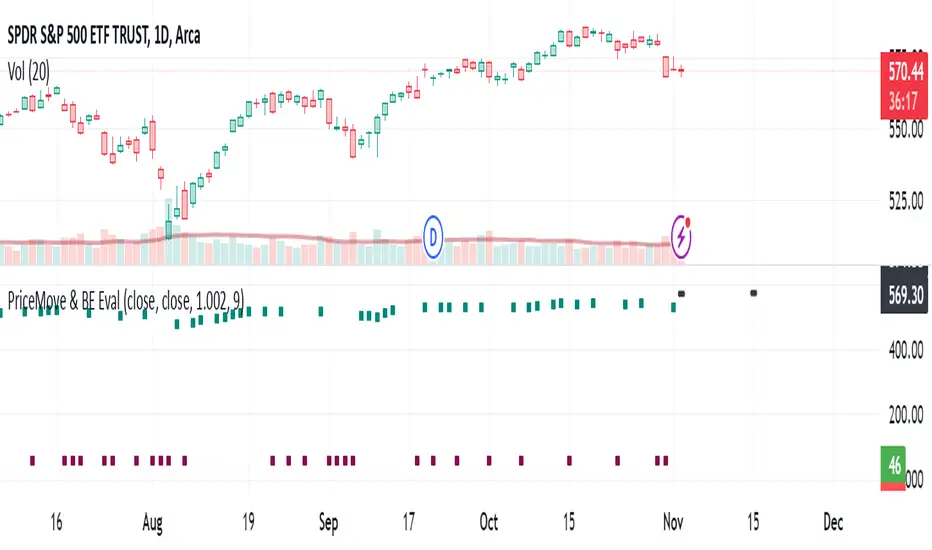
Handy to see history or quick back test of moves. Enter a decimal for percentage wanted [i.e. 0.10 for 10%] and choose the time frame wanted [i.e. 1D for daily back test]. The occurrences of the up or down threshold are plotted in the panel as maroon or green squares and can be read as red or green text in the panel data and on the right hand scale [expand scale to make all values visible if wanted]. The last [blue] number in the panel is the average move for the chosen [in inputs] period.
My usage is mostly to see what % has been exceeded for break even prices of option trades. Example: in SPY a spread has a break even of 567 when the price is 570; I get the percentage of the $3 move by dividing 3/570 to get 0.0526 [rounding though not okay not to]; the results show as described above.
My usage is mostly to see what % has been exceeded for break even prices of option trades. Example: in SPY a spread has a break even of 567 when the price is 570; I get the percentage of the $3 move by dividing 3/570 to get 0.0526 [rounding though not okay not to]; the results show as described above.
Open-source script
In true TradingView spirit, the creator of this script has made it open-source, so that traders can review and verify its functionality. Kudos to the author! While you can use it for free, remember that republishing the code is subject to our House Rules.
For quick access on a chart, add this script to your favorites — learn more here.
Disclaimer
The information and publications are not meant to be, and do not constitute, financial, investment, trading, or other types of advice or recommendations supplied or endorsed by TradingView. Read more in the Terms of Use.