OPEN-SOURCE SCRIPT
Choppiness Index (levels)
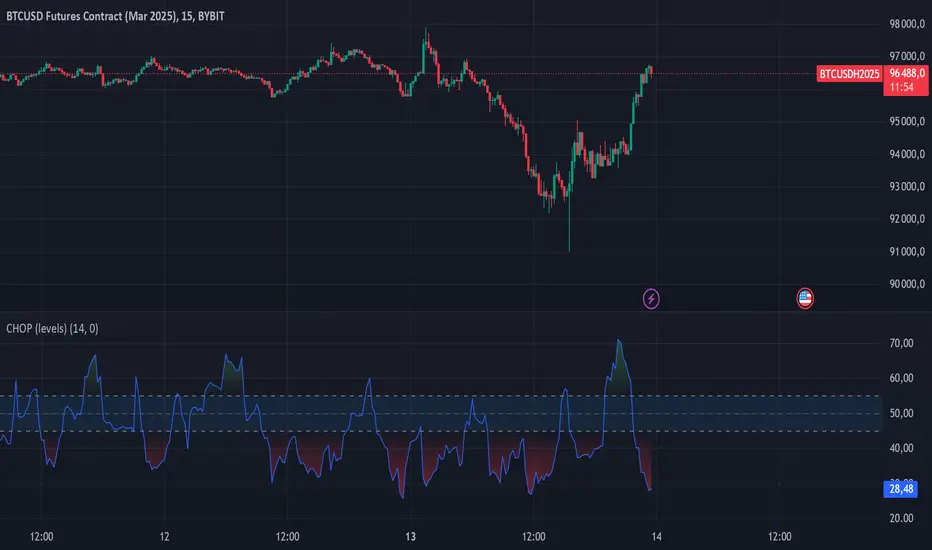
This Pine Script is a Choppiness Index Indicator with gradient visual enhancements. The Choppiness Index is a technical analysis tool that measures the "choppiness" or sideways movement of the market. It ranges from 0 to 100, where higher values indicate a more consolidated or sideways market, and lower values suggest a trending market.
Key Features:
Choppiness Index Calculation:
The script calculates the Choppiness Index based on the Average True Range (ATR) and the highest and lowest prices over a user-defined period (length).
Visual Bands:
Horizontal dashed lines are drawn at levels 55 (Upper Band), 50 (Middle Band), and 45 (Lower Band) to define key levels for interpreting the indicator.
Gradient Fills:
A blue fill is applied between the upper and lower bands (45–55) for visual clarity.
Dynamic gradients are applied to the areas:
Above the Upper Band (55–100): A green gradient fill where the color intensity increases with higher values.
Below the Lower Band (0–45): A red gradient fill where the color intensity increases with lower values.
Offset Option:
The offset input allows users to shift the Choppiness Index plot horizontally for visualization or alignment purposes.
Usage:
This indicator helps traders quickly assess market conditions:
Values above 55 indicate a choppy, non-trending market.
Values below 45 indicate a trending market.
The gradient fills make it easier to spot extreme conditions visually.
Customization:
Users can adjust:
length: The calculation period for the Choppiness Index.
offset: Horizontal shift of the Choppiness Index plot.
The gradient colors (green and red) and transparency levels are customizable in the script.
This enhanced visualization is ideal for traders who want a clear and intuitive representation of market choppiness, combined with visually striking gradient fills for quick analysis of market conditions.
Open-source script
In true TradingView spirit, the creator of this script has made it open-source, so that traders can review and verify its functionality. Kudos to the author! While you can use it for free, remember that republishing the code is subject to our House Rules.
For quick access on a chart, add this script to your favorites — learn more here.
Disclaimer
The information and publications are not meant to be, and do not constitute, financial, investment, trading, or other types of advice or recommendations supplied or endorsed by TradingView. Read more in the Terms of Use.