OPEN-SOURCE SCRIPT
Trade 1 + Statergy
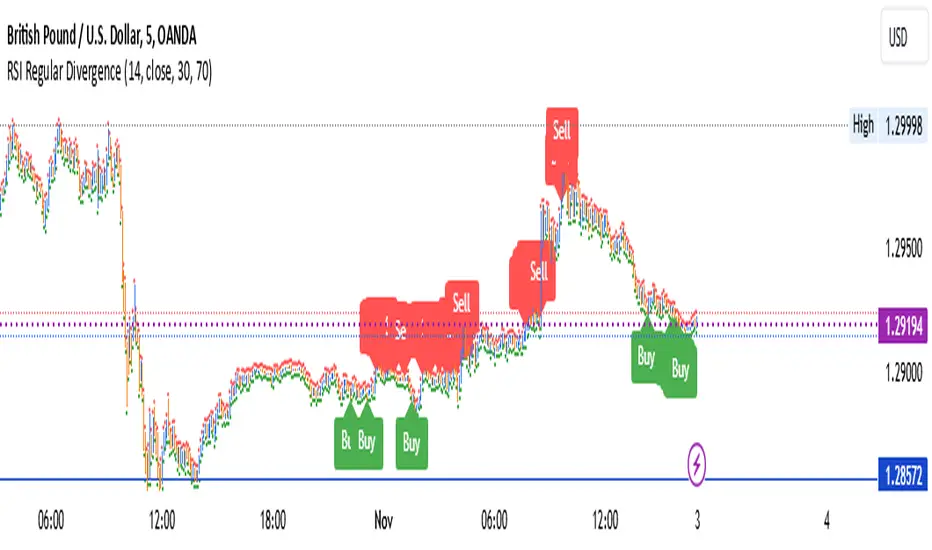
The Relative Strength Index (RSI) is a momentum oscillator used in technical analysis that measures the speed and change of price movements of a security within a range of 0 to 100. It is most commonly set to a 14-period timeframe and helps traders identify overbought or oversold conditions, suggesting potential reversal points in the market. Divergence occurs when the price trend and the RSI trend move in opposite directions. A bullish divergence signals potential upward movement when prices are making new lows while the RSI makes higher lows. Conversely, a bearish divergence suggests a possible downward trend when prices are making new highs but the RSI is making lower highs. These signals are crucial for traders looking to capture shifts in momentum and adjust their trading strategies accordingly.
use full to
5 min
10 min
15 min decition
use full to
5 min
10 min
15 min decition
Open-source script
In true TradingView spirit, the creator of this script has made it open-source, so that traders can review and verify its functionality. Kudos to the author! While you can use it for free, remember that republishing the code is subject to our House Rules.
Disclaimer
The information and publications are not meant to be, and do not constitute, financial, investment, trading, or other types of advice or recommendations supplied or endorsed by TradingView. Read more in the Terms of Use.