OPEN-SOURCE SCRIPT
Updated POC bands 2.0 and other assorted goodies

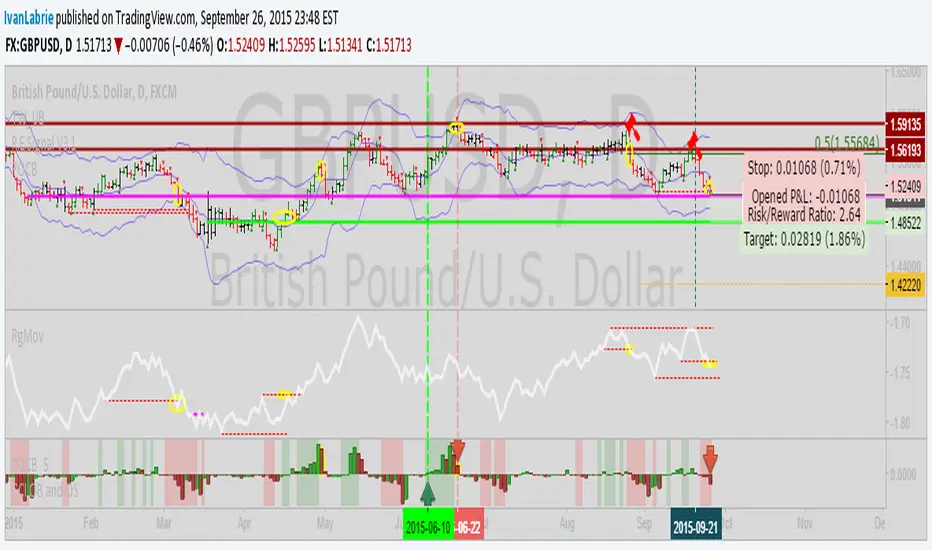
I updated my old indicator that plotted a Kalman filter avg. of the bars inside a higher timeframe bar, to attempt to find the most frequent price in that bar's timespan.
It ended up being somewhat close, but not exact, but the result is that you get a pseudo-vwap without a need for volume data, that isn't cumulative and can indicate trend direction, or if the market's ranging.
This is very powerful information!
I highlight a trade setup we get here, derived from observing the indicator's slope and knowing how to read price action, assisted by rgmov and cci readings.
To get the code for the other indicator's you will have to click on share, and then on 'Make it mine' so you get the whole layout.
Good luck and hope you find these of use.
Cheers,
Ivan.
Open-source script
In true TradingView spirit, the creator of this script has made it open-source, so that traders can review and verify its functionality. Kudos to the author! While you can use it for free, remember that republishing the code is subject to our House Rules.
For quick access on a chart, add this script to your favorites — learn more here.
Disclaimer
The information and publications are not meant to be, and do not constitute, financial, investment, trading, or other types of advice or recommendations supplied or endorsed by TradingView. Read more in the Terms of Use.