OPEN-SOURCE SCRIPT
Stochastic/LSMA
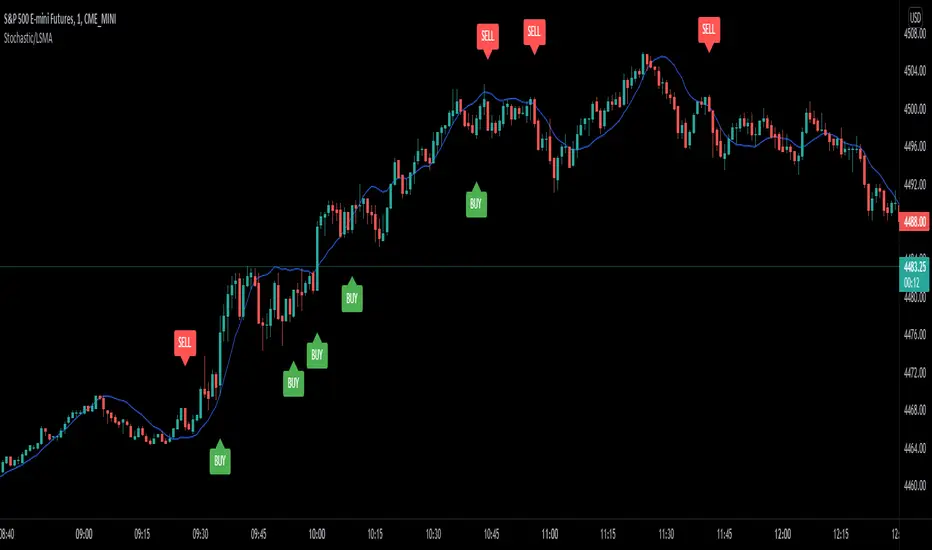
This is the Stochastic/LSMA Buy and Sell indicator. The Buy signal is generated when the %K line crosses up above the %D line from the stochastics while the signal candle is green and has come after a red candle. The Sell signal is generated when the %K line crosses down below the %D line from the stochastics while the signal candle is red and has come after a green candle. The default settings are %K Length is 5, the %K Smoothing is 3, and the %D Smoothing is 3 with the LSMA period being 30. I use this indicator to scalp 2 points at a time on the E-Mini (ES) on a 1 minute timeframe. I like to use a stop loss of 2 points and a target of 2 points. The LSMA helps to reduce fake signals and should also be used to see the overall trend. I hope this helps.
Open-source script
In true TradingView spirit, the creator of this script has made it open-source, so that traders can review and verify its functionality. Kudos to the author! While you can use it for free, remember that republishing the code is subject to our House Rules.
Disclaimer
The information and publications are not meant to be, and do not constitute, financial, investment, trading, or other types of advice or recommendations supplied or endorsed by TradingView. Read more in the Terms of Use.