Volatility Strategy (Long Only)
-Added Alerts for Current Time Frame, Daily Time Frame, and Weekly Time Frame Signals
-Made Signals on Chart Larger so it can be easier to see
7-day Free Trial
Please DM if you would like to test this code out for yourself.
This Code is best suitable for Longer TIme Frames. Generally works best for time frames above 30min, and best results are seen on 8hr and Daily Charts.
Read Carefully Before Proceeding
What this code is intended to do:
Financial instruments such as stocks and crypto move in cycles: period of low volatility (where the accumulation takes place and financial instruments move sideways) is followed by period of high volatility (where instruments make larger than usual moves). This script attempts to achieve that: to enter in period of low volatility where risk is relatively low, and exit when the volatility spikes, leading to larger than average move.
How is this done?
a. QEMA (Quintuple Exponential Moving Average)- Unlike Exponential Moving Average, QEMA puts more weight on more recent data, leading to reduced lag of generated signals. Many technical analysis scripts have lags, where the move is already gone by the time a buy signal is generated.
When QEMAs of different lengths are stacked in correct order: 8QEMA is followed by 21QEMA, is followed by 34QEMA, is followed by 55QEMA, financial instruments generally move in upward direction. This is the period when we want to be going long: go with the general trend.
b. Keltner Channel and Bollinger Bands
When Bollinger Bands are inside the Keltner Channel, it indicates a period of low volatility in the market for the asset being analyzed. It means the market is in a consolidation phase, where the price of the asset is trading within a narrow range. Traders might anticipate a breakout in either direction. Traders often watch for a squeeze as it can precede a significant price movement. After a period of market calm, the asset's price could break out of its range, leading to a new trend.
c. Momentum and DTEMA
Momentum of Price is used along with Distance b/w Moving Averages for additional directional confirmation. Only when both are increasing, the buy signal is generated. Note these indicators are NOT visually displayed in this code.
Long Condition is generated when the following criteria is met:
-When QEMAs are properly stacked
-When Bollinger Bands are inside Keltner Channel
-When Momentum and DTEMA are increasing
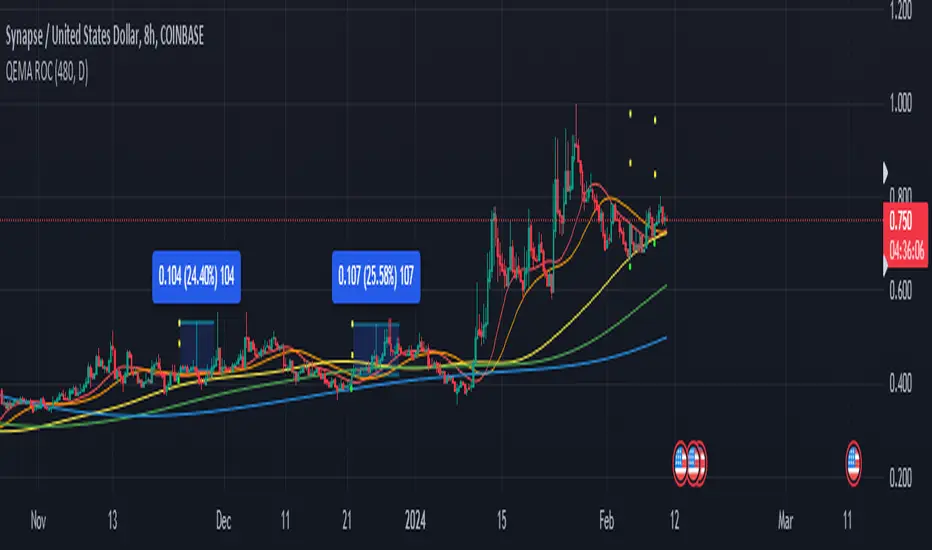
There are three different Long Signals:
Green square below the bar appears when a long signal is generated at a Current Time Frame (Time Frame that you are currently looking at)
Red X sign at top of the chart is a long signal that is generated on a Daily Chart. The script allows you to see the Daily chart alert on any time frame that you are on.
Yellow Diamonds at the bottom of the chart shows a long signal that is generated on a Weekly Chart. The script allows you to see the Weekly Chart alert on any time frame that you are on.
Top Down analysis is very important, where you should always look at the Birds-Eye view before you trade. Generally daily and especially weekly alerts can lead to very large moves in underlying assets.
Profit Targets
How are the targets calculated?
-Targets are set x standard deviations above an EMA.
-Depending what time frame you choose to have your Keltner Channel Targets, that is the time frame which the standard deviation of EMA is calculated from.
-It is recommended to put your take profit orders just below the drawn lines
-When the long signal (Current TIme Frame; Daily Time Frame; or Weekly Time Frame) is drawn, that is when Keltner Channel Targets are drawn automatically.
-If it's a daily signal, you should target daily Keltner Channel Band. If you are on 8hr time frame, and a long signal is generated, you should target a Keltner Channel of 8hr as your profit target, etc.
NOTE THAT KELTNER CHANNEL TARGETS ARE JUST ESTIMATES AND PRICE MIGHT COME CLOSE TO, BUT NOT REACH THE DESIRED TARGET
Final Note:
-Most of parts of the code are customizable in the options. All you need to do is to click the little gear that appears as you mouse over the indicator in the upper left corner.
VERY IMPORTANT
Please remember that no indicator or script can guarantee success, and its effectiveness may change according to market conditions, as past results do not indicate future performance. Always consider your risk tolerance and investment goals before trading. Always backtest your trades to ensure that your trading is profitable before trading live.
Invite-only script
Only users authorized by the author have access to this script, and this usually requires payment. You can add the script to your favorites, but you will only be able to use it after requesting permission and obtaining it from its author — learn more here. For more details, follow the author's instructions below or contact ADmytrenko2 directly.
Note that this private, invite-only script has not been reviewed by script moderators, and its compliance with House Rules is undetermined. TradingView does NOT recommend paying for or using a script unless you fully trust its author and understand how it works. You may also find free, open-source alternatives in our community scripts.
Author's instructions
Warning: please read our guide for invite-only scripts before requesting access.
Disclaimer
Invite-only script
Only users authorized by the author have access to this script, and this usually requires payment. You can add the script to your favorites, but you will only be able to use it after requesting permission and obtaining it from its author — learn more here. For more details, follow the author's instructions below or contact ADmytrenko2 directly.
Note that this private, invite-only script has not been reviewed by script moderators, and its compliance with House Rules is undetermined. TradingView does NOT recommend paying for or using a script unless you fully trust its author and understand how it works. You may also find free, open-source alternatives in our community scripts.
Author's instructions
Warning: please read our guide for invite-only scripts before requesting access.