OPEN-SOURCE SCRIPT
Updated Z Score CANDLE and Exciting candle signal [DJ D]

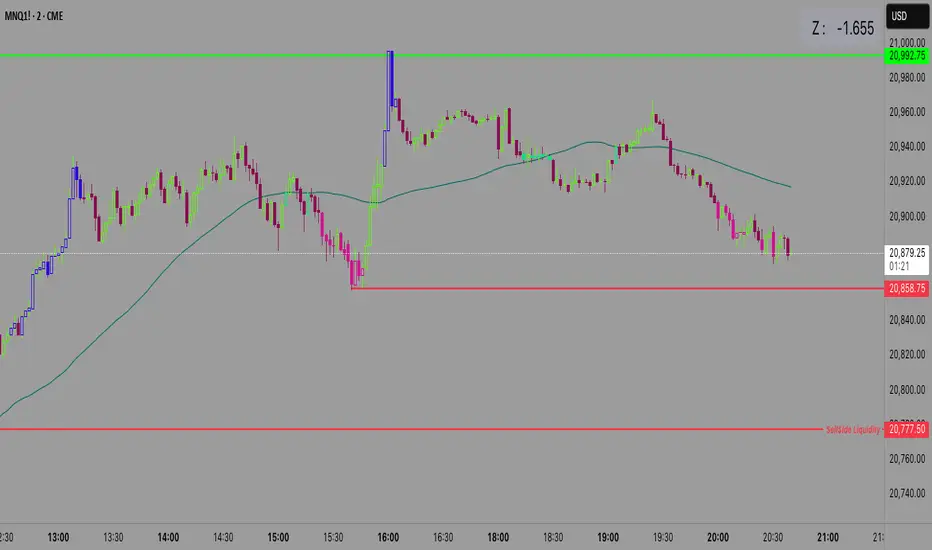
This script paints candles when their zscore reaches above 2 standard deviations in price from the mean. The blue candle represents up candle above 2. Magenta candle below -2. The candles can signal the beginning of a move and also importantly exhaustion.
The script also signals when a candle has volatility above 6. The higher the sensitivity the less frequent it will paint. These are real time paints and signals. You can adjust for higher time frames by adjusting the length of the z score and adjust the sensitivity of the volatility candles.
The yellow candle is a mean candle and can signify consolidation and/or indecision. Drawing a Darvis type box around around mean candles can give you a zone to watch.
These settings are for 1 minute scalping. The volatility sensitivity range between 1- 2 is good for 15, 30, (ie 1.0 or 1.2) and your discretion....
Release Notes
Fixed length of Z score to 60 which is better default.Added table with color change for easier navigation
Open-source script
In true TradingView spirit, the creator of this script has made it open-source, so that traders can review and verify its functionality. Kudos to the author! While you can use it for free, remember that republishing the code is subject to our House Rules.
Disclaimer
The information and publications are not meant to be, and do not constitute, financial, investment, trading, or other types of advice or recommendations supplied or endorsed by TradingView. Read more in the Terms of Use.