!BooM!
The indicator measures the relationship between Average True Range (ATR) that shows how much an asset moves, on average, during a given time frame and Standard Deviation that measuring how widely asset prices are dispersed from the average price. If prices trade in a narrow trading range, the relationship between the ATR and SD will return a low value that indicates low volatility that will lead to potential price quick movement.
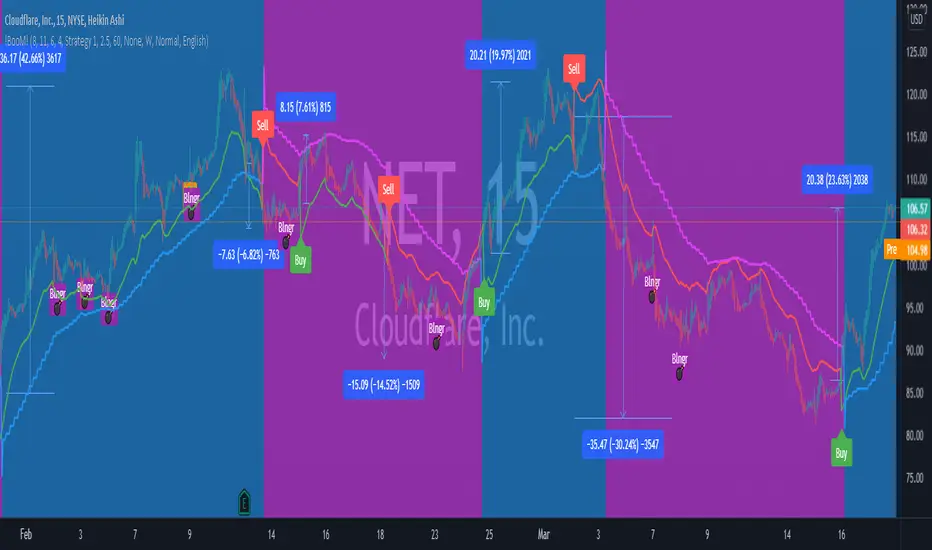
To increase the accuracy of the indicator and reduce false signals, it generates three circles, each indicate protentional price quick movement coming. For circle to print, following criteria must meet:
• Green Circle is based on low volatility and both ATR and SD are at minimum value for a short pre-defined time frame.
• Magenta Circle is based on low volatility and SD are at minimum value for a long pre-defined time frame.
• Yellow Circle is based on low volatility and SD are at minimum value for a short pre-defined time frame and Average Directional Movement Index reaching to pre-defined level.
The indicator focuses mainly on identifying potential price quick movement. However, it is equipped with two signal that is generated upon crossing the keltner channel upper or lower bands to help identifying the direction of the price movements but the user shall study the chart on big time frame to confirm the direction of the price movement.
If you would like to use it, please drop a message or find other contact under my signature.
After purchase, open the TradingView indicator library. Under the Invite-Only Scripts section, you will see it. Add it to your chart and save your chart layout.
Green circle: "Mid" mean Medium low volatility signal.
Fuchsia circle: "High" mean Very low volatility signal.
Yellow circle: "ADX" squeeze linked with Average Directional Movement Index.
اضافه خبير القمم والقيعان
Also include a panel that shows the price basic information such as pivots support and resistance, Moving Averages, 52 week high and low and daily average price range.
1. Modify the report to and classify it according to trend/momentum/volatility and volume.
2. Includes Candlestick pattern
3. Includes RSI, MACD and Stochastics divergence.
4. Added Price targets
5. Enhanced the alert setup.
Enable Alerts for :
1. Ultra High Volume
2. Money Flow
3. Ichimoku cloud breakout
4. Divergence (RSI/MACD/STO/OBV)
5.Trend Breackout
Trend plot added to the chart
Auto trailing stop.
Profit Target shown only for last Signal
Shows Ultra high volume candle and breakouts signals
and other improvements
Invite-only script
Only users authorized by the author have access to this script, and this usually requires payment. You can add the script to your favorites, but you will only be able to use it after requesting permission and obtaining it from its author — learn more here. For more details, follow the author's instructions below or contact dndn1 directly.
TradingView does NOT recommend paying for or using a script unless you fully trust its author and understand how it works. You may also find free, open-source alternatives in our community scripts.
Author's instructions
Warning: please read our guide for invite-only scripts before requesting access.
Telegram: t.me/thesmartalgo
Disclaimer
Invite-only script
Only users authorized by the author have access to this script, and this usually requires payment. You can add the script to your favorites, but you will only be able to use it after requesting permission and obtaining it from its author — learn more here. For more details, follow the author's instructions below or contact dndn1 directly.
TradingView does NOT recommend paying for or using a script unless you fully trust its author and understand how it works. You may also find free, open-source alternatives in our community scripts.
Author's instructions
Warning: please read our guide for invite-only scripts before requesting access.
Telegram: t.me/thesmartalgo