OPEN-SOURCE SCRIPT
Updated NFP High/Low Levels Plus
NFP High/Low Levels Plus
Description:
This indicator stores the 12 most recent NFP (Non-Farm-Payroll) days and their values.
Values are captured from 0830 (NFP Release) until close of market
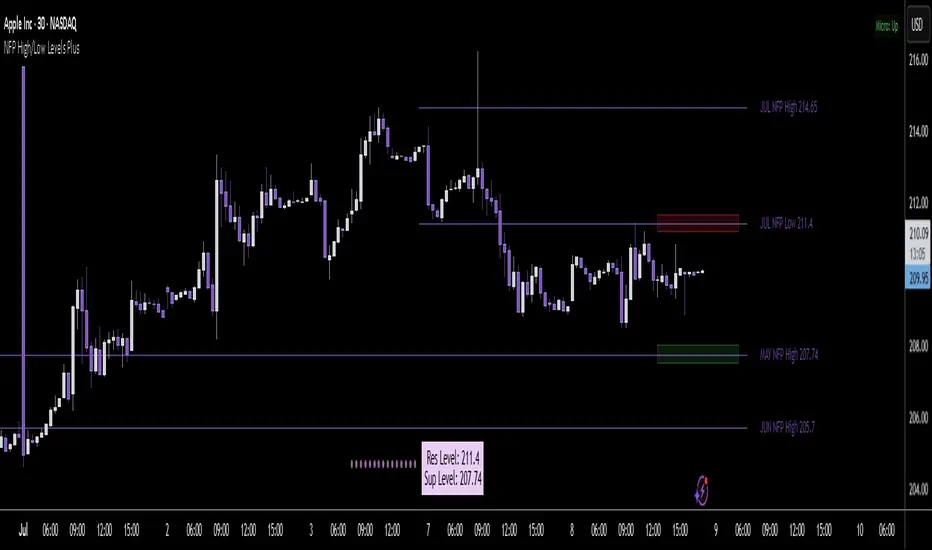
The High and Low values for each NFP month are drawn on the chart with horizontal lines.
- Labels indicating the month's high or low line are placed after the line
- Optionally the high/low price can be displayed additionally
Support and Resistance boxes can be drawn at the closest NFP level above and below the
current price.
- Boxes will automatically update as prices cross the NFP value
Macro Indicator
- This option displays a small table in the top right corner that says "Up" or " Down"
- The Macro Indicator can be used to judge the potential direction for the current month
- Macro direction is calculated by the following:
- UP: If two consecutive days both open and close above the most recent NFP High level
- DOWN: If two consecutive days both open and close below the most recent NFP Low level
Micro Indicator
- This option displays a small table in the top right corner that says "Up" or " Down"
- The Micro Indicator can be used to judge the potential direction for low timeframes 1H or
lower
- Micro direction is calculated by the following:
- UP: If two consecutive 10m candles close above the 20EMA
- DOWN: If two consecutive 10m candles close below the 20EMA
NFP Session Bars
- This feature draws an arrow at the bottom of the chart for each candle that falls within the
NFP session day
- This is useful for identifying NFP Days
Support / Resistance Table
- This displays a table bottom center showing the nearest high and low NFP line level
What is an NFP Day and why is it useful to add to my chart?
- NFP Days are one of the most important data releases monthly
- NFP (Non-Farm-Payroll) is the official release of 80% of the US workforce employed in
manufacturing, construction, and goods
- It does not include those who work on farms, private households, non-profit and
government workers
- Historically these high/low levels for the day create strong support and resistance levels
- Having them displayed on the chart can help identify potential strong levels and pivot points

Full Indicator with all options enabled and identified

Easily update NFP Release Days in the indicator settings

Modify various options: Show/Hide lines, labels, directional indicator tables, values tables
Adjust line width, offsets, colors, font sizes, box widths

Enable individual Directional Indicators and modify colors

Example of full indicator enabled
You can find a list of the NFP Release Schedule on the official US Bureau of Labor Statistics website. This is useful for updating the indicator settings with the correct dates
Description:
This indicator stores the 12 most recent NFP (Non-Farm-Payroll) days and their values.
Values are captured from 0830 (NFP Release) until close of market
The High and Low values for each NFP month are drawn on the chart with horizontal lines.
- Labels indicating the month's high or low line are placed after the line
- Optionally the high/low price can be displayed additionally
Support and Resistance boxes can be drawn at the closest NFP level above and below the
current price.
- Boxes will automatically update as prices cross the NFP value
Macro Indicator
- This option displays a small table in the top right corner that says "Up" or " Down"
- The Macro Indicator can be used to judge the potential direction for the current month
- Macro direction is calculated by the following:
- UP: If two consecutive days both open and close above the most recent NFP High level
- DOWN: If two consecutive days both open and close below the most recent NFP Low level
Micro Indicator
- This option displays a small table in the top right corner that says "Up" or " Down"
- The Micro Indicator can be used to judge the potential direction for low timeframes 1H or
lower
- Micro direction is calculated by the following:
- UP: If two consecutive 10m candles close above the 20EMA
- DOWN: If two consecutive 10m candles close below the 20EMA
NFP Session Bars
- This feature draws an arrow at the bottom of the chart for each candle that falls within the
NFP session day
- This is useful for identifying NFP Days
Support / Resistance Table
- This displays a table bottom center showing the nearest high and low NFP line level
What is an NFP Day and why is it useful to add to my chart?
- NFP Days are one of the most important data releases monthly
- NFP (Non-Farm-Payroll) is the official release of 80% of the US workforce employed in
manufacturing, construction, and goods
- It does not include those who work on farms, private households, non-profit and
government workers
- Historically these high/low levels for the day create strong support and resistance levels
- Having them displayed on the chart can help identify potential strong levels and pivot points
Full Indicator with all options enabled and identified
Easily update NFP Release Days in the indicator settings
Modify various options: Show/Hide lines, labels, directional indicator tables, values tables
Adjust line width, offsets, colors, font sizes, box widths
Enable individual Directional Indicators and modify colors
Example of full indicator enabled
You can find a list of the NFP Release Schedule on the official US Bureau of Labor Statistics website. This is useful for updating the indicator settings with the correct dates
Release Notes
Fixed bug that prevented S/R boxes from being drawn correctly after a new NFP value was set without removing and re-adding indicatorRelease Notes
- found a bug with the Macro Indicator and timeframes under Daily. - changed so that Macro Indicator only shows on Daily charts to avoid issues
Open-source script
In true TradingView spirit, the creator of this script has made it open-source, so that traders can review and verify its functionality. Kudos to the author! While you can use it for free, remember that republishing the code is subject to our House Rules.
For quick access on a chart, add this script to your favorites — learn more here.
Disclaimer
The information and publications are not meant to be, and do not constitute, financial, investment, trading, or other types of advice or recommendations supplied or endorsed by TradingView. Read more in the Terms of Use.