Advanced Momentum Scanner [QuantAlgo]The Advanced Momentum Scanner is a sophisticated technical indicator designed to identify market momentum and trend direction using multiple exponential moving averages (EMAs), momentum metrics, and adaptive visualization techniques. It is particularly valuable for those looking to identify trading and investing opportunities based on trend changes and momentum shifts across any market and timeframe.
🟢 Technical Foundation
The Advanced Momentum Scanner utilizes a multi-layered approach with four different EMA periods to identify market momentum and trend direction:
Ultra-Fast EMA for quick trend changes detection (default: 5)
Fast EMA for short-term trend analysis (default: 10)
Mid EMA for intermediate confirmation (default: 30)
Slow EMA for long-term trend identification (default: 100)
For momentum detection, the indicator implements a Rate of Change (RoC) calculation to measure price momentum over a specified period. It further enhances analysis by incorporating RSI readings for overbought/oversold conditions, volatility measurements through ATR, and optional volume confirmation. When these elements align, the indicator generates trading signals based on the selected sensitivity mode (Conservative, Balanced, or Aggressive).
🟢 Key Features & Signals
1. Multi-Period Trend Identification
The indicator combines multiple EMAs of different lengths to provide comprehensive trend analysis within the same timeframe, displaying the information through color-coded visual elements on the chart.
When an uptrend is detected, chart elements are colored with the bullish theme color (default: green/teal).
Similarly, when a downtrend is detected, chart elements are colored with the bearish theme color (default: red).
During neutral or indecisive periods, chart elements are colored with a neutral gray color, providing clear visual distinction between trending and non-trending market conditions.
This visualization provides immediate insights into underlying trend direction without requiring separate indicators, helping traders and investors quickly identify the market's current state.
2. Trend Strength Information Panel
The trend panel operates in three different sensitivity modes (Conservative, Aggressive, and Balanced), each affecting how the indicator processes and displays market information.
The Conservative mode prioritizes trend sustainability over frequency, showing only strong trend movements with high probability.
The Aggressive mode detects early trend changes, providing more frequent signals but potentially more false positives.
The Balanced mode offers a middle ground with moderate signal frequency and reliability.
Regardless of the selected mode, the panel displays:
Current trend direction (UPTREND, DOWNTREND, or NEUTRAL)
Trend strength percentage (0-100%)
Early detection signals when applicable
The active sensitivity mode
This comprehensive approach helps traders and investors:
→ Assess the strength of current market trends
→ Identify early potential trend changes before full confirmation
→ Make more informed trading and investing decisions based on trend context
3. Customizable Visualization Settings
This indicator offers extensive visual customization options to suit different trading styles and preferences:
Display options:
→ Fully customizable uptrend, downtrend, and neutral colors
→ Color-coded price bars showing trend direction
→ Dynamic gradient bands visualizing potential trend channels
→ Optional background coloring based on trend intensity
→ Adjustable transparency levels for all visual elements
These visualization settings can be fine-tuned through the indicator's interface, allowing traders and investors to create a personalized chart environment that emphasizes the most relevant information for their strategy.
The indicator also features a comprehensive alert system with notifications for:
New trend formations (uptrend, downtrend, neutral)
Early trend change signals
Momentum threshold crossovers
Other significant market conditions
Alerts can be customized and delivered through TradingView's notification system, making it easy to stay informed of important market developments even when you are away from the charts.
🟢 Practical Usage Tips
→ Trend Analysis and Interpretation: The indicator visualizes trend direction and strength directly on the chart through color-coding and the information panel, allowing traders and investors to immediately identify the current market context. This information helps in assessing the potential for continuation or reversal.
→ Signal Generation Strategies: The indicator generates potential trading signals based on trend direction, momentum confirmation, and selected sensitivity mode. Users can choose between Conservative (fewer but more reliable signals), Balanced (moderate approach), or Aggressive (more frequent but potentially less reliable signals).
→ Multi-Period Trend Assessment: Through its layered EMA approach, the indicator enables users to understand trend conditions across different lookback periods within the same timeframe. This helps in identifying the dominant trend and potential turning points.
🟢 Pro Tips
Adjust EMA periods based on your timeframe:
→ Lower values for shorter timeframes and more frequent signals
→ Higher values for higher timeframes and more reliable signals
Fine-tune sensitivity mode based on your trading style:
→ "Conservative" for position trading/long-term investing and fewer false signals
→ "Balanced" for swing trading/medium-term investing with moderate signal frequency
→ "Aggressive" for scalping/day trading and catching early trend changes
Look for confluence between components:
→ Strong trend strength percentage and direction in the information panel
→ Overall market context aligning with the expected direction
Use for multiple trading approaches:
→ Trend following during strong momentum periods
→ Counter-trend trading at band extremes during overextension
→ Early trend change detection with sensitivity adjustments
→ Stop loss placement using dynamic bands
Combine with:
→ Volume indicators for additional confirmation
→ Support/resistance analysis for strategic entry/exit points
→ Multiple timeframe analysis for broader market context
ATR

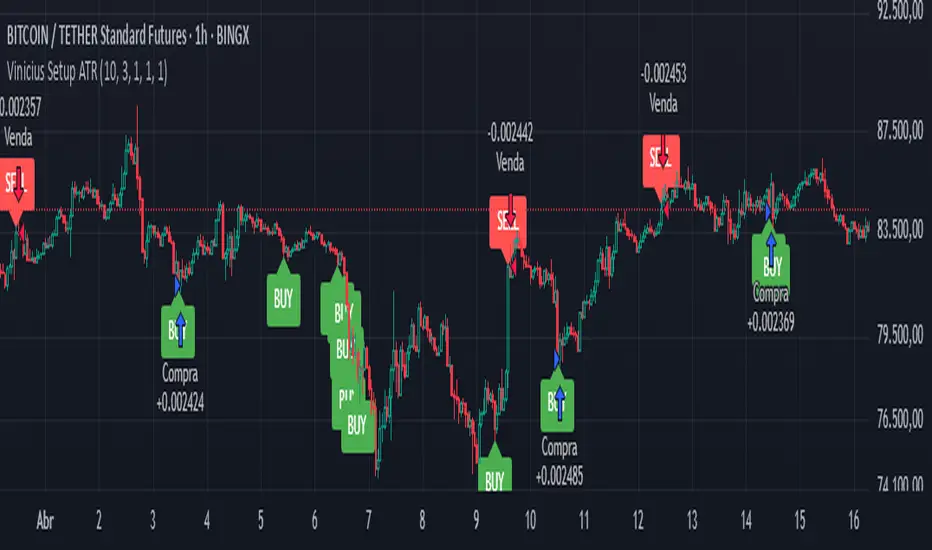
Vinicius Setup ATR
Description:
This script is a strategy based on the Supertrend indicator combined with volume analysis, candle strength, and RSI. Its goal is to identify potential entry points for buy and sell trades based on technical criteria, without promising profitability or guaranteed results.
Script Components:
Supertrend: Used as the main trend compass. When the trend is positive (direction = 1), buy signals are considered; when negative (direction = -1), sell signals are considered.
Volume: Entries are only validated if the volume is above the average of the last 20 candles, adjusted with a 1.2 multiplier.
Candle Body: The candle body must be larger than a certain percentage of the ATR, ensuring sufficient strength and volatility.
RSI: Used as a filter to avoid trades in extreme overbought or oversold zones.
Support and Resistance: Identified based on simple pivots (5 periods before and after).
Customizable Parameters:
ATR Length and Multiplier: Controls the sensitivity of the Supertrend.
RSI Period: Adjusts the relative strength filter.
Minimum Volume and Candle Body: Settings to validate entry signals.
Entry Conditions:
Buy: Positive trend + strong candle + high volume + RSI below 70.
Sell: Negative trend + strong candle + high volume + RSI above 30.
Exit Conditions:
The trade is closed upon the appearance of an opposite signal.
Notes:
This is a technical system with no profit guarantees.
It is recommended to test with realistic capital values and parameters suited to your risk management.
The script is not optimized for specific profitability, but rather to support study and the construction of setups with objective criteria.
Supertrend Hombrok BotSupertrend Hombrok Bot – Automated Trading Strategy for Dynamic Market Conditions
This trading strategy script has been developed to operate automatically based on detailed market conditions. It combines the popular Supertrend indicator, RSI (Relative Strength Index), Volume, and ATR (Average True Range) to determine the best entry and exit points while maintaining proper risk management.
Key Features:
Supertrend as the Base: Uses the Supertrend indicator to identify the market's trend direction, generating buy signals when the market is in an uptrend and sell signals when in a downtrend.
RSI Filter: The RSI is used to determine overbought and oversold conditions, helping to avoid entries in extreme market conditions. Entries are avoided when RSI > 70 (overbought) and RSI < 30 (oversold), reducing the risk of false movements.
Volume Filter: The strategy checks if the trading volume is above the average multiplied by a user-defined factor. This ensures that only significant movements, with higher liquidity, are considered.
Candle Body Size: The strategy filters only candles with a body large enough relative to the ATR (Average True Range), ensuring that the price movements on the chart have sufficient strength.
Risk Management: The bot is configured to operate with an adjustable Risk/Reward Ratio (R:R). This means that for each trade, both Take Profit (TP) and Stop Loss (SL) are adjusted based on the market's volatility as measured by the ATR.
Automatic Entries and Exits: The script automatically executes entries based on the specified conditions and exits with predefined Stop Loss and Take Profit levels, ensuring risk is controlled for each trade.
How It Works:
Buy Condition: Triggered when the market is in an uptrend (Supertrend), the volume is above the adjusted average, the candle body is strong enough, and the RSI is below the overbought level.
Sell Condition: Triggered when the market is in a downtrend (Supertrend), the volume is above the adjusted average, the candle body is strong enough, and the RSI is above the oversold level.
Alerts:
Buy and Sell Alerts are configured with detailed information, including Stop Loss and Take Profit values, allowing the user to receive notifications when trading conditions are met.
Capital Management:
The capital per trade can be adjusted based on account size and risk profile.
Important Note:
Always test before trading with real capital: While the strategy has been designed based on solid technical analysis methods, always perform tests in real-time market conditions with demo accounts before applying the bot in live trading.
Disclaimer: This script is a tool to assist in the trading process and does not guarantee profit. Past performance is not indicative of future results, and the trader is always responsible for their investment decisions.

Uptrick: Alpha TrendIntroduction
Uptrick: Alpha Trend is a comprehensive technical analysis indicator designed to provide traders with detailed insights into market trends, momentum, and risk metrics. It adapts to various trading styles—from quick scalps to longer-term positions—by dynamically adjusting its calculations and visual elements. By combining multiple smoothing techniques, advanced color schemes, and customizable data tables, the indicator offers a holistic view of market behavior.
Originality
The Alpha Trend indicator distinguishes itself by blending established technical concepts with innovative adaptations. It employs three different smoothing techniques tailored to specific trading modes (Scalp, Swing, and Position), and it dynamically adjusts its parameters to match the chosen mode. The indicator also offers a wide range of color palettes and multiple on-screen tables that display key metrics. This unique combination of features, along with its ability to adapt in real time, sets it apart as a versatile tool for both novice and experienced traders.
Features
1. Multi-Mode Trend Line
The indicator automatically selects a smoothing method based on the trading mode:
- Scalp Mode uses the Hull Moving Average (HMA) for rapid responsiveness.
- Swing Mode employs the Exponential Moving Average (EMA) for balanced reactivity.
- Position Mode applies the Weighted Moving Average (WMA) for smoother, long-term trends.
Each method is chosen to best capture the price action dynamics appropriate to the trader’s timeframe.
2. Adaptive Momentum Thresholds
It tracks bullish and bearish momentum with counters that increment as the trend confirms directional movement. When these counters exceed a user-defined threshold, the indicator generates optional buy or sell signals. This approach helps filter out minor fluctuations and highlights significant market moves.
3. Gradient Fills
Two types of fills enhance visual clarity:
- Standard Gradient Fill displays ATR-based zones above and below the trend line, indicating potential bullish and bearish areas.
- Fading Gradient Fill creates a smooth transition between the trend line and the price, visually emphasizing the distance between them.
4. Bar Coloring and Signal Markers
The indicator can color-code bars based on market conditions—bullish, bearish, or neutral—allowing for immediate visual assessment. Additionally, signal markers such as buy and sell arrows are plotted when momentum thresholds are breached.
5. Comprehensive Data Tables
Uptrick: Alpha Trend offers several optional tables for detailed analysis:
- Insider Info: Displays key metrics like the current trend value, bullish/bearish momentum counts, and ATR.
- Indicator Metrics: Lists input settings such as trend length, damping, signal threshold, and net momentum.
- Market Analysis: Summarizes overall trend direction, trend strength, Sortino ratio, return, and volatility.
- Price & Trend Dynamics: Details price deviation from the trend, trend slope, and ATR ratio.
- Momentum & Volatility Insights: Presents RSI, standard deviation (volatility), and net momentum.
- Performance & Acceleration Metrics: Focuses on the Sortino ratio, trend acceleration, return, and trend strength.
Each table can be positioned flexibly on the chart, allowing traders to customize the layout according to their needs.
Why It Combines Specific Smoothing Techniques
Smoothing techniques are essential for filtering out market noise and revealing underlying trends. The indicator combines three smoothing methods for the following reasons:
- The Hull Moving Average (HMA) in Scalp Mode minimizes lag and responds quickly to price changes, which is critical for short-term trading.
- The Exponential Moving Average (EMA) in Swing Mode gives more weight to recent data, striking a balance between speed and smoothness. This makes it suitable for mid-term trend analysis.
- The Weighted Moving Average (WMA) in Position Mode smooths out short-term fluctuations, offering a clear view of longer-term trends and reducing the impact of transient market volatility.
By using these specific methods in their respective trading modes, the indicator ensures that the trend line is appropriately responsive for the intended time frame, enhancing decision-making while maintaining clarity.
Inputs
1. Trend Length (Default: 30)
Defines the lookback period for the smoothing calculation. A shorter trend length results in a more responsive line, while a longer length produces a smoother, less volatile trend.
2. Trend Damping (Default: 0.75)
Controls the degree of smoothing applied to the trend line. Lower values lead to a smoother curve, whereas higher values increase sensitivity to price fluctuations.
3. Signal Strength Threshold (Default: 5)
Specifies the number of consecutive bullish or bearish bars required to trigger a signal. Higher thresholds reduce the frequency of signals, focusing on stronger moves.
4. Enable Bar Coloring (Default: True)
Toggles whether each price bar is colored to indicate bullish, bearish, or neutral conditions.
5. Enable Signals (Default: True)
When enabled, this option plots buy or sell arrows on the chart once the momentum thresholds are met.
6. Enable Standard Gradient Fill (Default: False)
Activates ATR-based gradient fills around the trend line to visualize potential support and resistance zones.
7. Enable Fading Gradient Fill (Default: True)
Draws a gradual color transition between the trend line and the current price, emphasizing their divergence.
8. Trading Mode (Options: Scalp, Swing, Position)
Determines which smoothing method and ATR period to use, adapting the indicator’s behavior to short-term, medium-term, or long-term trading.
9. Table Position Inputs
Allows users to select from nine possible chart positions (top, middle, bottom; left, center, right) for each data table.
10. Show Table Booleans
Separate toggles control the display of each table (Insider Info, Indicator Metrics, Market Analysis, and the three Deep Tables), enabling a customized view of the data.
Color Schemes
(Default) - The colors in the preview image of the indicator.
(Emerald)
(Sapphire)
(Golden Blaze)
(Mystic)
(Monochrome)
(Pastel)
(Vibrant)
(Earth)
(Neon)
Calculations
1. Trend Line Methods
- Scalp Mode: Utilizes the Hull Moving Average (HMA), which computes two weighted moving averages (one at half the length and one at full length), subtracts them, and then applies a final weighted average based on the square root of the length. This method minimizes lag and increases responsiveness.
- Swing Mode: Uses the Exponential Moving Average (EMA), which assigns greater weight to recent prices, thus balancing quick reaction with smoothness.
- Position Mode: Applies the Weighted Moving Average (WMA) to focus on longer-term trends by emphasizing the entire lookback period and reducing the impact of short-term volatility.
2. Momentum Tracking
The indicator maintains separate counters for bullish and bearish momentum. These counters increase as the trend confirms directional movement and reset when the trend reverses. When a counter exceeds the defined signal strength threshold, a corresponding signal (buy or sell) is triggered.
3. Volatility and ATR Zones
The Average True Range (ATR) is calculated using a period that adapts to the selected trading mode (shorter for Scalp, longer for Position). The ATR value is then used to define upper and lower zones around the trend line, highlighting the current level of market volatility.
4. Return and Trend Acceleration
- Return is calculated as the difference between the current and previous closing prices, providing a simple measure of price change.
- Trend Acceleration is derived from the change in the trend line’s movement (its first derivative) compared to the previous bar. This metric indicates whether the trend is gaining or losing momentum.
5. Sortino Ratio and Standard Deviation
- The Sortino Ratio measures risk-adjusted performance by comparing returns to downside volatility (only considering negative price changes).
- Standard Deviation is computed over the lookback period to assess the extent of price fluctuations, offering insights into market stability.
Usage
This indicator is suitable for various time frames and market instruments. Traders can enable or disable specific visual elements such as gradient fills, bar coloring, and signal markers based on their preference. For a minimalist approach, one might choose to display only the primary trend line. For a deeper analysis, enabling multiple tables can provide extensive data on momentum, volatility, trend dynamics, and risk metrics.
Important Note on Risk
Trading involves inherent risk, and no indicator can eliminate the uncertainty of the markets. Past performance is not indicative of future results. It is essential to use proper risk management, test any new tool thoroughly, and consult multiple sources or professional advice before making trading decisions.
Conclusion
Uptrick: Alpha Trend unifies a diverse set of calculations, adaptive smoothing techniques, and customizable visual elements into one powerful tool. By combining the Hull, Exponential, and Weighted Moving Averages, the indicator is able to provide a trend line that is both responsive and smooth, depending on the trading mode. Its advanced color schemes, gradient fills, and detailed data tables deliver a comprehensive analysis of market trends, momentum, and risk. Whether you are a short-term trader or a long-term investor, this indicator aims to clarify price action and assist you in making more informed trading decisions.

DEMA Trend Oscillator Strategy📌 Overview
The DEMA Trend Oscillator Strategy is a dynamic trend-following approach based on the Normalized DEMA Oscillator SD.
It adapts in real-time to market volatility with the goal of improving entry accuracy and optimizing risk management.
⚠️ This strategy is provided for educational and research purposes only.
Past performance does not guarantee future results.
🎯 Strategy Objectives
The main goal of this strategy is to respond quickly to sudden price movements and trend reversals,
by combining momentum-based signals with volatility filters.
It is designed to be user-friendly for traders of all experience levels.
✨ Key Features
Normalized DEMA Oscillator: A momentum indicator that normalizes DEMA values on a 0–100 scale, allowing intuitive identification of trend strength
Two-Bar Confirmation Filter: Requires two consecutive bullish or bearish candles to reduce noise and enhance entry reliability
ATR x2 Trailing Stop: In addition to fixed stop-loss levels, a trailing stop based on 2× ATR is used to maximize profits during strong trends
📊 Trading Rules
Long Entry:
Normalized DEMA > 55 (strong upward momentum)
Candle low is above the upper SD band
Two consecutive bullish candles appear
Short Entry:
Normalized DEMA < 45 (downward momentum)
Candle high is below the lower SD band
Two consecutive bearish candles appear
Exit Conditions:
Take-profit at a risk-reward ratio of 1.5
Stop-loss triggered if price breaks below (long) or above (short) the SD band
Trailing stop activated based on 2× ATR to secure and extend profits
💰 Risk Management Parameters
Symbol & Timeframe: Any (AUDUSD 5M example)
Account size (virtual): $3000
Commission: 0.4PIPS(0.0004)
Slippage: 2 pips
Risk per trade: 5%
Number of trades (backtest):534
All parameters can be adjusted based on broker specifications and individual trading profiles.
⚙️ Trading Parameters & Considerations
Indicator: Normalized DEMA Oscillator SD
Parameter settings:
DEMA Period (len_dema): 40
Base Length: 20
Long Threshold: 55
Short Threshold: 45
Risk-Reward Ratio: 1.5
ATR Multiplier for Trailing Stop: 2.0
🖼 Visual Support
The chart displays the following visual elements:
Upper and lower SD bands (±2 standard deviations)
Entry signals shown as directional arrows
🔧 Strategy Improvements & Uniqueness
This strategy is inspired by “Normalized DEMA Oscillator SD” by QuantEdgeB,
but introduces enhancements such as a two-bar confirmation filter and an ATR-based trailing stop.
Compared to conventional trend-following strategies, it offers superior noise filtering and profit optimization.
✅ Summary
The DEMA Trend Oscillator Strategy is a responsive and practical trend-following method
that combines momentum detection with adaptive risk management.
Its visual clarity and logical structure make it a powerful and repeatable tool
for traders seeking consistent performance in trending markets.
⚠️ Always apply appropriate risk management. This strategy is based on historical data and does not guarantee future results.

Attrition Scalper - MTF# Attrition Scalper MTF Update
## What's Changed
Compared to previous Attrition Scalper versions, the channel and lines are now calculated using multi-timeframe (MTF) confluence with weighted averages.
The indicator is updated to PineScript V6.
I've removed redundant logic, inefficient buy/sell and high/low signals, and linear regression calculations to create a cleaner, more streamlined version that's both easier to use and provides a better foundation for future developments.
Using these lines every day has quickly made me realize that one line in one timeframe is usually in confluence with another line in another timeframe, and that price zone is usually much more reliable as a proper support/resistance or a mean reversion scalp zone.
The new logic checks one timeframe lower and one timeframe higher than the current timeframe the user is viewing and performs a weighted average calculation of 0.618 × lower TF + 1.0 × current TF + 0.786 × higher TF before plotting the lines.
Timeframes higher than weekly or lower than 5 minutes don't use MTF and instead just show the normal lines and the channel for that single timeframe similar to previous Attrition Scalper V2.
## Understanding the Lines
The Attrition Scalper generates several key reference lines that can help identify trade opportunities:
### Primary Reference Lines
- **Middle VIDYA and EVWMA (Middle Band)**: Usually represents the "mean" or equilibrium price. Price tends to gravitate back to this area during consolidation.
- **Green/Red VIDYA Lines**: These color-changing lines are your higher priority/reliable support/resistance levels.
### Fibonacci Extension Lines
- **Blue Lower Fibonacci Lines (0.618, 1.618, 2.618)**: Secondary support/resistance zones. While less significant than the VIDYA lines, these still provide valuable reference points for potential bounces.
- **Yellow 4.236 Fibonacci Lines**: These represent significant price overextension. When price reaches or exceeds these levels, expect a mean reversion move soon. These are the highest trust lines.
## Trading Applications
### Overextension & Mean Reversion
When price pushes above/below the yellow 4.236 Fibonacci line:
- This indicates an overextended market condition
- Probability of mean reversion increases significantly
- Consider counter-trend positions back toward the middle band
- Set targets near the middle VIDYA/EVWMA lines
- Higher timeframes = Higher reliability
- Don't panic and trust the process
### Support & Resistance Trading
- **Primary S/R Zones (Green/Red VIDYA)**: These are your highest probability bounce/rejection points. Pay special attention when price approaches these levels, especially on the first test.
- **Secondary S/R Zones (Blue Fib Lines)**: Use these as supplementary confirmation or for tighter stop placement or basic entries/TPs when laddering in and out.
## Best Practices
1. **Wait for Candle Close**: Trading signals are most reliable after a candle has fully closed above/below significant lines. Don't just take an instant long/short position when price goes above/below the outer yellow 4.236 fib line; wait for confirmation and candle close. Don't be sad if you miss an opportunity just because you waited—it's better this way in the long run.
2. **Respect Momentum**: Don't fight strong momentum just because price reached a line; wait for signs of reversal. Price almost always retraces, but it can be a small retracement only to inside the channel instead of going all the way back to the mean if the market is trending, OR it can stay overextended for an extended period of time (usually few candles max though). Sudden spikes all the way to the overextended zone are almost always a better position to take as a mean reversion play compared to long drawn out single direction trends. Don't fight the trend; take very small quick scalps given the opportunity.
3. **Use Confirmation Combined with Volume**: Look for rejection candles, engulfing patterns, or double tops/bottoms at key levels before entering. Strong volume at key lines increases the probability of a meaningful reaction. For example, at the end of an uptrend, if you see the price has spiked and is now overextended (out of the channel and above all the lines) and you see volume also spiking, that's almost always the top, at least for a while.
5. **Consider Volatility**: During high volatility, price may overshoot lines a lot (although very rare) before reversing; be patient and wait for confirmation. It could also be a news event, so always check before entering a position.

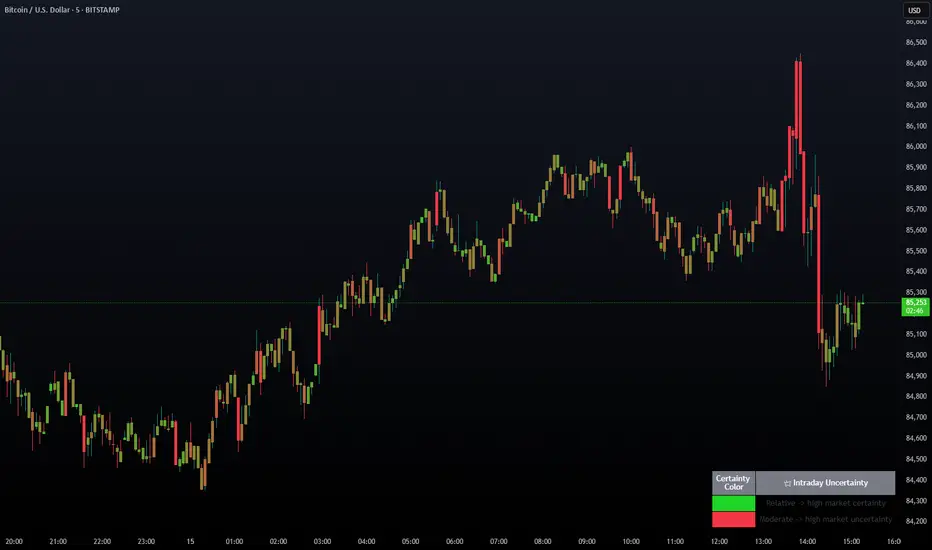
Intraday Uncertainty [PhenLabs]📊 Intraday Uncertainty
Version: PineScript™ v6
📌 Description
The Intraday Uncertainty indicator offers traders a visual representation of market certainty/uncertainty during trading sessions. By comparing each price bar’s range to the Average True Range (ATR), it provides an intuitive way to gauge market conviction through a color gradient system.
This tool helps traders identify periods of high certainty (potentially trending markets) versus high uncertainty (potentially choppy or volatile markets) without complex calculations or multiple indicators. The color-coded bars create an immediate visual cue to support decision-making in varying market conditions.
🚀 Points of Innovation
Automated range-to-ATR ratio calculation that adapts to changing market volatility
Dynamic color gradient system that visually distinguishes between certain and uncertain price action
Customizable gradient clamping to fine-tune sensitivity to market conditions
Integrated dashboard that provides clear interpretation guidance
Position-flexible legend that accommodates different chart layouts
Highly optimized for performance with minimal calculation overhead
🔧 Core Components
ATR Calculation: Measures market volatility using a configurable lookback period
Range-to-ATR Ratio: Compares current bar’s high-low range against average volatility
Gradient Mapping System: Converts numerical uncertainty values into an intuitive color scale
Dashboard Legend: Provides clear interpretation guidance with customizable positioning
🔥 Key Features
Bar Coloring: Instantly identifies market certainty levels through intuitive color gradients
Customizable ATR Period: Adjust sensitivity to historical volatility based on trading style
Gradient Clamping: Fine-tune the color sensitivity using the Range/ATR multiplier
Color Customization: Personalize the color scheme to match your chart aesthetics
Informative Dashboard: Quickly interpret color meanings with the optional on-chart legend
Flexible Display Options: Customize dashboard position and text size for your chart layout
🎨 Visualization
Color Gradient: Bars colored on a spectrum from green (high certainty) to red (high uncertainty)
Dashboard Legend: Optional on-chart guide explaining the color interpretation
Color Intensity: Stronger colors indicate more extreme certainty/uncertainty levels
At-a-glance Interpretation: Quickly identify market conviction without analyzing numbers
📖 Usage Guidelines
Calculation Settings
ATR Period
Default: 14
Range: 1+
Description: Controls the lookback period for ATR calculation. Lower values increase sensitivity to recent volatility, while higher values provide more stability.
Gradient Clamp (Range/ATR Multiplier)
Default: 2.0
Range: 0.1+
Description: Sets the maximum Range/ATR ratio for gradient scaling. Ranges above this value display the end color (high uncertainty).
Color Settings
Gradient Start Color (High Certainty)
Default: Green
Description: Color representing high market certainty (low Range/ATR ratio)
Gradient End Color (Low Certainty)
Default: Red
Description: Color representing low market certainty (high Range/ATR ratio)
Dashboard Settings
Show Dashboard Legend
Default: True
Description: Toggles the visibility of the on-chart interpretation guide
Dashboard Position
Options: top_right, top_left, bottom_right, bottom_left, middle_right, middle_left
Default: bottom_right
Description: Controls the placement of the dashboard on your chart
Dashboard Text Size
Options: tiny, small, normal, large, huge
Default: normal
Description: Adjusts the text size of the dashboard for readability
✅ Best Use Cases
Identifying potential trend shifts when certainty levels change dramatically
Confirming trend strength through consistent certainty levels
Detecting choppy/sideways markets with persistent high uncertainty
Filtering trading signals from other indicators based on certainty levels
Gauging market conviction behind price breakouts or pullbacks
Optimizing entry/exit timing based on certainty/uncertainty transitions
⚠️ Limitations
Does not predict future price direction, only measures current bar certainty
May provide false signals during news events or unexpected volatility spikes
Requires context within the broader market environment for optimal interpretation
Color interpretation is relative rather than absolute across different securities
ATR-based calculation means sensitivity varies across different timeframes
💡 What Makes This Unique
Simplicity: Single visual indicator that doesn’t require multiple technical tools
Adaptability: Automatically adjusts to changing market volatility conditions
Contextual Analysis: Provides market conviction context beyond just price movement
Intuitive Design: Color-based system that requires minimal learning curve
Efficiency: Lightweight calculation that doesn’t impact chart performance
🔬 How It Works
1. ATR Calculation:
Calculates the Average True Range using the specified period
Establishes a baseline for normal market volatility
2. Range Analysis:
Measures each bar’s high-low range
Compares this range to the current ATR value to create a ratio
3. Gradient Mapping:
Converts the Range/ATR ratio to a normalized value between 0 and 1
Maps this value onto a color gradient between the start and end colors
Applies the resulting color to the price bar
4. Dashboard Creation:
Constructs an information panel on the last visible bar
Populates it with color samples and interpretation guidance
💡 Note:
This indicator works best when used in conjunction with other technical analysis tools rather than in isolation. The certainty/uncertainty measure provides context for your trading decisions but should not be the sole basis for entries and exits. Consider using higher certainty periods for trend-following strategies and exercise caution during periods of high uncertainty.
Rogue ORB PRORogue ORB Pro is a precision-engineered Opening Range Breakout (ORB) indicator built for active intraday traders who need real signals, not noise.
This tool identifies high-probability breakout entries from the opening range, enhanced with optional ATR-based stop loss levels, deviation targets, cooldown filters, and a relative volume gate to filter weak setups.
🔍 Key Features:
Opening Range High/Low: Drawn from a user-defined time window and locked for the day
Deviations: Automatically plots target zones above and below the OR range (e.g. 1, 2 deviations)
Pre-Market Levels: Automatically draws pre market high and low lines at the end of pre market session
Buy/Sell Signals: Triggered on breakout of the OR High/Low with configurable breakout logic (touch or close)
ATR Stop Loss Line: Dynamically drawn at a fixed ATR distance from breakout candle, with optional SL label
Cooldown Period: Prevents back-to-back signals by enforcing a user-defined bar delay between entries, can help with overtrading
Volume Filter: Optional relative volume filter that requires breakout candles to exceed a custom volume threshold
VWAP Overlay: Visual VWAP for directional bias and confluence
ATR Label Value DisplayFor the last possible bars, this scripts adds a text label with padding to show the numerical value of ATR.
This can be used on strategies based on ATR.

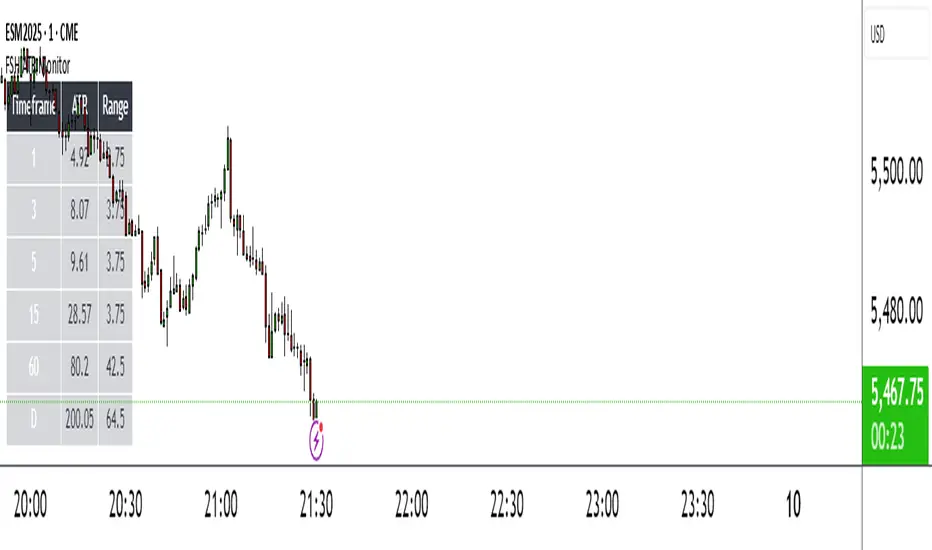
FSH ATR MTF MonitorThe FSH ATR MTF Monitor tracks the Average True Range (ATR) and current range across six customizable timeframes, displaying the results in a table. When a timeframe’s range exceeds its ATR, the range value turns yellow, signaling heightened volatility. This multi-timeframe tool helps traders assess market conditions and plan entries or exits.
Key Features:
- Monitors ATR and range for up to six timeframes simultaneously.
- Customizable ATR length and timeframe inputs.
- Highlights ranges exceeding ATR in yellow for quick identification.
- Table display with toggle option for flexibility.
How to Use:
1. Add the indicator to your chart.
2. Adjust the ATR length and timeframes in the inputs as needed.
3. Watch for yellow range values to spot volatility spikes across timeframes.
4. Toggle the table off if not needed.
Ideal for scalpers, swing traders, or anyone analyzing volatility across multiple timeframes.
ATR Stop BufferThe ATR Stop Buffer indicator calculates the Daily Average True Range (ATR) and converts it into ticks based on the symbol's minimum price movement. It then displays the full ATR, 2% of ATR, and 10% of ATR in a clean table format, rounded up for simplicity. This tool is ideal for traders who want to set volatility-based stop-loss levels or buffers for their trades.
Key Features:
- Uses a 14-period Daily ATR for robust volatility measurement.
- Converts ATR into ticks for precise application across different instruments.
- Table display with toggle option for flexibility.
- Perfect for risk management and trade planning.
How to Use:
1. Add the indicator to your chart.
2. Use the table values to adjust your stop-loss distances (e.g., 2% ATR for tight stops, 10% ATR for wider buffers).
3. Toggle the table off if you only need the values occasionally.
Note: Works best on instruments with defined tick sizes (e.g., futures, forex, stocks).

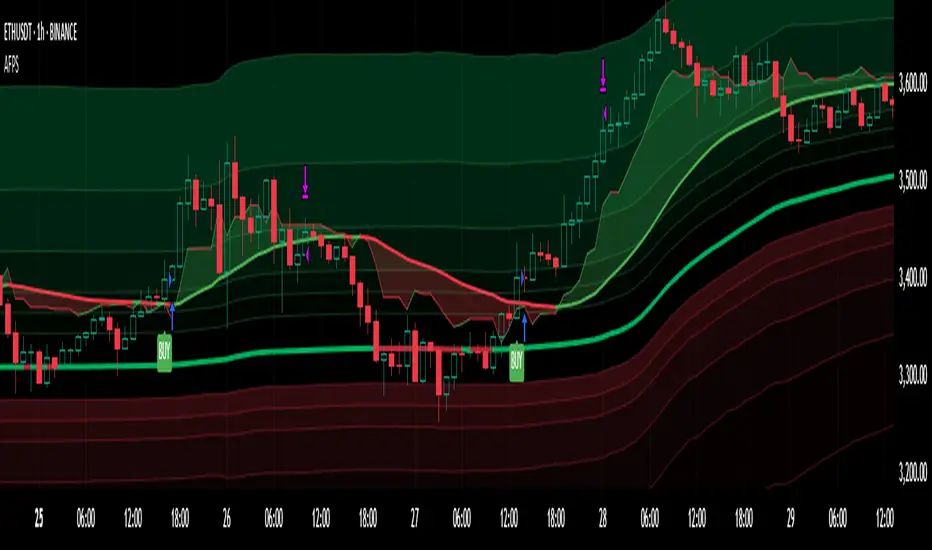
Adaptive Fibonacci Pullback System -FibonacciFluxAdaptive Fibonacci Pullback System (AFPS) - FibonacciFlux
This work is licensed under a Attribution-NonCommercial-ShareAlike 4.0 International (CC BY-NC-SA 4.0). Original concepts by FibonacciFlux.
Abstract
The Adaptive Fibonacci Pullback System (AFPS) presents a sophisticated, institutional-grade algorithmic strategy engineered for high-probability trend pullback entries. Developed by FibonacciFlux, AFPS uniquely integrates a proprietary Multi-Fibonacci Supertrend engine (0.618, 1.618, 2.618 ratios) for harmonic volatility assessment, an Adaptive Moving Average (AMA) Channel providing dynamic market context, and a synergistic Multi-Timeframe (MTF) filter suite (RSI, MACD, Volume). This strategy transcends simple indicator combinations through its strict, multi-stage confluence validation logic. Historical simulations suggest that specific MTF filter configurations can yield exceptional performance metrics, potentially achieving Profit Factors exceeding 2.6 , indicative of institutional-level potential, while maintaining controlled risk under realistic trading parameters (managed equity risk, commission, slippage).
4 hourly MTF filtering
1. Introduction: Elevating Pullback Trading with Adaptive Confluence
Traditional pullback strategies often struggle with noise, false signals, and adapting to changing market dynamics. AFPS addresses these challenges by introducing a novel framework grounded in Fibonacci principles and adaptive logic. Instead of relying on static levels or single confirmations, AFPS seeks high-probability pullback entries within established trends by validating signals through a rigorous confluence of:
Harmonic Volatility Context: Understanding the trend's stability and potential turning points using the unique Multi-Fibonacci Supertrend.
Adaptive Market Structure: Assessing the prevailing trend regime via the AMA Channel.
Multi-Dimensional Confirmation: Filtering signals with lower-timeframe Momentum (RSI), Trend Alignment (MACD), and Market Conviction (Volume) using the MTF suite.
The objective is to achieve superior signal quality and adaptability, moving beyond conventional pullback methodologies.
2. Core Methodology: Synergistic Integration
AFPS's effectiveness stems from the engineered synergy between its core components:
2.1. Multi-Fibonacci Supertrend Engine: Utilizes specific Fibonacci ratios (0.618, 1.618, 2.618) applied to ATR, creating a multi-layered volatility envelope potentially resonant with market harmonics. The averaged and EMA-smoothed result (`smoothed_supertrend`) provides a robust, dynamic trend baseline and context filter.
// Key Components: Multi-Fibonacci Supertrend & Smoothing
average_supertrend = (supertrend1 + supertrend2 + supertrend3) / 3
smoothed_supertrend = ta.ema(average_supertrend, st_smooth_length)
2.2. Adaptive Moving Average (AMA) Channel: Provides dynamic market context. The `ama_midline` serves as a key filter in the entry logic, confirming the broader trend bias relative to adaptive price action. Extended Fibonacci levels derived from the channel width offer potential dynamic S/R zones.
// Key Component: AMA Midline
ama_midline = (ama_high_band + ama_low_band) / 2
2.3. Multi-Timeframe (MTF) Filter Suite: An optional but powerful validation layer (RSI, MACD, Volume) assessed on a lower timeframe. Acts as a **validation cascade** – signals must pass all enabled filters simultaneously.
2.4. High-Confluence Entry Logic: The core innovation. A pullback entry requires a specific sequence and validation:
Price interaction with `average_supertrend` and recovery above/below `smoothed_supertrend`.
Price confirmation relative to the `ama_midline`.
Simultaneous validation by all enabled MTF filters.
// Simplified Long Entry Logic Example (incorporates key elements)
long_entry_condition = enable_long_positions and
(low < average_supertrend and close > smoothed_supertrend) and // Pullback & Recovery
(close > ama_midline and close > ama_midline) and // AMA Confirmation
(rsi_filter_long_ok and macd_filter_long_ok and volume_filter_ok) // MTF Validation
This strict, multi-stage confluence significantly elevates signal quality compared to simpler pullback approaches.
1hourly filtering
3. Realistic Implementation and Performance Potential
AFPS is designed for practical application, incorporating realistic defaults and highlighting performance potential with crucial context:
3.1. Realistic Default Strategy Settings:
The script includes responsible default parameters:
strategy('Adaptive Fibonacci Pullback System - FibonacciFlux', shorttitle = "AFPS", ...,
initial_capital = 10000, // Accessible capital
default_qty_type = strategy.percent_of_equity, // Equity-based risk
default_qty_value = 4, // Default 4% equity risk per initial trade
commission_type = strategy.commission.percent,
commission_value = 0.03, // Realistic commission
slippage = 2, // Realistic slippage
pyramiding = 2 // Limited pyramiding allowed
)
Note: The default 4% risk (`default_qty_value = 4`) requires careful user assessment and adjustment based on individual risk tolerance.
3.2. Historical Performance Insights & Institutional Potential:
Backtesting provides insights into historical behavior under specific conditions (always specify Asset/Timeframe/Dates when sharing results):
Default Performance Example: With defaults, historical tests might show characteristics like Overall PF ~1.38, Max DD ~1.16%, with potential Long/Short performance variance (e.g., Long PF 1.6+, Short PF < 1).
Optimized MTF Filter Performance: Crucially, historical simulations demonstrate that meticulous configuration of the MTF filters (particularly RSI and potentially others depending on market) can significantly enhance performance. Under specific, optimized MTF filter settings combined with appropriate risk management (e.g., 7.5% risk), historical tests have indicated the potential to achieve **Profit Factors exceeding 2.6**, alongside controlled drawdowns (e.g., ~1.32%). This level of performance, if consistently achievable (which requires ongoing adaptation), aligns with metrics often sought in institutional trading environments.
Disclaimer Reminder: These results are strictly historical simulations. Past performance does not guarantee future results. Achieving high performance requires careful parameter tuning, adaptation to changing markets, and robust risk management.
3.3. Emphasizing Risk Management:
Effective use of AFPS mandates active risk management. Utilize the built-in Stop Loss, Take Profit, and Trailing Stop features. The `pyramiding = 2` setting requires particularly diligent oversight. Do not rely solely on default settings.
4. Conclusion: Advancing Trend Pullback Strategies
The Adaptive Fibonacci Pullback System (AFPS) offers a sophisticated, theoretically grounded, and highly adaptable framework for identifying and executing high-probability trend pullback trades. Its unique blend of Fibonacci resonance, adaptive context, and multi-dimensional MTF filtering represents a significant advancement over conventional methods. While requiring thoughtful implementation and risk management, AFPS provides discerning traders with a powerful tool potentially capable of achieving institutional-level performance characteristics under optimized conditions.
Acknowledgments
Developed by FibonacciFlux. Inspired by principles of Fibonacci analysis, adaptive averaging, and multi-timeframe confirmation techniques explored within the trading community.
Disclaimer
Trading involves substantial risk. AFPS is an analytical tool, not a guarantee of profit. Past performance is not indicative of future results. Market conditions change. Users are solely responsible for their decisions and risk management. Thorough testing is essential. Deploy at your own considered risk.
VIDYA Auto-Trading(Reversal Logic)Overview
This script is a dynamic trend-following strategy based on the Variable Index Dynamic Average (VIDYA). It adapts in real time to market volatility, aiming to enhance entry precision and optimize risk management.
⚠️ This strategy is intended for educational and research purposes. Past performance does not guarantee future results. All results are based on historical simulations using fixed parameters.
Strategy Objectives
The objective of this strategy is to respond swiftly to sudden price movements and trend reversals, providing consistent and reliable trade signals under historical testing conditions. It is designed to be intuitive and efficient for traders of all levels.
Key Features
Momentum Sensitivity via VIDYA: Reacts quickly to momentum shifts, allowing for accurate trend-following entries.
Volatility-Based ATR Bands: Automatically adjusts stop levels and entry conditions based on current market volatility.
Intuitive Trend Visualization: Uptrends are marked with green zones, and downtrends with red zones, giving traders clear visual guidance.
Trading Rules
Long Entry: Triggered when price crosses above the upper band. Any existing short position is closed.
Short Entry: Triggered when price crosses below the lower band. Any existing long position is closed.
Exit Conditions: Positions are reversed based on signal changes, using a position reversal strategy.
Risk Management Parameters
Market: ETHUSD(5M)
Account Size: $3,000 (reasonable approximation for individual traders)
Commission: 0.02%
Slippage: 2 pip
Risk per Trade: 5% of account equity (adjusted to comply with TradingView guidelines for realistic risk levels)
Number of Trades: 251 (based on backtest over the selected dataset)
⚠️ The risk per trade and other values can be customized. Users are encouraged to adapt these to their individual needs and broker conditions.
Trading Parameters & Considerations
VIDYA Length: 10
VIDYA Momentum: 20
Distance factor for upper/lower bands: 2
Source: close
Visual Support
Trend zones, entry points, and directional shifts are clearly plotted on the chart. These visual cues enhance the analytical experience and support faster decision-making.
Visual elements are designed to improve interpretability and are not intended as financial advice or trade signals.
Strategy Improvements & Uniqueness
Inspired by the public work of BigBeluga, this script evolves the original concept with meaningful enhancements. By combining VIDYA and ATR bands, it offers greater adaptability and practical value compared to conventional trend-following strategies.
This adaptation is original work and not a direct copy. Improvements are designed to enhance usability, risk control, and market responsiveness.
Summary
This strategy offers a responsive and adaptive approach to trend trading, built on momentum detection and volatility-adjusted risk management. It balances clarity, precision, and practicality—making it a powerful tool for traders seeking reliable trend signals.
⚠️ All results are based on historical data and are subject to change under different market conditions. This script does not guarantee profit and should be used with caution and proper risk management.

Highest High Line with Multi-Timeframe Supertrend and RSIOverview:
This powerful indicator combines three essential elements for traders:
Highest High Line – Tracks the highest price over a customizable lookback period across different timeframes.
Multi-Timeframe Supertrend – Displays Supertrend values and trend directions for multiple timeframes simultaneously.
Relative Strength Index (RSI) – Shows RSI values across different timeframes for momentum analysis.
Features:
✅ Customizable Highest High Line:
Selectable timeframes: Daily, Weekly, Monthly, Quarterly, Yearly
Adjustable lookback period
✅ Multi-Timeframe Supertrend:
Supports 1min, 5min, 10min, 15min, 30min, 1H, Daily, Weekly, Monthly, Quarterly, Yearly
ATR-based calculation with configurable ATR period and multiplier
Identifies bullish (green) & bearish (red) trends
✅ Multi-Timeframe RSI:
Calculates RSI for the same timeframes as Supertrend
Overbought (≥70) and Oversold (≤30) signals with color coding
✅ Comprehensive Table Display:
A clean, structured table in the bottom-right corner
Displays Supertrend direction, value, and RSI for all timeframes
Helps traders quickly assess trend and momentum alignment
How to Use:
Use the Highest High Line to identify key resistance zones.
Confirm trend direction with Multi-Timeframe Supertrend.
Check RSI values to avoid overbought/oversold conditions before entering trades.
Align multiple timeframes for stronger confirmation of trend shifts.
Ideal For:
✅ Scalpers (lower timeframes: 1m–30m)
✅ Swing Traders (higher timeframes: 1H–D)
✅ Position Traders (Weekly, Monthly, Quarterly)
💡 Tip: Look for Supertrend & RSI confluence across multiple timeframes for higher probability setups.

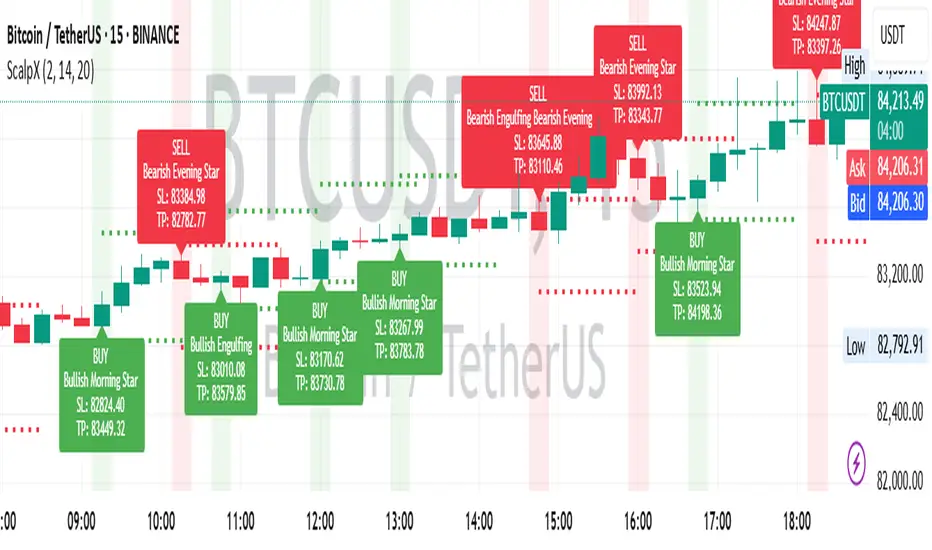
Scalping Entry/Exit Indicator by DiGetImagine having a tool that not only spots high-probability entry signals but also visually marks them on your chart with color-coded cues and automated alerts. The Scalping Entry/Exit Indicator by DiGet does exactly that—by fusing a range of classic candlestick patterns (such as Bullish Hammers, Engulfing patterns, and Morning/Evening Stars) with dynamic risk management levels, this script empowers you to make swift and informed trading decisions. Whether you're an active trader or an algorithm enthusiast, this indicator offers both precision and clarity in identifying scalp opportunities, making your chart analysis more efficient and visually engaging.
Indicator Breakdown
Input Parameters:
The indicator accepts a customizable risk-reward ratio, an ATR period for volatility measurement, and a lookback period to scan for valid candlestick patterns.
ATR & Candle Calculations:
It computes the Average True Range (ATR) to dynamically set stop-loss and take-profit levels. Additionally, it determines the body and wick sizes of each candlestick to help identify key reversal patterns.
Pattern Detection:
Multiple bullish patterns (Hammer, Engulfing, Morning Star) and bearish patterns (Shooting Star, Engulfing, Evening Star) are detected. There’s also a simplified version of the Head & Shoulders pattern, offering further validation for reversal signals.
Signal Generation & Trade Levels:
The script consolidates the pattern signals into combined “buy” and “sell” triggers. It then calculates the respective stop-loss (SL) and take-profit (TP) levels based on the current price and ATR, providing a robust risk management framework.
Visual Aids & Alerts:
To enhance usability, the indicator changes the chart’s background color to green for buy signals and red for sell signals. It also draws labels, lines (representing SL and TP), and markers directly on the chart, along with alert conditions to notify traders of actionable signals.
This indicator is an excellent addition to your TradingView toolkit—ideal for scalpers and short-term traders seeking clarity, precision, and automated signal generation on their charts.
Enjoy trading with confidence and precision!
Adaptive Fibonacci Volatility Bands (AFVB)
**Adaptive Fibonacci Volatility Bands (AFVB)**
### **Overview**
The **Adaptive Fibonacci Volatility Bands (AFVB)** indicator enhances standard **Fibonacci retracement levels** by dynamically adjusting them based on market **volatility**. By incorporating **ATR (Average True Range) adjustments**, this indicator refines key **support and resistance zones**, helping traders identify **more reliable entry and exit points**.
**Key Features:**
- **ATR-based adaptive Fibonacci levels** that adjust to changing market volatility.
- **Buy and Sell signals** based on price interactions with dynamic support/resistance.
- **Toggleable confirmation filter** for refining trade signals.
- **Customizable color schemes** and alerts.
---
## **How This Indicator Works**
The **AFVB** operates in three main steps:
### **1️⃣ Detecting Key Fibonacci Levels**
The script calculates **swing highs and swing lows** using a user-defined lookback period. From this, it derives **Fibonacci retracement levels**:
- **0% (High)**
- **23.6%**
- **38.2%**
- **50% (Mid-Level)**
- **61.8%**
- **78.6%**
- **100% (Low)**
### **2️⃣ Adjusting for Market Volatility**
Instead of using **fixed retracement levels**, this indicator incorporates an **ATR-based adjustment**:
- **Resistance levels** shift **upward** based on ATR.
- **Support levels** shift **downward** based on ATR.
- This makes levels more **responsive** to price action.
### **3️⃣ Generating Buy & Sell Signals**
AFVB provides **two types of signals** based on price interactions with key levels:
✔ **Buy Signal**:
Occurs when price **dips below** a support level (78.6% or 100%) and **then closes back above it**.
- **Optionally**, a confirmation buffer can be enabled to require price to close **above an additional threshold** (based on ATR).
✔ **Sell Signal**:
Triggered when price **breaks above a resistance level** (0% or 23.6%) and **then closes below it**.
📌 **Important:**
- The **buy threshold setting** allows traders to **fine-tune** entry conditions.
- Turning this setting **off** generates **more frequent** buy signals.
- Keeping it **on** reduces false signals but may result in **fewer trade opportunities**.
---
## **How to Use This Indicator in Trading**
### 🔹 **Entry Strategy (Buying)**
1️⃣ Look for **buy signals** at the **78.6% or 100% Fibonacci levels**.
2️⃣ Ensure price **closes above** the support level before entering a long trade.
3️⃣ **Enable or disable** the buy threshold filter depending on desired trade strictness.
### 🔹 **Exit Strategy (Selling)**
1️⃣ Watch for **sell signals** at the **0% or 23.6% Fibonacci levels**.
2️⃣ If price **breaks above resistance and then closes below**, consider exiting long positions.
3️⃣ Can be used **alone** or **combined with trend confirmation tools** (e.g., moving averages, RSI).
### 🔹 **Using the Toggleable Buy Threshold**
- **ON**: Buy signal requires **extra confirmation** (reduces false signals but fewer trades).
- **OFF**: Buy triggers as soon as price **closes back above support** (more signals, but may include weaker setups).
---
## **User Inputs**
### **🔧 Customization Options**
- **ATR Length**: Defines the period for **ATR calculation**.
- **Swing Lookback**: Determines how far back to find **swing highs and lows**.
- **ATR Multiplier**: Adjusts the size of **volatility-based modifications**.
- **Buy/Sell Threshold Factor**: Fine-tunes the **entry signal strictness**.
- **Show Level Labels**: Enables/disables **Fibonacci level annotations**.
- **Color Settings**: Customize **support/resistance colors**.
### **📢 Alerts**
AFVB includes built-in **alert conditions** for:
- **Buy Signals** ("AFVB BUY SIGNAL - Possible reversal at support")
- **Sell Signals** ("AFVB SELL SIGNAL - Possible reversal at resistance")
- **Any Signal Triggered** (Useful for automated alerts)
---
## **Who Is This Indicator For?**
✅ **Scalpers & Day Traders** – Helps identify **short-term reversals**.
✅ **Swing Traders** – Useful for **buying dips** and **selling rallies**.
✅ **Trend Traders** – Can be combined with **momentum indicators** for confirmation.
**Best Timeframes:**
⏳ **15-minute, 1-hour, 4-hour, Daily charts** (works across multiple assets).
---
## **Limitations & Considerations**
🚨 **Important Notes**:
- **No indicator guarantees profits**. Always **combine** it with **risk management strategies**.
- Works best **in trending & mean-reverting markets**—may generate false signals in **choppy conditions**.
- Performance may vary across **different assets & timeframes**.
📢 **Backtesting is recommended** before using it for live trading.

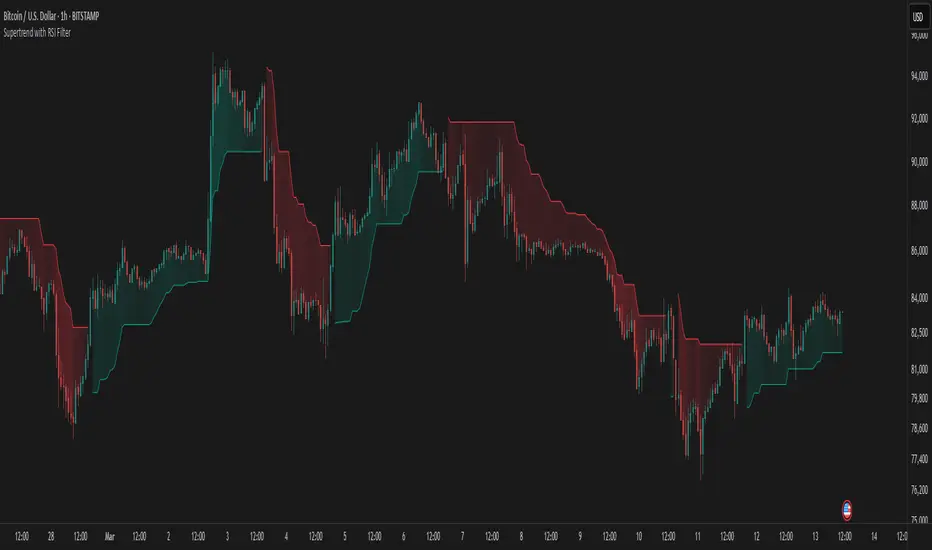
Supertrend with RSI FilterThis indicator is an enhanced version of the classic Supertrend, incorporating an RSI (Relative Strength Index) filter to refine trend signals. Here is a detailed explanation of its functionality and key advantages over the traditional Supertrend.
1. Indicator Functionality
The indicator uses ATR (Average True Range) to calculate the Supertrend line, just like the classic version. However, it introduces an additional condition based on RSI to strengthen or weaken the Supertrend color based on market momentum.
2. Interpretation of Colors
The indicator displays the Supertrend line with dynamic colors based on trend direction and RSI strength:
- Uptrend (Supertrend in buy mode):
- Dark green (Teal): RSI above the defined threshold (default 50) → Strong bullish confirmation.
- Light gray: RSI below the threshold → Indicates a weaker uptrend or lack of confirmation.
- Downtrend (Supertrend in sell mode):
- Dark red: RSI below the threshold → Strong bearish confirmation.
- Light gray: RSI above the threshold → Indicates a weaker downtrend or lack of confirmation.
The opacity of the color dynamically adjusts based on how far RSI is from its threshold. The greater the difference, the more vivid the color, signaling a stronger trend.
3. Key Advantages Over the Classic Supertrend
- Filters out false signals: The RSI integration helps reduce false signals by only validating trends when RSI aligns with the Supertrend direction.
- Weakens uncertain signals: When RSI is close to its threshold, the color becomes more transparent, alerting traders to a less reliable trend.
- Classic mode available: The 'Use Classic Supertrend' option allows switching to a standard Supertrend display (fixed red/green) without the RSI effect.
4. Customizable Parameters
- ATR Length & ATR Factor: Define the sensitivity of the Supertrend.
- RSI Period & RSI Threshold: Allow refining the RSI filter based on market volatility.
- Classic mode: Enables/disables the RSI filtering to revert to the original Supertrend.
This indicator is especially valuable for traders looking to refine their trend signals based on market momentum measured by RSI.
This indicator is for informational purposes only and should not be considered financial advice. Trading involves risks, and past performance does not guarantee future results. Always conduct your own analysis before making any trading decisions.
Engulfing Candles (ATR-Based)This indicator detects Engulfing Patterns with an ATR-based filtering mechanism and trend confirmation. Unlike a basic engulfing pattern indicator that only checks if a current candle engulfs the previous one, this script incorporates trend detection using either the 50-period SMA alone or a combination of 50 and 200-period SMAs to ensure that signals align with the broader trend. The indicator identifies Bullish Engulfing patterns when a strong bullish candle engulfs a smaller bearish candle in a downtrend and Bearish Engulfing patterns when a strong bearish candle engulfs a smaller bullish candle in an uptrend. It also generates alerts and visually marks these patterns with labels ("BU" for bullish and "BE" for bearish) while highlighting the background accordingly.
What sets this indicator apart from a normal engulfing indicator is its ATR-based filtering system, which ensures that only significant engulfing candles are considered. Instead of accepting any engulfing pattern, the script measures candle body size relative to 1.5x ATR (configurable) to filter out weak signals. It also differentiates between long-bodied and small-bodied candles to confirm that the engulfing pattern represents real momentum shifts. This approach reduces false signals caused by small, insignificant candles and ensures that traders focus on high-probability reversal patterns. By integrating trend-based filtering and ATR-based confirmation, this indicator provides more reliable and context-aware engulfing signals than a standard engulfing pattern detector.

MTF ATR BandsA simple but effective MTF ATR bands indicator.
The script calculate and display ATR bands low and high of the current timeframe using high, low inputs and an RMA moving average, adding to it ATR of the period multiplied with the user multiplier, default is set to 1.5.
Than is calculated a smoothed average of the range and the color of it based on its slope, same color is used to fill the atr bands.
Than the higher timeframe bands are calculated and displayed on the chart.
How can be used ?
The higher timeframe average and bands can give you long term direction of the trend and the current timeframes moving average and filling short term trend, for example using the 15 min chart with a 4h HTF bands, or an 1h with a daily, or a daily with an weekly or weekly with bi-monthly atr bands.
Also can be used as a stop loss indicator.
Hope you will like it, any question send me a PM.

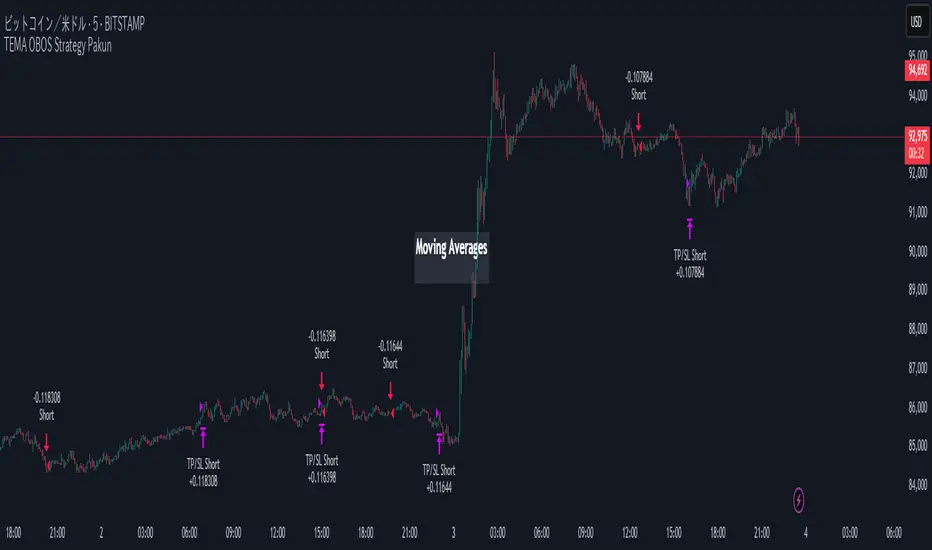
TEMA OBOS Strategy PakunTEMA OBOS Strategy
Overview
This strategy combines a trend-following approach using the Triple Exponential Moving Average (TEMA) with Overbought/Oversold (OBOS) indicator filtering.
By utilizing TEMA crossovers to determine trend direction and OBOS as a filter, it aims to improve entry precision.
This strategy can be applied to markets such as Forex, Stocks, and Crypto, and is particularly designed for mid-term timeframes (5-minute to 1-hour charts).
Strategy Objectives
Identify trend direction using TEMA
Use OBOS to filter out overbought/oversold conditions
Implement ATR-based dynamic risk management
Key Features
1. Trend Analysis Using TEMA
Uses crossover of short-term EMA (ema3) and long-term EMA (ema4) to determine entries.
ema4 acts as the primary trend filter.
2. Overbought/Oversold (OBOS) Filtering
Long Entry Condition: up > down (bullish trend confirmed)
Short Entry Condition: up < down (bearish trend confirmed)
Reduces unnecessary trades by filtering extreme market conditions.
3. ATR-Based Take Profit (TP) & Stop Loss (SL)
Adjustable ATR multiplier for TP/SL
Default settings:
TP = ATR × 5
SL = ATR × 2
Fully customizable risk parameters.
4. Customizable Parameters
TEMA Length (for trend calculation)
OBOS Length (for overbought/oversold detection)
Take Profit Multiplier
Stop Loss Multiplier
EMA Display (Enable/Disable TEMA lines)
Bar Color Change (Enable/Disable candle coloring)
Trading Rules
Long Entry (Buy Entry)
ema3 crosses above ema4 (Golden Cross)
OBOS indicator confirms up > down (bullish trend)
Execute a buy position
Short Entry (Sell Entry)
ema3 crosses below ema4 (Death Cross)
OBOS indicator confirms up < down (bearish trend)
Execute a sell position
Take Profit (TP)
Entry Price + (ATR × TP Multiplier) (Default: 5)
Stop Loss (SL)
Entry Price - (ATR × SL Multiplier) (Default: 2)
TP/SL settings are fully customizable to fine-tune risk management.
Risk Management Parameters
This strategy emphasizes proper position sizing and risk control to balance risk and return.
Trading Parameters & Considerations
Initial Account Balance: $7,000 (adjustable)
Base Currency: USD
Order Size: 10,000 USD
Pyramiding: 1
Trading Fees: $0.94 per trade
Long Position Margin: 50%
Short Position Margin: 50%
Total Trades (M5 Timeframe): 128
Deep Test Results (2024/11/01 - 2025/02/24)BTCUSD-5M
Total P&L:+1638.20USD
Max equity drawdown:694.78USD
Total trades:128
Profitable trades:44.53
Profit factor:1.45
These settings aim to protect capital while maintaining a balanced risk-reward approach.
Visual Support
TEMA Lines (Three EMAs)
Trend direction is indicated by color changes (Blue/Orange)
ema3 (short-term) and ema4 (long-term) crossover signals potential entries
OBOS Histogram
Green → Strong buying pressure
Red → Strong selling pressure
Blue → Possible trend reversal
Entry & Exit Markers
Blue Arrow → Long Entry Signal
Red Arrow → Short Entry Signal
Take Profit / Stop Loss levels displayed
Strategy Improvements & Uniqueness
This strategy is based on indicators developed by "l_lonthoff" and "jdmonto0", but has been significantly optimized for better entry accuracy, visual clarity, and risk management.
Enhanced Trend Identification with TEMA
Detects early trend reversals using ema3 & ema4 crossover
Reduces market noise for a smoother trend-following approach
Improved OBOS Filtering
Prevents excessive trading
Reduces unnecessary risk exposure
Dynamic Risk Management with ATR-Based TP/SL
Not a fixed value → TP/SL adjusts to market volatility
Fully customizable ATR multiplier settings
(Default: TP = ATR × 5, SL = ATR × 2)
Summary
The TEMA + OBOS Strategy is a simple yet powerful trading method that integrates trend analysis and oscillators.
TEMA for trend identification
OBOS for noise reduction & overbought/oversold filtering
ATR-based TP/SL settings for dynamic risk management
Before using this strategy, ensure thorough backtesting and demo trading to fine-tune parameters according to your trading style.
FVG | iSolani
Unveiling Market Inefficiencies with Precision
In fast-moving markets, spotting hidden opportunities often hinges on identifying imbalances between price and value. The FVG | iSolani indicator revolutionises this process by detecting Fair Value Gaps (FVGs) —zones where price action skips over "fair" valuation levels, creating potential retracement targets. Combining advanced filtering, dynamic visualisation, and automated management, this tool empowers traders to pinpoint high-probability setups with unprecedented clarity.
Core Methodology
The indicator employs a multi-layered approach to identify FVGs:
Three-Bar Gap Analysis: Bullish FVGs form when the current low exceeds the high of two bars prior, while bearish FVGs occur when the current high stays below the low of two bars back.
Volatility-Adjusted Filtering: Gaps are measured against a 100-bar standard deviation to exclude insignificant price jumps.
Volume Confirmation: Only gaps accompanied by above-average volume (relative to a 1-bar SMA) are validated, filtering out low-conviction moves.
Auto-Invalidation System: Continuously monitors price action to remove FVG zones once price closes within their range, maintaining chart cleanliness.
Breaking New Ground
This tool introduces three paradigm-shifting innovations:
Volume-Weighted Significance: Unlike traditional FVG detectors, it ties gap validity to volume spikes, emphasising institutional activity.
Adaptive Zone Management: Boxes automatically extend rightward (when enabled) and self-destruct when invalidated, eliminating manual cleanup.
Smart Color Encoding: Offers both monochrome (for multi-timeframe analysis) and standard bull/bear color schemes, with customisable transparency.
Engine Under the Hood
The script operates through four key processes:
Gap Detection: Scans every new bar for three-candle patterns meeting FVG criteria.
Statistical Filtering: Applies user-defined threshold (default: 1σ) to separate meaningful gaps from market noise.
Box Rendering: Draws semi-transparent zones between gap boundaries using TradingView's box objects, styled according to user preferences.
Array-Based Memory: Stores all active FVGs in arrays, enabling real-time validation checks against current price action.
Standard Configuration
Optimised default settings balance visibility and functionality:
Filter: 1.0 (1 standard deviation threshold)
Colors: "Mono" mode (gray boxes) with 90% transparency
Text Labels: Enabled in medium gray
Extension: Gaps extend indefinitely rightward
Borders: Dotted lines with visible outlines
Through its fusion of quantitative rigor and visual adaptability, the FVG | iSolani transforms raw price data into actionable intelligence. By focusing on volume-confirmed gaps and automating zone management, it cuts through market chaos to reveal structurally significant levels—a must-have for traders navigating breakouts, reversals, or order-flow analysis.
Trendchange Zones Indicator | iSolani
Spotting Reversals Before They Happen: The iSolani Trendshift System
Where RSI Meets Smart Volume Analysis - Your Visual Guide to Market Turns
Core Methodology
RSI-Powered Zones
Identifies critical levels using:
14-period RSI (default) with 70/30 thresholds
Semi-transparent boxes marking overbought (red) and oversold (green) territories
Zone persistence until RSI returns to neutral range
Dynamic Level Tracking
Plots evolving support/resistance using:
Pivot highs/lows with 15-bar lookback (default)
Auto-extending lines that adapt to new price extremes
Volume-Confirmed Breakouts
Flags significant moves with:
5/10 EMA volume oscillator
20% volume threshold (default) for confirmation
Technical Innovation
Three-Layer Confirmation
Unique combination of:
Classic RSI extremes
Price structure through pivot points
Volume-fueled momentum shifts
Adaptive Visualization
Zones maintain historical context at 33% transparency
Dynamic lines extend indefinitely until invalidated
Discreet labels for breakout events
System Workflow
Calculates RSI values in real-time
Draws colored zones when RSI crosses 70/30
Marks pivot points every 15 bars (default)
Updates support/resistance lines on new pivots
Triggers alerts when price breaks levels with volume confirmation
Standard Configuration
RSI Settings : 14-period length
Pivot Detection : 15-bar left/right lookback
Visuals : 33% transparency zones with thin borders
Volume Threshold : 20% oscillator difference
Alerts : Breakout signals with "B" labels
This system transforms the classic RSI into a spatial analysis tool - not just showing when markets are overextended, but where they're likely to reverse. The dynamic lines act as moving barriers that adapt to market structure, while the volume filter ensures only high-conviction breaks get flagged. By layering momentum, price action, and volume dynamics, it creates a multi-spectrum view of potential trend changes.

Daily True Range (DTR) vs Average True Range (ATR)Overview
The "DTR vs ATR with Color-Coded Percentage" indicator is a powerful volatility analysis tool designed for traders who want to understand daily price movements in the context of historical volatility. It calculates the Daily True Range (DTR)—the raw measure of a single day’s volatility—and compares it to the Average True Range (ATR), which smooths volatility over a user-defined period (default 14 days). The indicator presents this data in an intuitive table, featuring a color-coded percentage that visually represents how the current day’s move (DTR) stacks up against the average volatility (ATR). This helps traders quickly assess whether the current day’s price action is unusually volatile, average, or subdued relative to recent history.
Purpose
Volatility Comparison: Visualize how the current day’s price range (DTR) relates to the average range (ATR) over a specified period.
Decision Support: Identify days with exceptional movement (e.g., breakouts or reversals) versus normal or quiet days, aiding in trade entry/exit decisions.
Risk Management: Gauge daily volatility to adjust position sizing or stop-loss levels based on whether the market is exceeding or falling short of typical movement.
Features
Daily True Range (DTR) Calculation:
Computes the True Range for the current day as the greatest of:
Current day’s High - Low
High - Previous Close
Low - Previous Close
Aggregates data on any timeframe to ensure accurate daily values.
Average True Range (ATR):
Calculates the smoothed average of DTR over a customizable period (default 14 days) using Wilder’s smoothing method.
Updates in real-time as the day progresses.
Timeframe Flexibility: Works on any chart timeframe (e.g., 1-minute, 1-hour) while always calculating DTR and ATR based on daily data.
Color-Coded Display in either compact or table mode
The percentage value is color-coded in the table based on configurable thresholds:
Safe (default 75): Normal range, within typical volatility
Warning: (default 75-125): Above-average volatility.
Danger (default 125): Exceptionally high volatility

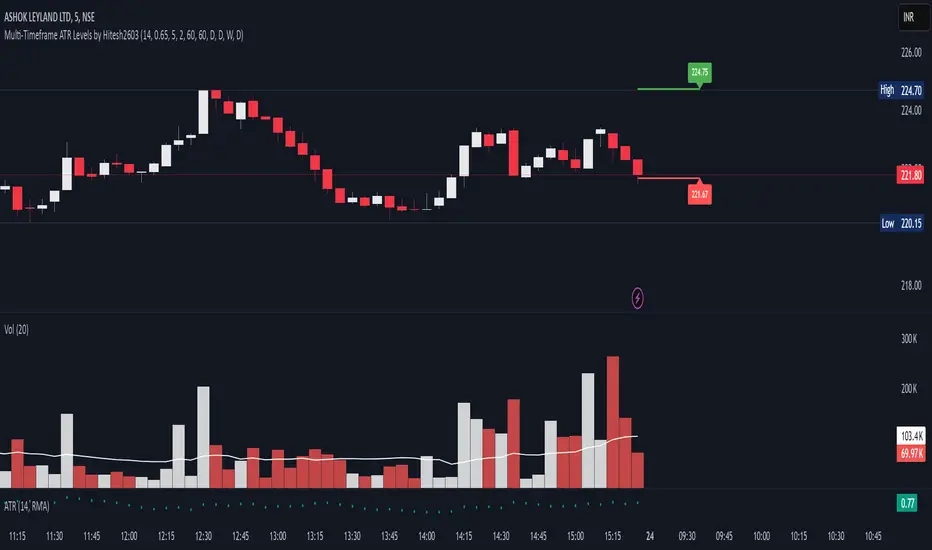
Multi-Timeframe ATR Levels by Hitesh2603Description:
"Multi-Timeframe ATR Levels by Hitesh2603" is a versatile and adaptive indicator designed to help traders identify key price levels based on the Average True Range (ATR) from a higher timeframe. The script automatically adapts to the current chart’s timeframe and allows you to customize the higher timeframe for ATR calculations, making it ideal for intraday and swing trading strategies.
The indicator plots upper and lower price levels based on the ATR multiplier, providing clear visual cues for potential profit-taking or exit points. It also includes features like editable timeframe presets , historical level plotting , labels , and alerts , making it a powerful tool for traders of all experience levels.
---
Key Features:
1. Automatic Timeframe Adaptation : - The script automatically detects the current chart’s timeframe and selects the appropriate higher timeframe for ATR calculations.
2. Editable Preset Timeframe Pairs : - Customize the higher timeframe for each chart timeframe directly in the indicator settings.
3. Dynamic ATR-Based Levels :- Plots upper and lower price levels using the formula:
- Upper Level = Current Candle Open + (Previous Candle ATR * Multiplier)
- Lower Level = Current Candle Open - (Previous Candle ATR * Multiplier)
4. Customizable Inputs :
- Adjust ATR length, multiplier, line length, colors, and more.
5. Labels :
- Displays the exact values of the upper and lower levels for easy reference.
6. Historical Levels :
- Optionally plots historical levels for all candles.
7. Alerts :
- Get notified when the price crosses the upper or lower levels.
---
Use Cases:
1. Intraday Trading :
- Use the script on a 5-minute or 15-minute chart with a 1-hour higher timeframe to identify intraday profit-taking or exit points.
2. Swing Trading :
- Use the script on a 1-hour or 4-hour chart with a daily higher timeframe to identify swing trading opportunities.
3. Position Trading :
- Use the script on a daily chart with a weekly higher timeframe to identify key levels for position trading.
4. Breakout Confirmation :
- Use the upper and lower levels as confirmation points for breakouts or reversals.
5. Risk Management :
- Use the levels to set stop-loss or take-profit targets based on market volatility.
---
How to Use:
1. Add the Script to Your Chart :
- Search for "Multi-Timeframe ATR Levels by Hitesh2603" in the TradingView indicator library and add it to your chart.
2. Customize the Settings :
- Adjust the inputs (e.g., ATR length, multiplier, line length, colors, etc.) to suit your trading strategy.
3. Set the Higher Timeframe :
- The script will automatically display an input for the higher timeframe based on the current chart’s timeframe. Customize it as needed.
4. Interpret the Levels :
- The script will plot two horizontal lines (upper and lower levels) on the chart. Use these levels for profit-taking, exits, or breakout confirmation.
5. Enable Alerts :
- Set up alerts to get notified when the price crosses the upper or lower levels.
---
Input Parameters:
1. ATR Length :
- The period used to calculate the ATR (default: 14).
2. ATR Multiplier :
- The multiplier applied to the ATR to calculate the levels (default: 0.65).
3. Line Length :
- The number of candles to extend the lines (default: 10).
4. Show Labels :
- Toggle to display the exact values of the levels (default: true).
5. Show Historical Levels :
- Toggle to plot historical levels for all candles (default: false).
6. Line Colors :
- Customize the colors of the upper and lower levels.
7. Line Width :
- Adjust the thickness of the lines (default: 2).
---
Example:
- Current Chart : 5-minute
- Higher Timeframe : 1-hour
- Previous Hour’s ATR : 4.6
- Current Hour’s Open : 102
- Multiplier : 0.65
Levels :
- Upper Level = 102 + (4.6 * 0.65) = 105.0
- Lower Level = 102 - (4.6 * 0.65) = 99.0
The script will plot horizontal lines at 105.0 and 99.0 on the 5-minute chart.
---
Alerts:
- Price Crosses Upper Level :
- Triggered when the price crosses above the upper level.
- Price Crosses Lower Level :
- Triggered when the price crosses below the lower level.
---
Notes:
- The script is designed to be flexible and adaptable to various trading styles and timeframes.
- Always backtest and validate the indicator with your trading strategy before using it in live trading.
---
Credits:
- Developed by Hitesh2603 .
- Special thanks to the TradingView community for inspiration and support.