Pattern Candlestick - V5This script is an advanced visual tool for technical analysis. It allows you to:
Highlight classic and custom patterns.
Get a clear visual overview through the use of colors and symbols.
*Let me know in the comments if you'd like to see more indicators like this one.
---------------------------------------- ----------------------------------------
1. Detection of specific “DOJI” candles
When a candle has a small body and long wicks.
Label: "⧱"
2. “ENGULFING” Pattern (2 candles)
Bullish: The second candle is bearish and engulfs the range of the first (which is bullish).
Bearish: The second candle is bullish and engulfs the range of the first (which is bearish).
Labels: "◧🢆" for bullish, "◨🢅" for bearish.
3. “OVERSHADOW” Pattern (Engulfing variant)
A 2-candle pattern where the second candle heavily overshadows the first.
Bullish: Second candle is bullish and engulfs a bullish first candle.
Bearish: Second candle is bearish and engulfs a bearish first candle.
Labels: "◫🢅" or "❚❚🢆"
4. “EFFICIENCY” Pattern (4 candles + FVG)
Uses 4 candles to define a structured directional pattern.
Complex conditions based on descending or ascending highs/lows that leave behind FVG.
Labels: "⟰🢆" and "⟱🢅"
5. “3 IN A ROW” Pattern (3 consecutive candles)
Detects 3 consecutive bullish or bearish candles.
Labels: "⥔🢆" or "⥕🢅"
6. “4 IN A ROW” Pattern (4 consecutive candles)
Same as above, but for 4 bullish or bearish candles.
Labels: "⥔⥔🢅" or "⥕⥕🢆"
7. “REJECTION” Pattern (3 candles)
A 3-candle pattern where the central candle shows strong rejection compared to the ones before and after it.
The middle candle gets strongly pushed back.
Labels: "⊻🢅" or "⊼🢆"
------------------------------- -------------------------------
This script is extremely useful for traders and technical analysts, offering:
Faster Pattern Recognition: Quickly spot well-known candlestick patterns without manual analysis.
Visual Clarity: Uses distinct symbols and colors to make chart reading more intuitive.
Customization: Detects not only standard patterns like Doji and Engulfing, but also more complex or personalized setups (e.g. Efficiency, Overshadow).
Trade Timing: Helps identify potential entry or exit points based on historically significant formations.
Adaptability: Can be used across various markets (stocks, crypto, forex) and timeframes.
Candlerangetheory

Candlestick pattern + FVG + sessionThis script includes three main features:
1) Candlestick Pattern Identification: It highlights bullish and bearish candlestick sequences.
2) Fair Value Gap (FVG) Detection: It detects Fair Value Gaps (FVG) and highlights them on the chart.
3) Session Ranges: The script allows the user to define and visualize trading session ranges (Session 1 and Session 2), as well as their high and low points.
*Let me know in the comments if you'd like to see more indicators like this one.
-------------------------------------KEY FEATURES-------------------------------------
CANDLESTICK PATTERN IDENTIFICATION:
(The script checks for a specific candlestick pattern)
Bullish Pattern: The script identifies two consecutive candles where both are BLACK (downward trend).
Bearish Pattern: The script identifies two consecutive green candles (upward trend).
If the pattern is identified, it colors the bars of the candles accordingly:
Green for bullish (upward).
black for bearish (downward).
FAIR VALUE GAP (FVG) DETECTION:
The script identifies Bullish and Bearish Fair Value Gaps (FVG):
A Bullish FVG occurs when the low of the current bar is higher than the high of the bar two periods ago.
A Bearish FVG occurs when the high of the current bar is lower than the low of the bar two periods ago.
When a gap is detected, a colored box is drawn on the chart to represent the gap area. The user can customize the color and opacity of the boxes.
SESSION RANGES:
The user can define the time range for Session 1 and Session 2.
"Session 1 is by default configured to align with the regular trading hours, starting at 9:30 AM (market open) and ending at 4:00 PM (market close).
Session 2 is by default configured to begin at 9:30 AM (market open) and conclude 30 minutes thereafter."
The script can plot the high and low points of each session and display them on the chart as lines. These points can be customized to be visible or hidden, and the session ranges can also be highlighted with a box.
Additionally, the script allows users to control whether the max/min points for each session should be displayed.
This script can be used by traders who want to identify candlestick patterns, detect FVGs, and monitor session ranges on their charts. It is particularly useful for traders who focus on price action and market structure, as it allows for visual analysis of inefficient areas during the trading sessions of the day
( This script has been tested only on the H4 timeframe.)

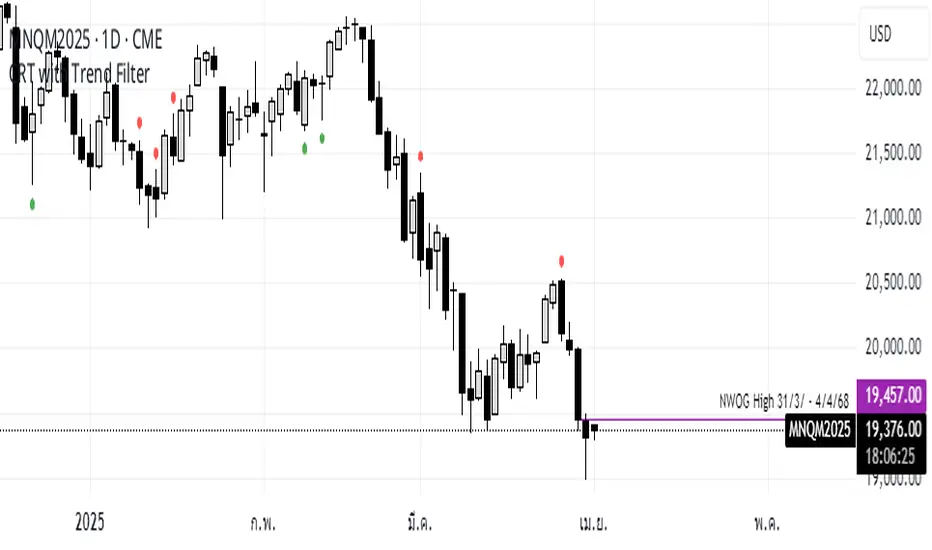
CRT with Trend FilterExplanation of Functionality
The CRT RED DOG with Trend Filter indicator is a tool used to identify buy and sell signals on a price chart. It filters signals based on the market trend to ensure higher accuracy.
Main Components of the Indicator
Moving Average (EMA) Settings
Users can set the moving average (EMA) length as desired, with a default value of 50 days.
This moving average is used to determine the market trend.
Determining Market Trend
Uptrend: Occurs when the closing price is above the moving average.
Downtrend: Occurs when the closing price is below the moving average.
Identifying Buy and Sell Signals
Buy Signal: Occurs when the current bar's low is lower than the previous bar's low, and the closing price is higher than the previous bar's close, during an uptrend.
Sell Signal: Occurs when the current bar's high is higher than the previous bar's high, and the closing price is lower than the previous bar's close, during a downtrend.
Displaying Signals on the Chart
Buy signals are displayed with a green arrow below the candlestick.
Sell signals are displayed with a red arrow above the candlestick.
Time frame Day >> 15M
Daily CRTDaily CRT Indicator
The Daily CRT Indicator is a custom technical analysis tool designed to help traders identify and visualize key price patterns on the daily timeframe. Specifically, it detects and marks the "Sweep and Close Inside" pattern, which is a price action pattern that can signal potential trading opportunities.
Key Features:
Pattern Detection:
The indicator detects two specific price action patterns:
Sweep and Close Above: When the current price sweeps above the previous day’s high and closes inside the range, indicating a potential bullish breakout or continuation.
Sweep and Close Below: When the current price sweeps below the previous day’s low and closes inside the range, signaling a potential bearish move.
Horizontal Lines:
The indicator automatically draws horizontal lines at the previous day’s high and low levels whenever a pattern is detected, providing a visual reference for key support and resistance zones.
These lines are displayed in real-time on the chart and adjust dynamically as new patterns form.
Customizable Line Appearance:
Choose the color, thickness, and style (solid, dashed, or dotted) of the lines to fit your preferred chart aesthetic.
Alert System:
The indicator comes with built-in alerts. Set an alert to notify you when the Sweep and Close Inside pattern is detected, helping you stay on top of potential trade setups.
History Management:
Show History: Optionally display the detected patterns on previous bars (past patterns).
Customizable History Duration: Control how far back you want to view the patterns, allowing you to adjust for a cleaner chart and focus on the most recent setups.
Visual Labels:
When the pattern is detected, the indicator can display a label under the bar (customizable) to highlight the occurrence of the pattern, making it easier for traders to spot potential trade signals.
Built for the Daily Timeframe:
This indicator is specifically designed to work on the daily timeframe and is ideal for swing traders and longer-term traders who are focused on the daily price action and want to capture patterns that indicate potential market reversals or breakouts.
How It Works:
The indicator monitors the previous day's price action and looks for situations where the current price action either sweeps the previous day's high or low and then closes inside the range of the previous day's bar. This type of price movement can often signal that a reversal or continuation is about to occur. The indicator marks these setups by drawing horizontal lines and optionally displays labels for quick identification.
Settings & Customization:
Line Color: Customize the color of the lines marking the previous day’s high and low.
Line Thickness: Choose from different thickness levels for better visibility.
Line Style: Pick from solid, dashed, or dotted styles.
Show History: Toggle the display of historical patterns, with the option to control how many days back to show.
Show Labels: Option to toggle the display of labels when the pattern is detected.
Alert Condition: Receive alerts when a pattern is detected, ensuring you never miss a trade opportunity.
Ideal For:
Swing Traders: This indicator is perfect for traders looking to capture swings in the market based on daily price action.
Pattern Traders: Those who trade based on specific chart patterns will benefit from this tool, as it identifies important reversal and breakout signals.
Technical Analysts: Anyone who incorporates price action patterns into their strategy can use this tool as a supplemental analysis tool to improve their trading decisions.
By using the Daily CRT Indicator, you’ll have a powerful tool to help you spot important price action patterns that may indicate key market moves. Whether you're looking to catch breakouts, reversals, or simply track significant support and resistance levels, this indicator is a versatile addition to your trading toolkit.
This description provides a clear understanding of how the Daily CRT Indicator works and what value it offers, making it easy for traders to know if it fits their trading style. Feel free to tweak the description further depending on the details you’d like to emphasize.

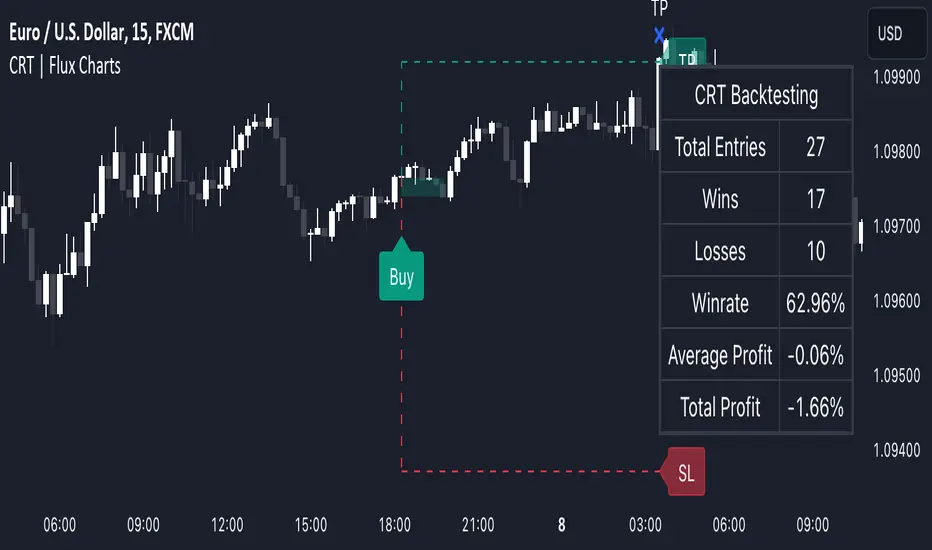
Candle Range Theory | Flux Charts💎 GENERAL OVERVIEW
Introducing our new Candle Range Theory Indicator! This powerful tool offers a strategy built around the Candle Range Theory, which analyzes market movements through the relative size and structure of price candles. For more information about the process, check the "HOW DOES IT WORK" section.
Features of the new Candle Range Theory Indicator :
Implementation of the Candle Range Theory
FVG & Order Block Entry Methods
2 Different TP / SL Methods
Customizable Execution Settings
Customizable Backtesting Dashboard
Alerts for Buy, Sell, TP & SL Signals
📌 HOW DOES IT WORK ?
The Candle Range Theory (CRT) indicator operates by identifying significant price movements through the relative size and structure of candlesticks. A key part of the strategy is determining large candles based on their range compared to the Average True Range (ATR) in a higher timeframe. Once identified, a breakout of either the high wick or the low wick of the large candle is required. This breakout is considered a liquidity grab. After that, the indicator waits for confirmation through Fair Value Gaps (FVGs) or Order Blocks (OBs). The confirmation structure must be the opposite direction of the breakout, for example if the high wick is broken, a bearish FVG is required for the short entry. After a confirmation signal is received, the indicator will trigger entry points based on your chosen entry method (FVG or OB), and exit points will be calculated using either a dynamic ATR-based TP/SL method or fixed percentages. Alerts for Buy, Sell, Take-Proft, and Stop-Loss are available.
🚩 UNIQUENESS
This indicator stands out because it combines two highly effective entry methods: Fair Value Gaps (FVGs) and Order Blocks (OBs). You can choose between these strategies depending on market conditions. Additionally, the dynamic TP/SL system uses the ticker's volatility to automatically calculate stop-loss and take-profit targets. The backtesting dashboard provides metrics about the performance of the indicator. You can use it to tune the settings for best use in the current tiker. The Candle Range Theory approach offers more flexibility compared to traditional indicators, allowing for better customization and control based on your risk tolerance.
⚙️ SETTINGS
1. General Configuration
Higher Timeframe: Customize the higher timeframe for analysis. Recommended combinations include M15 -> H4, H4 -> Daily, Daily -> Weekly, and Weekly -> Monthly.
HTF Candle Size: Define the size of the higher timeframe candles as Big, Normal, or Small to filter valid setups based on their range relative to ATR.
Entry Mode: Choose between FVGs and Order Blocks for your entry triggers.
Require Retracement: Enable this option if you want a retracement to the FVG or OB for entry confirmation.
Show HTF Candle Lines: Toggle to display the higher timeframe candle lines for better visual clarity.
2. Fair Value Gaps
FVG Sensitivity: You may select between Low, Normal, High or Extreme FVG detection sensitivity. This will essentially determine the size of the spotted FVGs, with lower sensitivities resulting in spotting bigger FVGs, and higher sensitivities resulting in spotting all sizes of FVGs.
3. Order Blocks
Swing Length: Swing length is used when finding order block formations. Smaller values will result in finding smaller order blocks.
4. TP / SL
TP / SL Method:
a) Dynamic: The TP / SL zones will be auto-determined by the algorithm based on the Average True Range (ATR) of the current ticker.
b) Fixed : You can adjust the exact TP / SL ratios from the settings below.
Dynamic Risk: The risk you're willing to take if "Dynamic" TP / SL Method is selected. Higher risk usually means a better winrate at the cost of losing more if the strategy fails. This setting is has a crucial effect on the performance of the indicator, as different tickers may have different volatility so the indicator may have increased performance when this setting is correctly adjusted.