Futures Buy/Sell IndicatorDeveloped by Ai this chart provides buy sell times. Sell you longs on the sell or buy shorts on sell marks.
Candlestick analysis

3 Candles Gap3 Candle Gap Indicator is made to detect these types of patterns:
1. 3 consecutive bullish or bearish candles
2. the middle candle true body (body excluding shadows) has a part that is not covered by previous and next candle shadows (gap)
This pattern helps traders to detect candles where price has moved in a direction and gap has formed (price is not covered by previous or next candles shadows), this is a signal showing price momentum where one side (bulls/bears) is so powerful at moving the price that the other side (bears/bulls) can't get price back to cover the gap.
This indicator has "repainting" by 1 candle which means, it uses the data from future to work, however this future data does not go further than 1 candle.

竖线标注工具V1Digital Time Theory that tells you what an algorithm might do at what time
The market price algorithm sets a clear time for when the price is going to consolidate, when it is going to manipulate, and when it is going to go to the next liquidity target
Since timeis timeisfractal, algorithms do the same thing in different time periods
Digital Time Theory个告诉你算法可能在什么时间做什么事情的理论
市场价格算法中对于价格什么时候要进行盘整积累,什么时候进行操纵,什么时候出发去下一个流动性目标设定了明确的时间
由于时间是分形的(timeisfractal)算法会在不同时间周期做相同的事情

IMACD + OBVOSC Signal IndicatorCombine Impulse macd from Lazy bear with the volume indicator obvosc to increase the volume verification and make the indicator prompt more effective

Multi Candle Body MapperMulti Candle Body Mapper
Visualize higher-timeframe candle structure within lower timeframes — without switching charts.
This tool maps grouped candle bodies and wicks (e.g., 15min candles on a 5min chart) using precise boxes and lines. Ideal for intraday traders who want to analyze market intent, body bias, and wick rejection in a compressed, organized view.
Features:
Visualize 3, 6, or 12 candle groups (e.g., 15min / 30min / 1H views)
Body box shows bullish/bearish color with adjustable transparency
Wick box shows high-low range with adjustable thickness and color
Dashed line at group close level for market direction hint
Full color customization
Toggle individual elements ON/OFF
Clean overlay – doesn’t interfere with price candles
Great for spotting:
Hidden support/resistance
Momentum buildup
Reversal traps and continuation setups
Keep your chart simple but smarter — all without changing your timeframe.

IFG MASTER SIGNALSignal for people to test various trend pattern analysis techniques and research. This is for research purposes only. Not financial advice.

Liquidity Zones Alerts"Liquidity Zones Alerts" is a powerful smart-money-based indicator designed to detect key liquidity grabs and provide high-probability reversal signals using a combination of market structure, volume, volatility, and candlestick confirmation.
🧠 How It Works
The core logic of this indicator is built around the Smart Money Concepts:
🔺 Liquidity Sweeps: Detects when price takes out previous daily or weekly highs/lows, suggesting stop hunts or engineered liquidity moves by institutional players.
📈 Volume Filter: Ensures signals only appear during above-average volume, filtering out noise and low-interest moves.
⚡ Volatility Filter: Flags high-range candles relative to the average, catching flash crashes/spikes that often precede strong reversals.
🔄 Engulfing Candle Confirmation: Confirms entry with a bullish or bearish engulfing pattern after liquidity is taken — increasing signal reliability.
🧭 Premium/Discount Zone Logic: Trades are filtered to ensure longs are only taken in discount zones, and shorts in premium zones, using a 20-period market range for context.
📌 Features
✅ Daily & Weekly liquidity zones toggle
✅ Visual signals with clean 🔻(short) & 🔺(long) arrows
✅ Auto-detection of flash crashes
✅ Alerts on both long and short setups
✅ Optional previous high/low level plotting for context
✅ Background highlighting of valid signal candles
✅ Multi-timeframe friendly and compatible with any asset
🛠️ Use Case
Whether you're a scalper or a swing trader, this tool helps you spot institutional entry zones before the move happens. It works especially well when combined with your existing bias or supply/demand zones.
💬 “Price doesn't move randomly — it hunts liquidity. This indicator shows you where and when it happens.”

Candle Percentage NACHOMIXCRYPTOThe "Percentage x Candle NACHOMIXCRYPTO" indicator, written in Pine Script (version 6), is designed to visualize and quantify the percentage price movements (rise and drop) of a financial instrument over a specified number of candles. It overlays lines, labels, and a summary table on the chart to provide traders with clear insights into price changes. Below is a detailed description of its functionality:
Key Features
Purpose:
The indicator calculates the percentage rise from a past candle's low to the current close and the percentage drop from a past candle's high to the current close.
It displays these percentages visually with lines connecting the reference points to the current price, labels showing the exact percentages, and a table summarizing the results.
Inputs and Customization:
You can choose from which candle you want to measure the percentage of the price rise and drop, allowing you to obtain a calculation from the candle you wish to analyze.
Line Configuration:
Up Line: Color (default: green) and width (default: 2) for the line showing price rise.
Down Line: Color (default: red) and width (default: 2) for the line showing price drop.
Label Configuration:
Up Label: Customizable color (default: green), text color (default: white), style (up, down, left, right), size (tiny, small, normal, large), and text alignment (center, left, right).
Down Label: Similar customization options with default color red.
Label Offset: Adjustable horizontal offset (default: 5 bars) to position labels relative to the current bar.
Calculation Settings:
Bars Back for Rise: Number of candles back to reference the low price for calculating the percentage rise (default: 5).
Bars Back for Drop: Number of candles back to reference the high price for calculating the percentage drop (default: 5).
Calculations:
Percentage Rise: Computed as ((close - low ) / low ) * 100, representing the percentage increase from the low of the specified past candle to the current close.
Percentage Drop: Computed as ((high - close) / high ) * 100, representing the percentage decrease from the high of the specified past candle to the current close.
Average Change: The average of the rise and drop percentages, calculated as (priceRise + priceDrop) / 2.
Visual Elements:
Lines:
An Up Line connects the low of the specified past candle (barsBackUp) to the current close, colored according to the user-defined color and width.
A Down Line connects the high of the specified past candle (barsBackDown) to the current close, similarly customizable.
Previous lines are deleted each bar to avoid clutter, ensuring only the most recent lines are shown.
Labels:
An Up Label displays the percentage rise (e.g., "5.23%") near the current price, with customizable style, size, and alignment.
A Down Label displays the percentage drop in the same manner.
Labels are also cleared each bar to show only the latest values.
Table:
A table is displayed in the bottom-right corner of the chart with four rows:
Rise: Shows the percentage rise (e.g., "5.237%") in green.
Drop: Shows the percentage drop (e.g., "3.124%") in red.
Average: Shows the average of rise and drop (e.g., "4.18%") in white.
Total+-: Shows the sum of rise and drop percentages (e.g., "8.361%") in a cyan-like color (#08bfc9).
The table has a black frame, a frame width of 5, and a border width of 3 for visibility.
Behavior:
The indicator updates dynamically with each new bar, recalculating percentages based on the specified lookback periods (barsBackUp and barsBackDown).
It ensures a clean chart by removing previous lines and labels before drawing new ones, preventing overlap or clutter.
The table persists and updates its values to provide a quick reference for traders without needing to inspect individual labels.
Use Case
This indicator is useful for traders who want to:
Track Price Movements: Quickly assess how much the price has risen or fallen relative to specific past candles.
Visualize Trends: The lines help visualize the trajectory of price changes over the chosen lookback periods.
Summarize Data: The table provides a concise summary of rise, drop, average, and total percentage changes, aiding in decision-making.
Customize Display: Tailor the appearance of lines, labels, and the table to suit their charting preferences.
Example Scenario
Suppose a trader sets barsBackUp = 5 and barsBackDown = 5:
Limitations
The indicator assumes the lookback periods (barsBackUp and barsBackDown) are valid and does not handle cases where insufficient historical data is available (though Pine Script typically manages this).
The total percentage (rise + drop) may not always be meaningful in all contexts, as it sums two independent metrics.
Performance may be affected on charts with many bars if the lookback periods are large, due to repeated line and label creation/deletion.
Conclusion
The "Percentage x Candle NACHOMIXCRYPTO" indicator is a versatile tool for visualizing and quantifying price movements over user-defined periods. Its combination of lines, labels, and a summary table makes it intuitive for traders to analyze percentage changes at a glance, with extensive customization options to fit various trading styles.

Avg 30-min High-Low Pips (Bar Chart)Checks the Avg of User Input Days Pip Movement.
This will help in identifying times of the days where the movement can be most and times of the day when the movement on average is the least.

Niveles de 100 Pips XAUUSD - Rango Controlado300 pips above the current price
700 pips below the current price
🔎 Why?
Because normally in gold (XAUUSD), you want to see more levels below (past supports) and not as much space above where there are no levels.

Rendon1 Swing Market Turns**Swing Market Turns Indicator**
This indicator identifies potential swing highs and swing lows by integrating Relative Strength Index (RSI), volume confirmation, and higher timeframe (HTF) levels to accurately detect market reversals and turning points. Specifically optimized for swing traders, this tool aims to pinpoint moments when price momentum is shifting, providing clear signals for trade entries and exits.
### How It Works:
- **RSI Divergence:** Detects momentum shifts through RSI overbought and oversold conditions.
- **Higher Timeframe Levels:** Confirms reversals using support and resistance levels from higher timeframes.
- **Volume Confirmation:** Ensures stronger validity of signals by checking if current volume exceeds the moving average of recent volume.
### Key Features:
- Visual labels on chart clearly indicating potential swing highs and lows.
- Customizable RSI period, RSI overbought/oversold thresholds, volume moving average length, and higher timeframe selections.
- Built-in alert conditions for immediate notifications when swing opportunities are detected.
### Recommended Use:
- Ideal for traders focusing on swing trading strategies, particularly those looking for high-probability turning points.
- Effective across multiple assets including forex, stocks, commodities, and crypto.
- Suitable for various intraday and higher timeframes, with customization options available.
### Settings:
- **RSI Period:** Adjust the sensitivity of RSI calculation.
- **Higher Timeframe:** Select the timeframe used for support/resistance reference.
- **RSI Overbought/Oversold:** Customize thresholds defining extreme RSI values.
- **Volume MA Length:** Specify the length for volume moving average calculation.
Feel free to customize the parameters to best fit your trading style and asset of choice.
**Disclaimer:**
This indicator does not guarantee profitable trades and should be used in conjunction with proper risk management and additional analysis methods.

Blended Candle Indicator (Newest Only)This is a Pine Script (version 6) for a "Blended Candle Indicator" that visualizes a candlestick formed by blending two previous candles

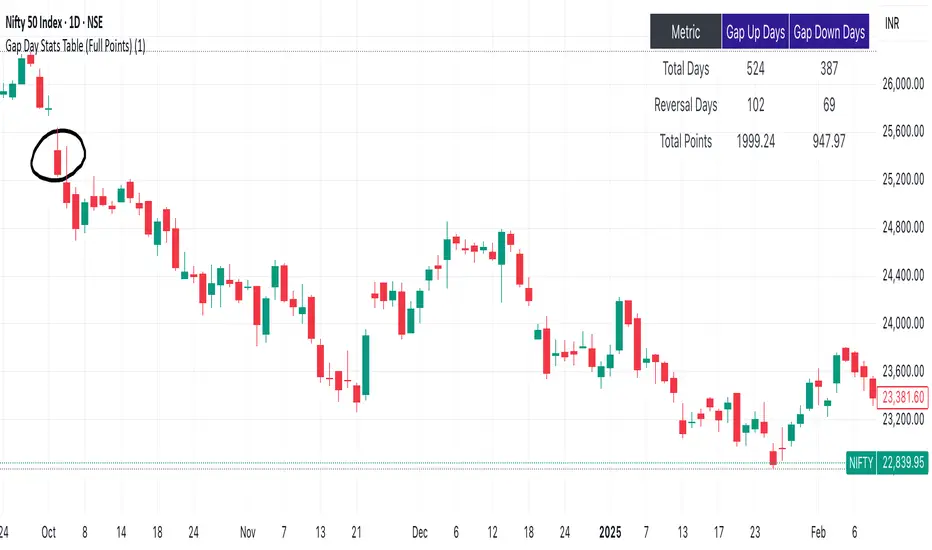
Gap Day Stats TableDescription:
This Pine Script helps you analyze gap up and gap down days using a user-defined gap percentage threshold. It generates a real-time statistics table that tracks:
📈 Number of Gap Up Days
🔻 How many of those days closed lower (Open > Close)
🧮 Total points lost on such gap up days (Open - Close)
📉 Number of Gap Down Days
🔺 How many of those days closed higher (Close > Open)
🧮 Total points gained on such gap down days (Close - Open)
🔧 Customization:
Gap threshold is adjustable via input
Automatically updates stats daily
Ideal for spotting behavioral edge in gaps
This tool is useful for traders building gap trading systems, mean reversion models, or studying post-gap behavior in equities and indices.
Liquidity Breakout Reversal Signals - 15min with 4H TrendThis is just a strategy im testing out lets see how i do

Next Candle Predictor# Next Candle Predictor - MovingBox - User Guide
## Introduction
Welcome to the Next Candle Predictor indicator for TradingView! This tool is designed to predict the likely direction of the next candle based on recent price action, helping you make more informed trading decisions.
## Installation
1. In TradingView, click on "Pine Editor" at the bottom of your screen
2. Delete any existing code in the editor
3. Copy and paste the entire Next Candle Predictor script
4. Click "Save" and give your script a name
5. Click "Add to Chart" to apply the indicator
## Features
- Predicts if the next candle will be Bullish, Bearish, or Neutral
- Shows prediction confidence as a percentage
- Displays prediction strength value
- Visual color-coding (green for bullish, red for bearish, grey for neutral)
- Customizable parameters
## Understanding the Display
The indicator shows a box with the following information:
- **PREDICTION**: Shows "Bullish", "Bearish", or "Neutral"
- **Confidence**: Percentage showing how confident the prediction is
- **Strength**: Numerical value indicating the strength of the signal
The box automatically positions itself to avoid blocking the chart.
## Available Settings
You can customize the indicator through its settings. Click on the gear icon next to the indicator name after adding it to your chart.
### Analysis Parameters
- **Lookback Candle Count** (Default: 5)
- Range: 2-20
- How many previous candles to analyze for the prediction
- Higher values may provide more stable but slower-to-react predictions
- **Wick Weight Factor** (Default: 0.1)
- Range: 0.0-1.0
- How much importance to give to candle wicks
- Higher values give more weight to wicks in the prediction
- **Body Weight Factor** (Default: 0.5)
- Range: 0.0-1.0
- How much importance to give to candle bodies
- Higher values give more weight to the body size in the prediction
- **Volume Weight Factor** (Default: 0.5)
- Range: 0.0-1.0
- How much importance to give to volume
- Higher values make volume more influential in the prediction
- **Prediction Sensitivity** (Default: 0.05)
- Range: 0.01-1.0
- Threshold for triggering a bullish or bearish prediction
- Lower values make the indicator more sensitive (more signals)
- Higher values make the indicator more selective (fewer signals)
### Visual Settings
- **Prediction Line Length** (Default: 10)
- Range: 5-50
- Length of the prediction line extending from the current price
## Best Practices
1. **Start with default settings** and adjust based on your trading style
2. **Use alongside other indicators** - never rely on a single indicator for trading decisions
3. **Test different lookback periods** - shorter for quick trades, longer for swing trades
4. **Pay attention to confidence levels** - higher confidence might indicate stronger signals
5. **Consider timeframe** - the indicator may perform differently on various timeframes
## Troubleshooting
- If the prediction box is blocking important chart areas, you can adjust position parameters in the script
- If predictions seem incorrect, try increasing the lookback period for more stability
- If the indicator doesn't appear, make sure you've added it correctly to your chart
## Disclaimer
This indicator is for informational purposes only. Past performance does not guarantee future results. Always use proper risk management when trading.
Happy Trading!

DTFX Time based range candle box [Wang Indicators]DTFX Time based range candle box
Overview : This indicator highlights HTF Candles in specified timeframe within boxes and extend them until they are mitigated. Allowing traders to use them as zones from which you could find some turn-around or scalp
How does it works ?
Users can setup up to 8 desired timeframe with the hour/minute of the HTF candle
Be carrefull when you chose the time. You must put something coherent with the timeframe (e.g : you can't put 'minutes' = 45 if your timeframe is '1h')
Everyday, the indicator will draw a box around the specified candle for it timeframe
Once the price close above or bellow this candle in the same timeframe, the Zone become "active"
As long as the price doesn't came back into the zone, the retracements will extends
Once the price came back into the zone (in the current timeframe), it stops the expension
Exemple
Here we have those settings :
timeframe : 1 hour
time : 9am
mitigation : 10%
fibs : visible & dashed
The box highlights the 9am 1H candle (9am to 10am)
We now wait for the price to close in the same timeframe (1h here) above or bellow the price
At 11am we close above - the zone is now "active"'
Now we wait for the price to go back in this zone in the current timeframe (here 5min)
12:40am : we put a low above the 10% of the zone -> we stop the retracements, the zone is considered as "mitigated"
Settings
Hour : The hour of the begiging of the candle
Minute : Combined with hour (default 0)
Timeframe : In whichtimeframe we are looking for the candle
% Mitigation : % of the box in wich the price must go back-in in order to "mitigate" the box and stop the expension of the fibs/box (if settings enabled)
Retracements style : Hidden, dashed, dotted or lines for the fibs
Extend Box : extend the box itself until it get mitigated
Number of unmitigated zones : Max unmitigated zone drawed on the chart PER CONFIG
Timezone : Must be set to reflect your needs. (preferably the chart timezone)
How does it helps users ?
Once a Candle is "active" it can be used as a Zone
Fibonnacis levels (30, 50 and 70%) are displayed (if enabled)
Users can customize their apparence and the boxes as they see fit
The 30 - 50 - 70 levels are possible support/resistance that the price tend to bounce of off
You might find some success looking for an entry inside the zone at a level if price gives further confirmations such as a lower time frame flip.
Quarterly Cycle Theory with DST time AdjustedThe Quarterly Theory removes ambiguity, as it gives specific time-based reference points to look for when entering trades. Before being able to apply this theory to trading, one must first understand that time is fractal:
Yearly Quarters = 4 quarters of three months each.
Monthly Quarters = 4 quarters of one week each.
Weekly Quarters = 4 quarters of one day each (Monday - Thursday). Friday has its own specific function.
Daily Quarters = 4 quarters of 6 hours each = 4 trading sessions of a trading day.
Sessions Quarters = 4 quarters of 90 minutes each.
90 Minute Quarters = 4 quarters of 22.5 minutes each.
Yearly Cycle: Analogously to financial quarters, the year is divided in four sections of three months each:
Q1 - January, February, March.
Q2 - April, May, June (True Open, April Open).
Q3 - July, August, September.
Q4 - October, November, December.
S&P 500 E-mini Futures (daily candles) — Monthly Cycle.
Monthly Cycle: Considering that we have four weeks in a month, we start the cycle on the first month’s Monday (regardless of the calendar Day):
Q1 - Week 1: first Monday of the month.
Q2 - Week 2: second Monday of the month (True Open, Daily Candle Open Price).
Q3 - Week 3: third Monday of the month.
Q4 - Week 4: fourth Monday of the month.
S&P 500 E-mini Futures (4 hour candles) — Weekly Cycle.
Weekly Cycle: Daye determined that although the trading week is composed by 5 trading days, we should ignore Friday, and the small portion of Sunday’s price action:
Q1 - Monday.
Q2 - Tuesday (True Open, Daily Candle Open Price).
Q3 - Wednesday.
Q4 - Thursday.
S&P 500 E-mini Futures (1 hour candles) — Daily Cycle.
Daily Cycle: The Day can be broken down into 6 hour quarters. These times roughly define the sessions of the trading day, reinforcing the theory’s validity:
Q1 - 18:00 - 00:00 Asia.
Q2 - 00:00 - 06:00 London (True Open).
Q3 - 06:00 - 12:00 NY AM.
Q4 - 12:00 - 18:00 NY PM.
S&P 500 E-mini Futures (15 minute candles) — 6 Hour Cycle.
6 Hour Quarters or 90 Minute Cycle / Sessions divided into four sections of 90 minutes each (EST/EDT):
Asian Session
Q1 - 18:00 - 19:30
Q2 - 19:30 - 21:00 (True Open)
Q3 - 21:00 - 22:30
Q4 - 22:30 - 00:00
London Session
Q1 - 00:00 - 01:30
Q2 - 01:30 - 03:00 (True Open)
Q3 - 03:00 - 04:30
Q4 - 04:30 - 06:00
NY AM Session
Q1 - 06:00 - 07:30
Q2 - 07:30 - 09:00 (True Open)
Q3 - 09:00 - 10:30
Q4 - 10:30 - 12:00
NY PM Session
Q1 - 12:00 - 13:30
Q2 - 13:30 - 15:00 (True Open)
Q3 - 15:00 - 16:30
Q4 - 16:30 - 18:00
S&P 500 E-mini Futures (5 minute candles) — 90 Minute Cycle.
Micro Cycles: Dividing the 90 Minute Cycle yields 22.5 Minute Quarters, also known as Micro Sessions or Micro Quarters:
Asian Session
Q1/1 18:00:00 - 18:22:30
Q2 18:22:30 - 18:45:00
Q3 18:45:00 - 19:07:30
Q4 19:07:30 - 19:30:00
Q2/1 19:30:00 - 19:52:30 (True Session Open)
Q2/2 19:52:30 - 20:15:00
Q2/3 20:15:00 - 20:37:30
Q2/4 20:37:30 - 21:00:00
Q3/1 21:00:00 - 21:23:30
etc. 21:23:30 - 21:45:00
London Session
00:00:00 - 00:22:30 (True Daily Open)
00:22:30 - 00:45:00
00:45:00 - 01:07:30
01:07:30 - 01:30:00
01:30:00 - 01:52:30 (True Session Open)
01:52:30 - 02:15:00
02:15:00 - 02:37:30
02:37:30 - 03:00:00
03:00:00 - 03:22:30
03:22:30 - 03:45:00
03:45:00 - 04:07:30
04:07:30 - 04:30:00
04:30:00 - 04:52:30
04:52:30 - 05:15:00
05:15:00 - 05:37:30
05:37:30 - 06:00:00
New York AM Session
06:00:00 - 06:22:30
06:22:30 - 06:45:00
06:45:00 - 07:07:30
07:07:30 - 07:30:00
07:30:00 - 07:52:30 (True Session Open)
07:52:30 - 08:15:00
08:15:00 - 08:37:30
08:37:30 - 09:00:00
09:00:00 - 09:22:30
09:22:30 - 09:45:00
09:45:00 - 10:07:30
10:07:30 - 10:30:00
10:30:00 - 10:52:30
10:52:30 - 11:15:00
11:15:00 - 11:37:30
11:37:30 - 12:00:00
New York PM Session
12:00:00 - 12:22:30
12:22:30 - 12:45:00
12:45:00 - 13:07:30
13:07:30 - 13:30:00
13:30:00 - 13:52:30 (True Session Open)
13:52:30 - 14:15:00
14:15:00 - 14:37:30
14:37:30 - 15:00:00
15:00:00 - 15:22:30
15:22:30 - 15:45:00
15:45:00 - 15:37:30
15:37:30 - 16:00:00
16:00:00 - 16:22:30
16:22:30 - 16:45:00
16:45:00 - 17:07:30
17:07:30 - 18:00:00
S&P 500 E-mini Futures (30 second candles) — 22.5 Minute Cycle.

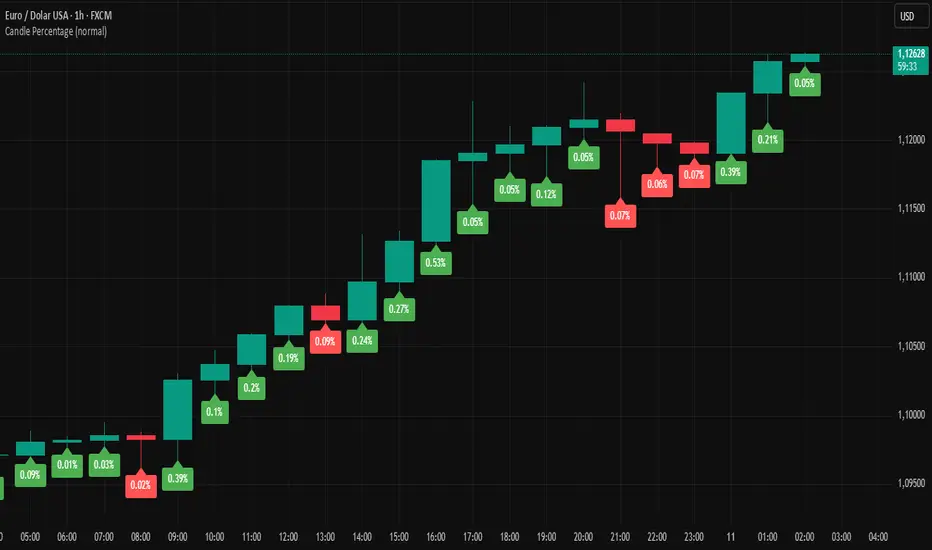
Candle PercentageThis script calculates the percentage movement of the candle body from open to close and displays it as a label on the chart. The label color changes based on the candle's direction:
Green for bullish (price closes higher than it opened),
Red for bearish (price closes lower than it opened).
The script also allows you to select the label size, with the following options:
Tiny (very small text)
Small (small text)
Normal (default text size)
Large (large text)
Huge (giant text)
By default, the label size is set to Normal.
The percentage is calculated using the formula:
(Body Size / Open Price) * 100
This is helpful for traders who want to quickly assess the magnitude of price movement within each candle and analyze market sentiment based on the size of the body.
TBB-barcountTrades By Bren-barcount: The Ultimate Bar Counter for Both RTH and ETH Traders
After countless hours of development and testing, I'm proud to present the Trades By Bren-barcount - the first truly reliable bar counter that seamlessly works in both Regular Trading Hours (RTH) and Extended Trading Hours (ETH) environments!
The Problem This Solves:
Ever been confused when switching between RTH and ETH? Regular bar counters create total chaos - either counting from 1 at midnight (useless for day traders) or failing to adjust when you switch chart types. This leads to completely different bar numbers for the same price action, making it impossible to keep consistent notes or communicate precise entries/exits with trading partners.
Why This Was Shockingly Difficult to Create:
What seemed like a simple feature turned into a programming odyssey! The challenge was creating a universal counter that works across different timezones, exchanges, and chart types. Pinescript doesn't natively support this functionality, requiring creative session detection techniques and complex logic to ensure the counter always starts at 1 precisely when regular market hours begin - regardless of how many pre-market bars are displayed.
Features That Make This Special:
Simple toggle for RTH-only counting - no complex configuration needed
Visually perfect numbering that starts exactly where the blue/white chart boundary exists
Works in any timezone (perfect for traveling traders!)
Customizable label size, color, and frequency
Maintains perfect count synchronization when sharing charts with trading partners
Why You Need This:
If you've ever been frustrated trying to reference "bar 37" only to realize your trading partner is seeing it as "bar 85" because of different chart settings, this indicator will change your trading communication forever. It creates a universal numbering system that everyone in your trading room can rely on.
Save yourself hours of confusion and missed opportunities. This tiny addition to your chart will become an indispensable part of your daily trading routine!
Created By:
This indicator was developed by Trades By Bren. For more amazing trading tools, strategies and insights, check out the Trades By Bren YouTube channel: youtube.com

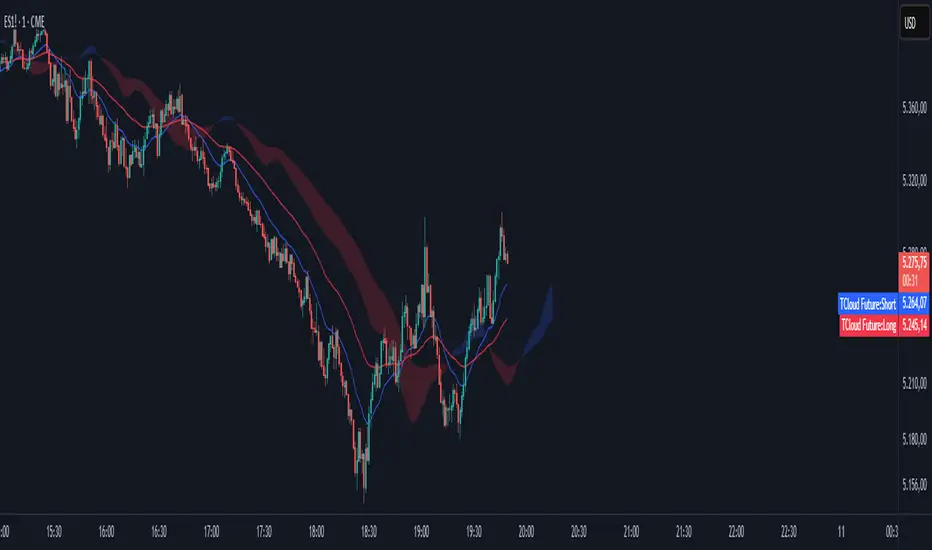
TCloud Tilson FutureT-Wave Future – Indicator Description & How to Use
T-Wave Future is a forward-looking trend analysis tool that projects a dynamic cloud based on two customized Tilson Moving Averages:
A Short Tilson MA (default: 4-period, factor 0.38)
A Long Tilson MA (default: 15-period, factor 0.55)
Inspired by the Ichimoku Cloud, this indicator projects the cloud forward in time to provide a smoother, adaptive view of potential market trends and shifts.
🔍 What Makes T-Wave Future Unique?
✅ Uses Tilson Moving Averages, known for their smoothness and responsiveness.
✅ Projects the cloud into the future for advanced trend visualization.
✅ Customizable periods and factors for both lines.
✅ Color-coded cloud to instantly spot trend direction:
Bullish (blue) when Short Tilson > Long Tilson
Bearish (red) when Short Tilson < Long Tilson
🎯 How to Use T-Wave Future
✅ Trend Direction
The cloud color shows the dominant momentum:
Blue cloud: Bullish bias
Red cloud: Bearish bias
The forward projection gives you a visual cue of where the market is likely heading.
🔁 Trend Reversals
A change in cloud color (from red to blue or vice versa) can indicate a possible trend reversal.
Use this as a signal to prepare entries, adjust stop-losses, or scale in/out.
🟩 Entry Strategy
Long entries when price is above the blue cloud and the cloud is rising.
Short entries when price is below the red cloud and the cloud is falling.
🛡️ Dynamic Support/Resistance
The cloud acts as a future support or resistance zone.
Ideal for anticipating price pullbacks or rejections.
⚡ Pro Tips:
Combine with volume, RSI or MACD for confirmation.
Adjust projection length based on your timeframe (e.g. 26 for intraday, 52+ for swing).
Works best in trending markets – avoid relying on it in sideways conditions.

TCloud Future📘 Tcloud Future – Indicator Description & How to Use
Tcloud Future is a trend-based indicator that creates a forward-projected cloud between:
A customizable Exponential Moving Average (EMA)
A dynamic McGinley Moving Average
The cloud is shifted into the future (like the Ichimoku Cloud), giving traders a visual projection of potential trend direction.
🔧 Components:
EMA (default: 19-period) – fast-reacting average to short-term price action
McGinley Dynamic (default: 26-period) – smoother, adaptive average that reacts to volatility
Forward Projection (default: 26 candles) – pushes the cloud into the future to help anticipate trend continuation or reversal
Cloud Color
Green when EMA is above McGinley (bullish bias)
Red when EMA is below McGinley (bearish bias)
🟢 How to Trade with Tcloud Future
✅ Trend Confirmation
Use the cloud color and slope to confirm the current trend.
Green cloud sloping up → bullish momentum
Red cloud sloping down → bearish momentum
🟩 Entry Strategy (Trend-Following)
Go long when price is above the green cloud and the cloud is rising.
Go short when price is below the red cloud and the cloud is falling.
🔁 Cloud Crossovers (Trend Shift)
A color change in the projected cloud can signal a potential trend reversal.
Use this as a heads-up to prepare for position changes or tighten stops.
🛡️ Support/Resistance Zones
The cloud often acts as a dynamic support/resistance zone.
During an uptrend, pullbacks to the top or middle of the green cloud can be good entries.
During a downtrend, rallies into the red cloud can offer shorting opportunities.
🧠 Tips
Combine with RSI, MACD, or Volume for confirmation.
Avoid using it alone in sideways markets — it performs best in trending conditions.
Adjust projection and smoothing settings to fit the asset/timeframe you're trading.
Williams Vix Fix Shortsleave both the current WVF on your chart that you should have currently. Just turn them both on at the same time, and just turn off the white candles on the shorts WVF. Then add this pinescript in the editor and add it to your chart.

Liquidity Sweeps [SB]Liquidity Sweeps – Identify Smart Money Liquidity Grabs
🔹 Overview
The Liquidity Sweeps indicator is designed to help traders spot bullish and bearish liquidity grabs, a key concept in smart money trading. It automatically detects swing highs and lows, identifies stop hunts, and highlights areas where institutional traders might be sweeping liquidity before price reverses.
🔹 How It Works
Detects liquidity sweeps by tracking swing points based on a user-defined lookback period.
Differentiates between:
✅ Wick-based liquidity grabs (stop hunts).
✅ Breakouts & retests (confirming liquidity sweeps).
✅ Both combined for deeper analysis.
Draws liquidity zones with extendable boxes to visualize areas where liquidity was taken.
Provides alerts when a liquidity sweep occurs.
🔹 Key Features
✅ Customizable swing length (len) for liquidity detection.
✅ Choose from three liquidity sweep types:
Only Wicks (stop hunts).
Only Breakouts & Retests (confirmed sweeps).
Wicks + Breakouts & Retests (comprehensive view).
✅ Bullish & bearish liquidity zones displayed with adjustable colors.
✅ Extends liquidity zones dynamically for better market structure analysis.
✅ Alerts included for real-time notifications.
🔹 Who Can Benefit?
Smart money & ICT traders looking for liquidity grabs.
The Strat traders seeking 1-3-1 setups or inside bar breaks.
VWAP traders using liquidity sweeps for confluence.
Scalpers & intraday traders focusing on 5-minute execution after a sweep.
🔹 How to Use
1️⃣ Select your preferred liquidity sweep type in the settings.
2️⃣ Look for liquidity grabs at key price levels (e.g., swing highs/lows).
3️⃣ Use the liquidity sweep as a confirmation tool before entering trades.
4️⃣ Combine with VWAP, The Strat, or order blocks for higher probability setups.
🚀 Enhance your trading edge with smart money liquidity sweeps!
🔔 Follow for more trading tools & updates.

