Order Flow Hawkes Process [ScorsoneEnterprises]This indicator is an implementation of the Hawkes Process. This tool is designed to show the excitability of the different sides of volume, it is an estimation of bid and ask size per bar. The code for the volume delta is from www.tradingview.com
Here’s a link to a more sophisticated research article about Hawkes Process than this post arxiv.org
This tool is designed to show how excitable the different sides are. Excitability refers to how likely that side is to get more activity. Alan Hawkes made Hawkes Process for seismology. A big earthquake happens, lots of little ones follow until it returns to normal. Same for financial markets, big orders come in, causing a lot of little orders to come. Alpha, Beta, and Lambda parameters are estimated by minimizing a negative log likelihood function.
How it works
There are a few components to this script, so we’ll go into the equation and then the other functions used in this script.
hawkes_process(params, events, lkb) =>
alpha = clamp(array.get(params, 0), 0.01, 1.0)
beta = clamp(array.get(params, 1), 0.1, 10.0)
lambda_0 = clamp(array.get(params, 2), 0.01, 0.3)
intensity = array.new_float(lkb, 0.0)
events_array = array.new_float(lkb, 0.0)
for i = 0 to lkb - 1
array.set(events_array, i, array.get(events, i))
for i = 0 to lkb - 1
sum_decay = 0.0
current_event = array.get(events_array, i)
for j = 0 to i - 1
time_diff = i - j
past_event = array.get(events_array, j)
decay = math.exp(-beta * time_diff)
past_event_val = na(past_event) ? 0 : past_event
sum_decay := sum_decay + (past_event_val * decay)
array.set(intensity, i, lambda_0 + alpha * sum_decay)
intensity
The parameters alpha, beta, and lambda all represent a different real thing.
Alpha (α):
Definition: Alpha represents the excitation factor or the magnitude of the influence that past events have on the future intensity of the process. In simpler terms, it measures how much each event "excites" or triggers additional events. It is constrained between 0.01 and 1.0 (e.g., clamp(array.get(params, 0), 0.01, 1.0)). A higher alpha means past events have a stronger influence on increasing the intensity (likelihood) of future events. Initial value is set to 0.1 in init_params. In the hawkes_process function, alpha scales the contribution of past events to the current intensity via the term alpha * sum_decay.
Beta (β):
Definition: Beta controls the rate of exponential decay of the influence of past events over time. It determines how quickly the effect of a past event fades away. It is constrained between 0.1 and 10.0 (e.g., clamp(array.get(params, 1), 0.1, 10.0)). A higher beta means the influence of past events decays faster, while a lower beta means the influence lingers longer. Initial value is set to 0.1 in init_params. In the hawkes_process function, beta appears in the decay term math.exp(-beta * time_diff), which reduces the impact of past events as the time difference (time_diff) increases.
Lambda_0 (λ₀):
Definition: Lambda_0 is the baseline intensity of the process, representing the rate at which events occur in the absence of any excitation from past events. It’s the "background" rate of the process. It is constrained between 0.01 and 0.3 .A higher lambda_0 means a higher natural frequency of events, even without the influence of past events. Initial value is set to 0.1 in init_params. In the hawkes_process function, lambda_0 sets the minimum intensity level, to which the excitation term (alpha * sum_decay) is added: lambda_0 + alpha * sum_decay
Alpha (α): Strength of event excitation (how much past events boost future events).
Beta (β): Rate of decay of past event influence (how fast the effect fades).
Lambda_0 (λ₀): Baseline event rate (background intensity without excitation).
Other parts of the script.
Clamp
The clamping function is a simple way to make sure parameters don’t grow or shrink too much.
ObjectiveFunction
This function defines the objective function (negative log-likelihood) to minimize during parameter optimization.It returns a float representing the negative log-likelihood (to be minimized).
How It Works:
Calls hawkes_process to compute the intensity array based on current parameters.Iterates over the lookback period:lambda_t: Intensity at time i.event: Event magnitude at time i.Handles na values by replacing them with 0.Computes log-likelihood: event_clean * math.log(math.max(lambda_t_clean, 0.001)) - lambda_t_clean.Ensures lambda_t_clean is at least 0.001 to avoid log(0).Accumulates into log_likelihood.Returns -log_likelihood (negative because the goal is to minimize, not maximize).
It is used in the optimization process to evaluate how well the parameters fit the observed event data.
Finite Difference Gradient:
This function calculates the gradient of the objective function we spoke about. The gradient is like a directional derivative. Which is like the direction of the rate of change. Which is like the direction of the slope of a hill, we can go up or down a hill. It nudges around the parameter, and calculates the derivative of the parameter. The array of these nudged around parameters is what is returned after they are optimized.
Minimize:
This is the function that actually has the loop and calls the Finite Difference Gradient each time. Here is where the minimizing happens, how we go down the hill. If we are below a tolerance, we are at the bottom of the hill.
Applied
After an initial guess the parameters are optimized with a mix of bid and ask levels to prevent some over-fitting for each side while keeping some efficiency. We initialize two different arrays to store the bid and ask sizes. After we optimize the parameters we clamp them for the calculations. We then get the array of intensities from the Hawkes Process of bid and ask and plot them both. When the bids are greater than the ask it represents a bullish scenario where there are likely to be more buy than sell orders, pushing up price.
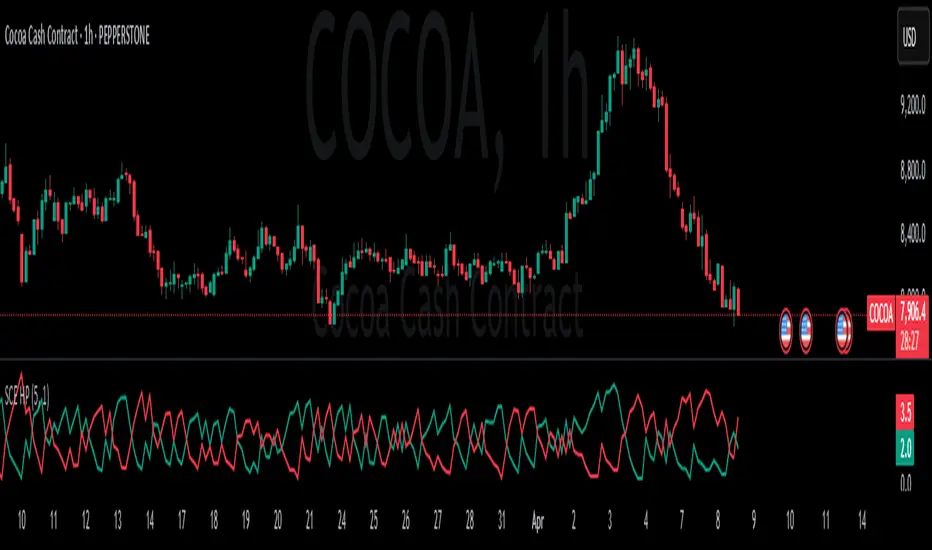
Tool examples:
The idea is that when the bid side is more excitable it is more likely to see a bullish reaction, when the ask is we see a bearish reaction.
We see that there are a lot of crossovers, and I picked two specific spots. The idea of this isn’t to spot crossovers but avoid chop. The values are either close together or far apart. When they are far, it is a classification for us to look for our own opportunities in, when they are close, it signals the market can’t pick a direction just yet.
The value works just as well on a higher timeframe as on a lower one. Hawkes Process is an estimate, so there is a leading value aspect of it.
The value works on equities as well, here is NASDAQ:TSLA on a lower time frame with a lookback of 5.
Inputs
Users can enter the lookback value and timeframe.
No tool is perfect, the Hawkes Process value is also not perfect and should not be followed blindly. It is good to use any tool along with discretion and price action.
Chart patterns
⚔️ ScalperX: Trap Sniper Pro
## ⚙️ **ScalperX: Trap Sniper Pro **
This script is a **smart money trap detector** built for scalpers and day traders who want to catch **reversals at liquidity sweeps** — before the big moves start.
It identifies **fakeouts**, **stop hunts**, and **trap wicks** by combining:
- Swing high/low sweeps
- Candle body confirmation
- VWAP bias
- Minimum volatility filter
---
### 🔍 Core Features:
- **Trap Wick Detection**
Detects if price sweeps a recent high or low and immediately rejects — classic liquidity grab behavior.
- **VWAP Trend Bias**
Ensures signals are only taken in the direction of institutional flow.
- **Minimum Movement Filter**
Filters out small or irrelevant candles — only signals when price range exceeds a set percentage (e.g., 0.3%).
- **Visual Debug Markers**
Triangles show sweep zones, circles show valid volatility — so you can see *why* a signal did or didn’t fire.
- **BUY / SELL Labels**
Signals are shown clearly when all trap and trend conditions align.
- **Alerts Built-In**
Set notifications for when trap signals appear in real time.
---
### 🧠 Strategy Logic:
**BUY Trap (Long Entry):**
- Price sweeps a recent low
- Candle closes bullish above VWAP
- Minimum range (e.g., 0.3%)
**SELL Trap (Short Entry):**
- Price sweeps a recent high
- Candle closes bearish below VWAP
- Minimum range (e.g., 0.3%)
---
### 🧪 Ideal For:
- Crypto scalpers (1m, 5m, 15m)
- Stop hunt reversal traders
- Smart money + liquidity-style systems
---

Custom Daily % Levels Table📘 Indicator Description
"Custom Daily % Levels – table" is a dynamic and customizable tool designed to help traders visualize daily percentage-based price ranges and key metrics in a compact, table-style format.
🧩 Key Features:
📐 Custom Percent Levels: Automatically calculates upper and lower price levels based on a user-defined base percentage and number of levels, relative to the previous daily close.
🟢🔴 Color Gradient Highlighting: Positive levels are shown with a green gradient, negative levels with red, and the level labels with a neutral tone for easy reference.
📊 Live Asset Info: Displays the current symbol, percentage change from the previous daily close, and 14-period RSI, all color-coded for quick interpretation.
⚙️ Header Control: Toggle the visibility of the main info headers and level headers independently.
📌 Position Customization: Choose where the table appears on your chart (top/bottom, left/right, center).
📈 Clean Layout: Makes it easy to visually track price movement relative to daily expected ranges.
This indicator is especially useful for intraday traders, scalpers, or anyone needing a clear visual of short-term price expansion and contraction based on predefined volatility zones.

Smarter Money Concepts - OBs [PhenLabs]📊 Smarter Money Concepts - OBs
Version: PineScript™ v6
📌 Description
Smarter Money Concepts - OBs (Order Blocks) is an advanced technical analysis tool designed to identify and visualize institutional order zones on your charts. Order blocks represent significant areas of liquidity where smart money has entered positions before major moves. By tracking these zones, traders can anticipate potential reversals, continuations, and key reaction points in price action.
This indicator incorporates volume filtering technology to identify only the most significant order blocks, eliminating low-quality signals and focusing on areas where institutional participation is likely present. The combination of price structure analysis and volume confirmation provides traders with high-probability zones that may attract future price action for tests, rejections, or breakouts.
🚀 Points of Innovation
Volume-Filtered Block Detection : Identifies only order blocks formed with significant volume, focusing on areas with institutional participation
Advanced Break of Structure Logic : Uses sophisticated price action analysis to detect legitimate market structure breaks preceding order blocks
Dynamic Block Management : Intelligently tracks, extends, and removes order blocks based on price interaction and time-based expiration
Structure Recognition System : Employs technical analysis algorithms to find significant swing points for accurate order block identification
Dual Directional Tracking : Simultaneously monitors both bullish and bearish order blocks for comprehensive market structure analysis
🔧 Core Components
Order Block Detection : Identifies institutional entry zones by analyzing price action before significant breaks of structure, capturing where smart money has likely positioned before moves.
Volume Filtering Algorithm : Calculates relative volume compared to a moving average to qualify only order blocks formed with significant market participation, eliminating noise.
Structure Break Recognition : Uses price action analysis to detect legitimate breaks of market structure, ensuring order blocks are identified only at significant market turning points.
Dynamic Block Management : Continuously monitors price interaction with existing blocks, extending, maintaining, or removing them based on current market behavior.
🔥 Key Features
Volume-Based Filtering : Filter out insignificant blocks by requiring a minimum volume threshold, focusing only on zones with likely institutional activity
Visual Block Highlighting : Color-coded boxes clearly mark bullish and bearish order blocks with customizable appearance
Flexible Mitigation Options : Choose between “Wick” or “Close” methods for determining when a block has been tested or mitigated
Scan Range Adjustment : Customize how far back the indicator looks for structure points to adapt to different market conditions and timeframes
Break Source Selection : Configure which price component (close, open, high, low) is used to determine structure breaks for precise block identification
🎨 Visualization
Bullish Order Blocks : Blue-colored rectangles highlighting zones where bullish institutional orders were likely placed before upward moves, representing potential support areas.
Bearish Order Blocks : Red-colored rectangles highlighting zones where bearish institutional orders were likely placed before downward moves, representing potential resistance areas.
Block Extension : Order blocks extend to the right of the chart, providing clear visualization of these significant zones as price continues to develop.
📖 Usage Guidelines
Order Block Settings
Scan Range : Default: 25. Defines how many bars the indicator scans to determine significant structure points for order block identification.
Bull Break Price Source : Default: Close. Determines which price component is used to detect bullish breaks of structure.
Bear Break Price Source : Default: Close. Determines which price component is used to detect bearish breaks of structure.
Visual Settings
Bullish Blocks Color : Default: Blue with 85% transparency. Controls the appearance of bullish order blocks.
Bearish Blocks Color : Default: Red with 85% transparency. Controls the appearance of bearish order blocks.
General Options
Block Mitigation Method : Default: Wick, Options: Wick, Close. Determines how block mitigation is calculated - “Wick” uses high/low values while “Close” uses close values for more conservative mitigation criteria.
Remove Filled Blocks : Default: Disabled. When enabled, order blocks are removed once they’ve been mitigated by price action.
Volume Filter
Volume Filter Enabled : Default: Enabled. When activated, only shows order blocks formed with significant volume relative to recent average.
Volume SMA Period : Default: 15, Range: 1-50. Number of periods used to calculate the average volume baseline.
Min. Volume Ratio : Default: 1.5, Range: 0.5-10.0. Minimum volume ratio compared to average required to display an order block; higher values filter out more blocks.
✅ Best Use Cases
Identifying high-probability support and resistance zones for trade entries and exits
Finding optimal stop-loss placement behind significant order blocks
Detecting potential reversal areas where price may react after extended moves
Confirming breakout trades when price clears major order blocks
Building a comprehensive market structure map for medium to long-term trading decisions
Pinpointing areas where smart money may have positioned before major market moves
⚠️ Limitations
Most effective on higher timeframes (1H and above) where institutional activity is more clearly defined
Can generate multiple signals in choppy market conditions, requiring additional filtering
Volume filtering relies on accurate volume data, which may be less reliable for some securities
Recent market structure changes may invalidate older order blocks not yet automatically removed
Block identification is based on historical price action and may not predict future behavior with certainty
💡 What Makes This Unique
Volume Intelligence : Unlike basic order block indicators, this script incorporates volume analysis to identify only the most significant institutional zones, focusing on quality over quantity.
Structural Precision : Uses sophisticated break of structure algorithms to identify true market turning points, going beyond simple price pattern recognition.
Dynamic Block Management : Implements automatic block tracking, extension, and cleanup to maintain a clean and relevant chart display without manual intervention.
Institutional Focus : Designed specifically to highlight areas where smart money has likely positioned, helping retail traders align with institutional perspectives rather than retail noise.
🔬 How It Works
1. Structure Identification Process :
The indicator continuously scans price action to identify significant swing points and structure levels within the specified range, establishing a foundation for order block recognition.
2. Break Detection :
When price breaks an established structure level (crossing below a significant low for bearish breaks or above a significant high for bullish breaks), the indicator marks this as a potential zone for order block formation.
3. Volume Qualification :
For each potential order block, the algorithm calculates the relative volume compared to the configured period average. Only blocks formed with volume exceeding the minimum ratio threshold are displayed.
4. Block Creation and Management :
Valid order blocks are created, tracked, and managed as price continues to develop. Blocks extend to the right of the chart until they are either mitigated by price action or expire after the designated timeframe.
5. Continuous Monitoring :
The indicator constantly evaluates price interaction with existing blocks, determining when blocks have been tested, mitigated, or invalidated, and updates the visual representation accordingly.
💡 Note:
Order Blocks represent areas where institutional traders have likely established positions and may defend these zones during future price visits. For optimal results, use this indicator in conjunction with other confluent factors such as key support/resistance levels, trendlines, or additional confirmation indicators. The most reliable signals typically occur on higher timeframes where institutional activity is most prominent. Start with the default settings and adjust parameters gradually to match your specific trading instrument and style.

Donchian Channel Trend Meter [Custom TF]DC TREND METER WITH CUSTOM TF
Check trend patterns in combi with other confleunces w/m formation above 50 ma 1 hr
BUY trend breaks and pay attention to 50 line
1 minute works good already

[4LC] Period Highs, Lows and OpensPeriod Highs, Lows, and Opens (HLO)
This script plots highs, lows, and opens from different time periods—yearly, monthly, weekly, Monday, and daily—on your chart. It includes a grouping feature that combines levels close to each other, based on a percentage distance, to keep the display organized.
What It Does:
It shows key price levels from various timeframes, marking where the market has hit highs, lows, or started a period. These levels can indicate potential support or resistance zones and help track price behavior over time.
How to Use It:
Add it to your chart and choose which levels to display (e.g., "Yearly High," "Daily Open").
Check where price is relative to these levels—above might suggest upward momentum, below could point to downward pressure.
Use the highs and lows to identify ranges for trading or watch for breakouts past these points.
Adjust settings like colors, spacing, or grouping distance as needed, and toggle price labels to see exact values.
Notes:
The script pulls data from multiple periods to give a broader view of price action. The grouping reduces overlap by averaging nearby levels into a single line with a combined label (e.g., "Yearly High, Monthly High"). It’s meant for traders interested in tracking significant levels across timeframes, whether for range trading or spotting market direction.

Break to the Right (Internal)Break to the right indicator. Alert alerts when price action creates internal breaks, possibly indicating a shift in direction.

False Breakout PRO📌 False Breakout PRO – Enhanced False Breakout Detection Tool
False Breakout PRO is an advanced version of the original "False Breakout (Expo)" indicator by .
This tool is designed to help traders detect bullish and bearish false breakouts with high precision. By offering a more customizable and smarter interface, it helps reduce noise and false signals through various filtering and visualization options.
🔍 How It Works
The script continuously scans for new highs or lows based on a user-defined period.
It identifies false breakouts when price briefly breaks out of a recent high/low but then quickly reverses. These are often seen as market traps, and this indicator aims to highlight them early.
✅ Key Features in the PRO Version
📌 Toggle to display all signals or only the most recent one
💬 Price labels with clean text and optional visibility
📊 Smart summary table for instant signal reference
📈 Auto-extended lines that follow price action
⚡ Lightweight and optimized for speed and real-time responsiveness
🛠 Configurable Settings
False breakout detection period
Signal validity window (how long a signal is considered active)
Smoothing types: Raw (💎), WMA, or HMA
Aggressive mode for early signal generation
Enable or disable:
Price labels
Summary table
Only latest signal mode
⚠️ License Notice
This script is derived from @Zeiierman’s original work and is published under the Creative Commons BY-NC-SA 4.0 license.
🔒 Commercial use is NOT allowed. Attribution to the original author is required.
🇸🇦 False Breakout PRO – أداة متقدمة لكشف الكسر الكاذب
False Breakout PRO هو إصدار مطور من السكريبت الأصلي "False Breakout (Expo)" من تطوير ، وتم تحسينه لتقديم تجربة استخدام أكثر احترافية ومرونة للمستخدمين للكشف عن الكسر الكاذب
🔍 آلية العمل
يقوم السكريبت بمراقبة القمم والقيعان الجديدة بناءً على فترة يتم تحديدها من قبل المستخدم.
ثم يحدد الكسر الكاذب عندما يكسر السعر مستوى مرتفعًا أو منخفضًا ثم يعود بسرعة. هذه الحركة غالبًا ما تكون خداعًا للمضاربين، ويقوم المؤشر بكشفها مبكرًا.
✅ أهم ميزات النسخة PRO
📌 التبديل بين عرض جميع الإشارات أو أحدث إشارة فقط
💬 عرض سعر الإشارة بنص نظيف واختياري
📊 جدول ملخص ذكي لعرض آخر الإشارات بسرعة
📈 تمديد تلقائي للخطوط لمتابعة حركة السعر
⚡ واجهة خفيفة وسريعة ومناسبة للعرض اللحظي
🛠 الإعدادات القابلة للتعديل
فترة تحديد الكسر الكاذب
مدة صلاحية الإشارة
أنواع الفلترة: 💎 خام، WMA، أو HMA
وضع الكشف العدواني (Aggressive)
خيارات العرض:
إظهار أو إخفاء السعر
إظهار أو إخفاء الجدول
عرض آخر إشارة فقط
⚠️ رخصة الاستخدام
تم تطوير هذا السكريبت بالاعتماد على السكريبت الأصلي من @Zeiierman
وهو مرخص بموجب Creative Commons BY-NC-SA 4.0
🔒 الاستخدام التجاري غير مسموح. ويجب نسب الفضل للمطور الأصلي.

Pullback Entry Zone FinderPullback Entry Zone Finder
Overview:
This indicator is designed to help traders identify potential buying opportunities during short-term pullbacks, particularly when faster-moving averages show signs of converging back towards slower ones. It visually flags potential zones where price might find support and resume its upward movement, based on moving average dynamics and price proximity.
How It Works:
The indicator utilizes four customizable moving averages (Trigger, Short-term, Intermediate, and Long-term) and Average True Range (ATR) to pinpoint specific conditions:
Pullback Detection: It identifies when the fast 'Trigger MA' is below the 'Short-term MA', indicating a potential short-term pullback or consolidation phase.
MA Convergence: Crucially, it looks for signs that the pullback might be weakening by detecting when the gap between the Short-term MA and the Trigger MA is narrowing (maConverging). This suggests the faster average is starting to catch up, potentially preceding a move back up.
Base Buy Zone (Orange Diamond): This signal appears when both the Pullback and Convergence conditions are met simultaneously. It indicates the general area where conditions are becoming favourable for a potential entry.
Refined Entry Zones:
Prime Entry Zone (Green Diamond): This appears within a Base Buy Zone if the bar's low comes within a specified percentage (Max Distance %) of the Short-term MA. It suggests price has pulled back close to the dynamic support of the Short MA.
ATR Entry Zone (Purple Diamond): This appears within a Base Buy Zone if the bar's low comes within the specified percentage (Max Distance %) of an ATR-based target level. This target level (Buy ATR Target Level, plotted as a purple line when active) is calculated by adding a multiple (ATR Multiplier %) of the ATR to the Short-term MA, providing a volatility-adjusted potential entry area.
Visual Elements:
Moving Averages: Four lines representing the Trigger, Short-term, Intermediate, and Long-term MAs (colors and opacity are customizable). Use the Intermediate and Long-term MAs to gauge the broader market trend.
Orange Diamond (Below Bar): Indicates a 'Base Buy Zone' where a pullback and MA convergence are detected.
Green Diamond (Below Bar): Indicates a 'Prime Entry Zone' where price is close to the Short-term MA during a Base Buy Zone.
Purple Diamond (Below Bar): Indicates an 'ATR Entry Zone' where price is close to the ATR-based target level during a Base Buy Zone.
Purple Line: Plots the calculated 'Buy ATR Target Level' only when the Base Buy Zone condition is active.
Input Parameters:
Moving Averages: Customize the Length and Type (EMA, SMA, WMA, VWMA) for all four moving averages.
ATR Settings: Adjust the ATR Length, the ATR Multiplier % (for calculating the target level), and the Max Distance % (for triggering the Prime and ATR Entry Zones).
Visualization: Set the colors for the four Moving Average lines.
How to Use:
Look for the Orange Diamond as the initial signal that pullback/convergence conditions are met.
The Green and Purple Diamonds suggest price has reached potentially more optimal entry levels within that zone, based on proximity to the Short MA or the ATR target, respectively.
Always consider the signals within the context of the broader trend, indicated by the Intermediate and Long-term MAs. This indicator is generally more effective when used to find entries during pullbacks within an established uptrend (e.g., Intermediate MA > Long MA).
Combine these signals with other forms of analysis, such as chart patterns, support/resistance levels, volume analysis, or other indicators for confirmation.
Disclaimer:
You should always use proper risk management techniques and conduct your own analysis before making any trading decisions. This indicator, or any other, will be of no use if you don't have good risk management.

BEAST Empathy Meter - English VersionBEAST Empathy Meter – AI-powered Market Sentiment & Entry Clarity
The BEAST Empathy Meter is an advanced AI-powered trading companion that helps traders identify market sentiment, emotional extremes, and precise entry conditions for both Long and Short trades. Designed as a fusion of emotional analytics and technical clarity, it decodes market dynamics using logic-based metrics rather than traditional noise.
---
## 📌 What does the BEAST Empathy Meter do?
It analyzes the psychological state of the market using 4 key modules:
1. **EmpathyScore System** – Calculates emotional momentum based on candle structure, volatility, ROC, MACD, RSI, volume and trend behavior.
2. **Fear & Greed Indicator** – Combines volatility, momentum, volume spikes and cluster sentiment (SPX, BTC, VIX) into a single intuitive score.
3. **Entry Confidence Matrix** – Dynamically scores trade setups from 0%–100% based on logic, clarity, trend alignment, and confirmation.
4. **Forecast Probability** – Assesses the strength of agreement between trend, momentum, GCN, cluster alignment, and WaveTrend dynamics.
---
## ⚙️ How it works
- The **EmpathyScore** ranges from –100 (Fear) to +100 (Greed), showing the emotional intensity of the market.
- A **dynamic entryScore** calculates the confidence of current setups and highlights when a Long or Short trade is potentially favorable.
- The **MetaScore** label combines risk, entryScore and forecast alignment to guide clear decisions:
- ✅ "🔥 Trade Recommended"
- ⚠️ "Mixed Signal"
- 🚫 "No Trade"
---
## 🧠 How to trade with it
- **Only trade when the MetaScore says "🔥 Trade Recommended"**.
- Use the **Entry Confidence table** to evaluate risk, confidence, forecast probability and WaveTrend validation.
- Confirm alignment with the **Fear & Greed bar**, sentiment tunnel, and cluster overview (SPX / BTC / VIX).
- Avoid trades during neutral or uncertain phases, especially when emotions and momentum disagree.
---
## 🔍 Originality
This indicator is 100% custom-built from the ground up and merges emotional sentiment, trend validation and machine-learning-inspired logic for a unique, forward-thinking approach to market timing. It is not a mashup of existing open-source indicators.
---
## 📷 Recommended chart setup
Use a clean chart with the BEAST Empathy Meter as your main overlay. The indicator works best on 30-minute to 1-hour charts, but is flexible enough to adapt to multiple timeframes.
---

Advanced Trading Dashboard🚀 Powerful Multi-Indicator Tool for TradingView
The Advanced Trading Dashboard (ATD) combines essential technical indicators into one clean, customizable script for TradingView. Designed for traders who need quick market insights, this tool integrates:
🔥 Key Features:
✅ EMA Crossovers – Track short-term trends with 7 & 20 EMA (plotted in blue & red)
✅ VWAP – Identify fair value and intraday trends (purple line)
✅ CPR (Central Pivot Range) – Key levels for day traders:
Pivot (Yellow)
BC (Bottom Central, Green Circles)
TC (Top Central, Red Circles)
Shaded CPR Range (Gray) for visual support/resistance zones
✅ Advanced RSI – With adjustable levels & signals:
Overbought/Oversold (70/30, dotted lines)
Mid-Level (50) for trend confirmation
Buy/Sell Arrows when RSI crosses key levels
Optional RSI Pane (toggle on/off)
✅ Built-in Alerts – Get notified for:
EMA 7/20 Crossovers
RSI Overbought/Oversold Exits
🌟 Why Use This Script?
✔ All-in-One Dashboard – No need for multiple indicators cluttering your chart
✔ Clean & Customizable – Adjust colors, levels, and visibility
✔ Works on All Timeframes – Scalping, day trading, or swing trading
✔ Pine Script v6 Optimized – Smooth performance with TradingView’s latest features
📌 Perfect For:
Day Traders (CPR + VWAP for intraday levels)
Swing Traders (EMA crossovers + RSI for trend confirmation)
Algorithmic Traders (Built-in alerts for strategy automation)
📢 Try it now and enhance your trading decisions with a professional-grade multi-indicator tool! 🚀

Fibonacci Levels with SMA SignalsThis strategy leverages Fibonacci retracement levels along with the 100-period and 200-period Simple Moving Averages (SMAs) to generate robust entry and exit signals for long-term swing trades, particularly on the daily timeframe. The combination of Fibonacci levels and SMAs provides a powerful way to capitalize on major trend reversals and market retracements, especially in stocks and major crypto assets.
The core of this strategy involves calculating key Fibonacci retracement levels (23.6%, 38.2%, 61.8%, and 78.6%) based on the highest high and lowest low over a 365-day lookback period. These Fibonacci levels act as potential support and resistance zones, indicating areas where price may retrace before continuing its trend. The 100-period SMA and 200-period SMA are used to define the broader market trend, with the strategy favoring uptrend conditions for buying and downtrend conditions for selling.
This indicator highlights high-probability zones for long or short swing setups based on Fibonacci retracements and the broader trend, using the 100 and 200 SMAs.
In addition, this strategy integrates alert conditions to notify the trader when these key conditions are met, providing real-time notifications for optimal entry and exit points. These alerts ensure that the trader does not miss significant trade opportunities.
Key Features:
Fibonacci Retracement Levels: The Fibonacci levels provide natural price zones that traders often watch for potential reversals, making them highly relevant in the context of swing trading.
100 and 200 SMAs: These moving averages help define the overall market trend, ensuring that the strategy operates in line with broader price action.
Buy and Sell Signals: The strategy generates buy signals when the price is above the 200 SMA and retraces to the 61.8% Fibonacci level. Sell signals are triggered when the price is below the 200 SMA and retraces to the 38.2% Fibonacci level.
Alert Conditions: The alert conditions notify traders when the price is at the key Fibonacci levels in the context of an uptrend or downtrend, allowing for efficient monitoring of trade opportunities.
Application:
This strategy is ideal for long-term swing trades in both stocks and major cryptocurrencies (such as BTC and ETH), particularly on the daily timeframe. The daily timeframe allows for capturing broader, more sustained trends, making it suitable for identifying high-quality entries and exits. By using the 100 and 200 SMAs, the strategy filters out noise and focuses on larger, more meaningful trends, which is especially useful for longer-term positions.
This script is optimized for swing traders looking to capitalize on retracements and trends in markets like stocks and crypto. By combining Fibonacci levels with SMAs, the strategy ensures that traders are not only entering at optimal levels but also trading in the direction of the prevailing trend.
Enhanced Indicators### **Summary of the "Enhanced Indicators with Fib Levels" TradingView Script**
This script is a comprehensive trading tool designed for **Smart Money Concepts (SMC), Fibonacci retracement analysis, Fear Value Gaps (FVG), and trend-following indicators**. It combines multiple technical analysis approaches into a single overlay, helping traders identify key levels, breakouts, and potential reversals.
---
### **Key Features & Benefits**
#### **1. Fibonacci Retracement Levels (Daily)**
- Plots key Fib levels (23.6%, 38.2%, 50%, 61.8%, 78.6%) based on the **previous day’s high and low**.
- Helps identify **support/resistance zones** for potential reversals or continuations.
#### **2. Smart Money Concepts (SMC) Structures**
- **Break of Structure (BOS) & Change of Character (CHoCH)** detection.
- Customizable colors, line styles, and widths for visual clarity.
- Tracks recent structural breaks, helping traders spot **trend shifts and liquidity sweeps**.
#### **3. Fear Value Gaps (FVG) Detection**
- Identifies **unfilled imbalances** (bullish/bearish FVGs).
- Highlights **mitigated FVGs** (filled gaps) in gray.
- Adjustable history length to avoid clutter.
#### **4. Chandelier Exit (Trend-Following Stop)**
- Uses **ATR-based trailing stops** for long/short positions.
- Plots **BUY/SELL signals** when trend direction changes.
#### **5. Technical Indicators (Optional)**
- **EMA 5, EMA 50, EMA 200, SMA 100, SMA 200** for trend confirmation.
- **RSI Overbought/Oversold** conditions with alerts.
- **MACD Crossovers** for momentum signals.
- **Volume spikes** highlighted for confirmation.
#### **6. Customization & User Controls**
- Toggle on/off different components (SMC, FVG, indicators).
- Adjust colors, line styles, and history lengths.
- Choose between **candle body or wick breaks** for structure validation.
---
### **Benefits for Traders**
✅ **Multi-Timeframe Analysis**: Combines **daily Fib levels** with **intraday SMC structures** for high-probability setups.
✅ **Clear Visuals**: Customizable colors and styles prevent chart clutter while highlighting key levels.
✅ **Trend Confirmation**: Chandelier Exit + Moving Averages help filter trades in the right direction.
✅ **Institutional Concepts**: Focuses on **order flow, liquidity, and imbalances** (SMC & FVG).
✅ **Flexible**: Works for **swing trading, day trading, and scalping** depending on settings.
---
### **Best For:**
- Traders using **Smart Money Concepts (ICT, SMC, Price Action)**.
- Those looking for **Fibonacci confluence with order flow**.
- Traders who need **ATR-based trailing stops** (Chandelier Exit).
- Anyone wanting a **clean, all-in-one indicator** for key levels and trend analysis.
This script is **highly adaptable** and can be fine-tuned for different trading styles. 🚀

Trend ChannelThis is a Pine Script code written in version 6 for creating a trend channel indicator on TradingView. The indicator is called "Trend Channel" and is credited to "NachomixCrypto." Here's an explanation of what the code does:
Input Parameters
upperMult: Multiplier for the upper channel line, default is 2.0.
lowerMult: Multiplier for the lower channel line, default is -2.0.
useUpperDev: Boolean to activate/deactivate the upper deviation line. Default is false.
useLowerDev: Boolean to activate/deactivate the lower deviation line. Default is false.
showPearson: Boolean to show or hide Pearson's correlation coefficient (R). Default is true.
extendLines: Boolean to extend the channel lines to the right. Default is false.
len: Length (number of bars) to calculate the slope and deviations, default is 50.
src: Source data for the indicator, default is "close".
Line Customization Inputs
baseColor: Color for the base (middle) channel line, default is white.
upperColor: Color for the upper channel line, default is green.
lowerColor: Color for the lower channel line, default is red.
lineThickness: Thickness of the channel lines, default is 1.
Core Functions
calcSlope(): Calculates the slope (rate of change) for the given source over a specified length. It uses the least squares method to calculate the line of best fit.
slope: The rate of change.
average: The average value of the source data.
intercept: The intercept where the line crosses the Y-axis.
calcDev(): Calculates the standard deviation and Pearson's correlation coefficient (R) for the given source. It also computes the upper and lower deviations.
stdDev: Standard deviation, representing how much the data deviates from the mean.
pearsonR: Pearson's correlation coefficient, which measures the linear correlation between the source data and the regression line.
upDev: Upper deviation (difference from the highest value).
dnDev: Lower deviation (difference from the lowest value).
Main Logic
The code then calculates the upper and lower channel lines based on the calculated slope, intercept, and deviations.
Upper and lower start prices are adjusted using the multipliers and deviations, either based on the user inputs or the standard deviation.
Base, upper, and lower lines are drawn on the chart using the calculated prices. These lines represent the trend channel.
Pearson's R Label
The Pearson's R value is displayed as a label on the chart if showPearson is true. It is positioned at the lowest point between the upper and lower lines.
Debugging Plot
A small debugging circle is plotted above the bar to indicate whether the Pearson's R is valid and being calculated.
Final Notes
The trend channel dynamically adjusts based on price action and can be extended for future price movements.
The Pearson's R value gives an indication of how well the regression line fits the price data.

Hammer and Trendline Strategy AlertsPurpose: Capture high-probability reversals or breakouts by combining multi-timeframe trendlines, candlestick patterns, risk control, and SMA confirmation.
TradingView Pine Script indicator for the Hammer and Trendline Strategy:
Auto-detection of hammers and inverted hammers
Volume spike filtering
9-SMA and 50-SMA trend confirmation
Visual chart background highlights
Alert conditions for long and short setups
Pullback Long Screener - Bougie Verte 4h
This script is designed to be used within a Pullback Long Screener on TradingView.
It identifies cryptocurrencies currently displaying a green 4-hour candle (i.e., when the close is higher than the open).
The goal is to quickly detect assets in a potential bullish move, which is particularly useful for scalping.
This script is configured to work exclusively on cryptocurrencies listed on Binance as perpetual futures contracts.
The green circles displayed below the candles indicate a valid green 4-hour candle condition.

Price Up and Down Percentage NACHOMIXCRYPTOThis Pine Script indicator, titled "Price Up and Down Percentage NACHOMIXCRYPTO", is designed to calculate and display the percentage increase and decrease of the price for a given day. Here’s how it works:
1. Indicator Purpose
The indicator tracks the highest and lowest price points of the day.
It calculates the percentage price increase from the lowest price to the current closing price.
It also calculates the percentage price decrease from the highest price to the current closing price.
Additionally, it shows the average change and the combined percentage of both movements.
2. Key Features
Customizable Visuals:
You can adjust the line colors, widths, label colors, and text alignment.
Labels for percentage changes are displayed near the current price.
Daily Highs and Lows:
The indicator resets the lowest and highest price at the start of a new day.
Percentage Calculations:
PriceRise: The percentage change from the day’s lowest price to the current close.
PriceDrop: The percentage change from the day’s highest price to the current close.
AvgChange: The average of the rise and drop percentages.
Total+-: The sum of the price rise and drop, providing a combined market movement view.
3. Visual Representation
Lines:
A green line represents the upward movement (from the lowest price to the current price).
A red line represents the downward movement (from the highest price to the current price).
Labels:
The percentage increase is labeled in green, and the percentage decrease is labeled in red.
The labels are positioned with an adjustable offset for clarity.
Table Display:
A table in the bottom-right corner displays all the calculated values for quick reference.
4. Practical Use
Trend Analysis: Helps identify if the market has shown significant upward or downward movement during the day.
Volatility Assessment: Traders can evaluate the volatility based on the total percentage movement.
Decision Support: Provides a clear indication of how much the price has moved relative to its daily high and low.
Overall, this indicator is useful for intraday traders to monitor price movements and make informed trading decisions.

Multi-Timeframe RSI Overbought/Oversold Stackmakes a small GUI that shows RSI levels for 5min, 15min, 1hr, 4hr and 1day. if over sold or over bought.

Multi TF Fibonacci Divergence StrategyTake 2
The 1 hour and 4 hour time frame must be above the 200 Exponential Moving average for buy trades, and below the 200 Exponential Moving Average for sell trades.
Price on the previous day's daily candle must have closed above the candle before its body and wick for buys and below it for sells. (Example: Today is Monday and price has not yet closed, fridays daily candle closed above the thursday candles body and wick for buys and below it for sells)
Price on The 15 minute time frame must retrace past the 50% level on the fibonacci indicator. Price must not close beyond the 78.6% level on the fibonacci indicator. (on the 5 minute time frame, 15 minute time frame, 1 hour time frame, 4 hour time frame.)
Price on the 15 minute time frame must have retraced to the -27% or -61.8 levels on the fibonacci indicator. (Price must not close beyond the 78.6% fibonacci level on the hourly time frame)
Price on the 15 minute time frame or the 5 minute time frame must show bullish divergence once price has touched the -27% or -61.8% fibonacci level for buys and bearish divergence for sells. (This only applies to the 1 hour time frame retraced market structure on the 15 minute and 5 minute time frame only)

Trade Sniperz 200 EMA with Triangle SignalsThis versatile moving average tool combines:
A 200-period EMA that toggles between line/cross display
Color-changing visual trend identification
Triangle signals at crossovers
Customizable display options
Key Features
Feature Description Visual Example
200 EMA Display Shows as crosses by default (toggle to line) Colored + or × marks
Trend Colors Green when price > EMA (bullish), Red when price < EMA (bearish) Dynamic color change
Triangle Signals Green ▲ below bar (bullish cross), Red ▼ above bar (bearish cross) Clear entry/exit markers
Customization Toggle between line/cross display in settings Flexible viewing options
Recommended Usage
1. Trend Identification
Bullish Market: When price is above green EMA crosses/line
Bearish Market: When price is below red EMA crosses/line
Strong Trend Confirmation: Consistent crosses maintaining color
2. Trading Signals
Signal Type Condition Action
Buy Signal Green ▲ triangle appears + price crosses above EMA Consider long positions
Sell Signal Red ▼ triangle appears + price crosses below EMA Consider short positions
Trend Filter Only trade in direction of EMA color (green=longs, red=shorts) Increases win rate
3. Display Options
pinescript
Copy
showAsLine = input(false, "Display as Line (uncheck for crosses)")
✔ Checked: Shows traditional EMA line
✖ Unchecked: Shows EMA as crosses (default)
Pro Tips
Combine with Support/Resistance: Use crosses near key levels for higher probability trades
Timeframe Flexibility: Works on all timeframes (1min - monthly charts)
Volume Confirmation: Increase position size when crosses align with high volume
Cross Density: More frequent crosses indicate choppy markets (caution needed)
Input Parameters
Parameter Default Description
Length 200 EMA period (recommend keeping at 200)
Display as Line Off Toggle between crosses/line display
Visual Example
Copy
PRICE CHART:
▲ (Red triangle) - Bearish signal
× × × (Red crosses) - Price below EMA
- - - - - - - - -
● ● ● (Price bars)
- - - - - - - - -
+ + + (Green crosses) - Price above EMA
▲ (Green triangle) - Bullish signal
This indicator provides a clean, customizable way to track the important 200 EMA while getting clear visual signals for potential trend changes. The crosses make the EMA more visible on crowded charts, while the color-coding helps instantly identify trend direction.

Multi-Timeframe Price LevelsThis indicator displays key price levels from multiple timeframes on your chart, helping you identify important support and resistance zones.
## Features
- **Multiple Timeframes**: View price levels from 4H, Daily, 3-Day, Weekly, and Monthly charts simultaneously
- **Customizable Price Types**: Choose to display Open, Close, High, and Low prices
- **Color-Coded**: Each timeframe has its own color for easy identification
- **Fully Customizable**: Enable/disable specific timeframes and price types as needed
## How to Use
1. Add the indicator to your chart
2. Use the input options to select which timeframes and price types you want to display
3. Look for areas where multiple price levels converge - these often act as strong support/resistance zones
## Color Guide
- **Red**: 4-Hour timeframe
- **Blue**: Daily timeframe
- **Green**: 3-Day timeframe
- **Purple**: Weekly timeframe
- **Orange**: Monthly timeframe
For each timeframe, the transparency varies by price type:
- Open: 70% transparency
- Close: 50% transparency
- High: 30% transparency
- Low: 10% transparency (most visible)
## Trading Applications
- Identify key support and resistance levels
- Spot multi-timeframe confluences for stronger trade setups
- Plan entries and exits based on historical price reactions
- Set stop losses and take profit targets at significant levels
This indicator works best when combined with your existing trading strategy to confirm important price zones.
Previous Candle Range Split into ThirdsThis script plots two horizontal lines over the previous candle to divide its total range (high to low) into three equal parts. The first line marks 33% of the range from the low, and the second marks 66%. This helps users visually identify whether the previous candle closed in the lower, middle, or upper third of its range, providing context on potential buyer or seller dominance during that session.
Users can customize the color, width, and style (solid, dotted, dashed) of each line, as well as toggle their visibility from the script's input settings.
This indicator is designed as a discretionary analysis tool and does not generate buy or sell signals.

Buy and Sell Signal xNawaf (SMA)
"A new indicator, customizable for future adjustments. Thank you all!"
xNawaf
Nawaf aLOtaibi
thank you all

ATR Normalized⸻
🧠 First, What is ATR?
ATR (Average True Range) is a volatility indicator — it shows how much an asset moves (up or down) on average over a specific number of periods.
• Higher ATR = more volatility
• Lower ATR = less volatility
The classic ATR doesn’t care about direction — just how much the price moves.
⸻
📈 What is ATR Normalized?
Normalized ATR takes the ATR value and scales it to make it easier to compare across different stocks or timeframes.
It gives you a percentage-type value to understand volatility relative to historical average volatility.
⸻
🧮 The Formula (Simplified):
ATR_Normalized = (ATR(13) / SMA(ATR(13), 52)) * 100
⸻
📌 So, What Does (13, 52, 80) Mean?
These are user-defined input parameters for the custom ATR_Normalized indicator:
Parameter Meaning
13 Period for calculating ATR (short-term volatility)
52 Period for calculating the SMA (average ATR over a longer period)
80 Threshold level line (usually used as an alert zone for high volatility)
⸻
🧠 How to Interpret It on the Chart:
• If ATR_Normalized is above 80 (the red line):
• Volatility is unusually high
• Could be a sign of a breakout, news event, or reversal risk
• If ATR_Normalized is below 80:
• Volatility is within a normal range
• Calm markets or consolidation
⸻
💡 Example Use Cases:
1. Identify breakouts or trend starts
• Spikes in normalized ATR often come before large moves.
2. Filter trades based on volatility
• Avoid entering positions when volatility is too high or too low.
⸻
