RSI Buy/Sell SignalsRsI give Buy and Sell signal when rsi reaches the top and sell when it reaches the bottom.
Cycles

Stunden-Markierer 10min vor/nach10 Vor und 10 Nach für die beste und schnellste Übersicht wann IPDA bucht

Custom Daily % Levels Table📘 Indicator Description
"Custom Daily % Levels – table" is a dynamic and customizable tool designed to help traders visualize daily percentage-based price ranges and key metrics in a compact, table-style format.
🧩 Key Features:
📐 Custom Percent Levels: Automatically calculates upper and lower price levels based on a user-defined base percentage and number of levels, relative to the previous daily close.
🟢🔴 Color Gradient Highlighting: Positive levels are shown with a green gradient, negative levels with red, and the level labels with a neutral tone for easy reference.
📊 Live Asset Info: Displays the current symbol, percentage change from the previous daily close, and 14-period RSI, all color-coded for quick interpretation.
⚙️ Header Control: Toggle the visibility of the main info headers and level headers independently.
📌 Position Customization: Choose where the table appears on your chart (top/bottom, left/right, center).
📈 Clean Layout: Makes it easy to visually track price movement relative to daily expected ranges.
This indicator is especially useful for intraday traders, scalpers, or anyone needing a clear visual of short-term price expansion and contraction based on predefined volatility zones.

Market Pulse TableMarket Pulse Table – Customizable MACD Tracker
This indicator provides a clean and compact table showing real-time market signals for selected instruments.
✅ Features:
• Displays daily % change with color-coded sentiment (green for gains, red for losses)
• Shows MACD signal – "Buy", "Sell", or "Neutral" based on daily MACD crossovers
• Fully customizable: toggle which assets to include from a predefined list (e.g., ES1!, NQ1!, DXY, VIX...)
• Adjustable table position on chart
🎯 Designed for traders who want a quick overview of market direction, momentum, and volatility across key instruments, helping you stay aligned with the broader trend.


PMO + Daily SMA(55)PMO + Daily SMA(55)
This script plots the Price Momentum Oscillator (PMO) using the classic DecisionPoint methodology, along with its signal line and the 55-period Simple Moving Average (SMA) of the daily PMO.
PMO is a smoothed momentum indicator that measures the rate of change and helps identify trend direction and strength. The signal line is an EMA of the PMO, commonly used for crossover signals.
The 55-period SMA of the daily PMO is added as a longer-term trend filter. It remains based on daily data, even when applied to intraday charts, making it useful for aligning lower timeframe trades with higher timeframe momentum.
Ideal for swing and position traders looking to combine short-term momentum with broader trend context.

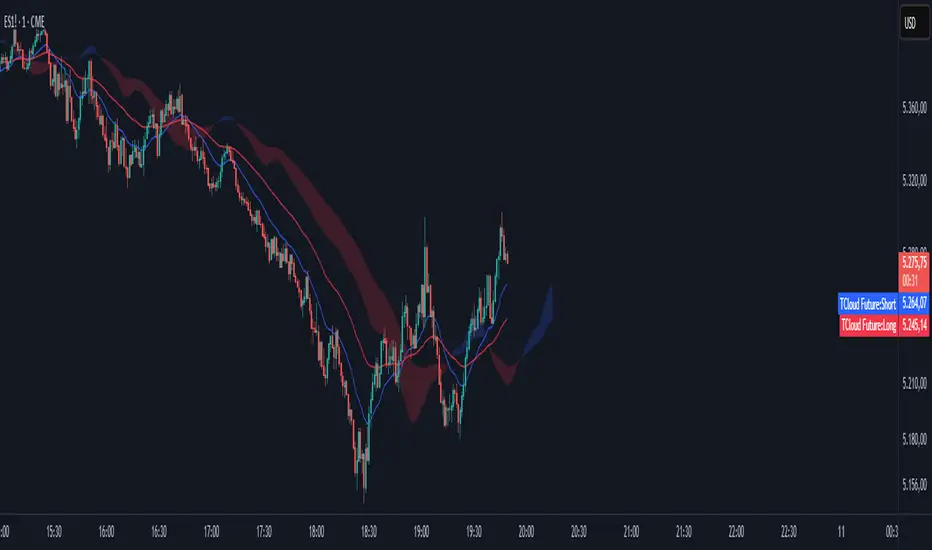
TCloud Future📘 Tcloud Future – Indicator Description & How to Use
Tcloud Future is a trend-based indicator that creates a forward-projected cloud between:
A customizable Exponential Moving Average (EMA)
A dynamic McGinley Moving Average
The cloud is shifted into the future (like the Ichimoku Cloud), giving traders a visual projection of potential trend direction.
🔧 Components:
EMA (default: 19-period) – fast-reacting average to short-term price action
McGinley Dynamic (default: 26-period) – smoother, adaptive average that reacts to volatility
Forward Projection (default: 26 candles) – pushes the cloud into the future to help anticipate trend continuation or reversal
Cloud Color
Green when EMA is above McGinley (bullish bias)
Red when EMA is below McGinley (bearish bias)
🟢 How to Trade with Tcloud Future
✅ Trend Confirmation
Use the cloud color and slope to confirm the current trend.
Green cloud sloping up → bullish momentum
Red cloud sloping down → bearish momentum
🟩 Entry Strategy (Trend-Following)
Go long when price is above the green cloud and the cloud is rising.
Go short when price is below the red cloud and the cloud is falling.
🔁 Cloud Crossovers (Trend Shift)
A color change in the projected cloud can signal a potential trend reversal.
Use this as a heads-up to prepare for position changes or tighten stops.
🛡️ Support/Resistance Zones
The cloud often acts as a dynamic support/resistance zone.
During an uptrend, pullbacks to the top or middle of the green cloud can be good entries.
During a downtrend, rallies into the red cloud can offer shorting opportunities.
🧠 Tips
Combine with RSI, MACD, or Volume for confirmation.
Avoid using it alone in sideways markets — it performs best in trending conditions.
Adjust projection and smoothing settings to fit the asset/timeframe you're trading.
Psychological Levels 25 Gold [UkutaLabs]This indicator is specifically designed to display key psychological levels for Gold (XAUUSD) trading, focusing on increments of $25. It automatically plots major and minor levels, providing traders with clear visual cues for potential support and resistance areas.
Key Features:
25 Dollar Increments: Draws lines at every $25 increment, highlighting significant price levels for Gold.
Major & Minor Levels: Distinguishes between major ($25 increments) and minor (mid-point) levels with customizable colors and styles.
Nearest Century Line: Displays the nearest 25 dollar increment to the current price with a distinct color.
Customizable Appearance: Allows users to adjust line colors, styles (dashed, dotted, solid), and widths to suit their preferences.
Number of Lines: Allows users to set the number of psychological lines to be displayed above and below the current price.
Clear Visuals: Provides clean and easily interpretable lines on the chart.
How to Use:
Add the indicator to your Gold (XAUUSD) chart.
Observe the plotted lines for potential support and resistance areas.
Customize the line colors and styles in the indicator's settings to match your chart theme.
Use these levels in conjunction with other technical analysis tools for informed trading decisions.
Disclaimer:
This indicator is for informational purposes only and should not be considered financial advice. Trading involves risks, and past performance is not indicative of future results. 1 2 Always conduct thorough research and consult with a qualified financial 3 advisor before making any trading decisions.

Psychological Levels 25 Gold [UkutaLabs]Here's a description you can use when publishing your "Psychological Levels 25 Gold " indicator on TradingView:
Title: Psychological Levels 25 Gold
Description:
"This indicator is specifically designed to display key psychological levels for Gold (XAUUSD) trading, focusing on increments of $25. It automatically plots major and minor levels, providing traders with clear visual cues for potential support and resistance areas.
Key Features:
25 Dollar Increments: Draws lines at every $25 increment, highlighting significant price levels for Gold.
Major & Minor Levels: Distinguishes between major ($25 increments) and minor (mid-point) levels with customizable colors and styles.
Nearest Century Line: Displays the nearest 25 dollar increment to the current price with a distinct color.
Customizable Appearance: Allows users to adjust line colors, styles (dashed, dotted, solid), and widths to suit their preferences.
Number of Lines: Allows users to set the number of psychological lines to be displayed above and below the current price.
Clear Visuals: Provides clean and easily interpretable lines on the chart.
How to Use:
Add the indicator to your Gold (XAUUSD) chart.
Observe the plotted lines for potential support and resistance areas.
Customize the line colors and styles in the indicator's settings to match your chart theme.
Use these levels in conjunction with other technical analysis tools for informed trading decisions.
Disclaimer:
This indicator is for informational purposes only and should not be considered financial advice. Trading involves risks, and past performance is not indicative of future results. Always conduct thorough research and consult with a qualified financial advisor before making any trading decisions.

5ADR @nothingveryrealThis script calculates the average daily range for the last 5 complete days (excluding today) and displays it as on‑chart text. It lets you switch between showing the value as a raw price difference or as pips/points, with an editable pip conversion factor (for example, 10000 for most pairs or 100 for JPY pairs).

MACD - salThis indicator chooses a 15-minute frame if the person chose 30 minutes with the SAR indicator, and if he chose 15 minutes, it takes 5 minutes.


Order Flow Hawkes Process [ScorsoneEnterprises]This indicator is an implementation of the Hawkes Process. This tool is designed to show the excitability of the different sides of volume, it is an estimation of bid and ask size per bar. The code for the volume delta is from www.tradingview.com
Here’s a link to a more sophisticated research article about Hawkes Process than this post arxiv.org
This tool is designed to show how excitable the different sides are. Excitability refers to how likely that side is to get more activity. Alan Hawkes made Hawkes Process for seismology. A big earthquake happens, lots of little ones follow until it returns to normal. Same for financial markets, big orders come in, causing a lot of little orders to come. Alpha, Beta, and Lambda parameters are estimated by minimizing a negative log likelihood function.
How it works
There are a few components to this script, so we’ll go into the equation and then the other functions used in this script.
hawkes_process(params, events, lkb) =>
alpha = clamp(array.get(params, 0), 0.01, 1.0)
beta = clamp(array.get(params, 1), 0.1, 10.0)
lambda_0 = clamp(array.get(params, 2), 0.01, 0.3)
intensity = array.new_float(lkb, 0.0)
events_array = array.new_float(lkb, 0.0)
for i = 0 to lkb - 1
array.set(events_array, i, array.get(events, i))
for i = 0 to lkb - 1
sum_decay = 0.0
current_event = array.get(events_array, i)
for j = 0 to i - 1
time_diff = i - j
past_event = array.get(events_array, j)
decay = math.exp(-beta * time_diff)
past_event_val = na(past_event) ? 0 : past_event
sum_decay := sum_decay + (past_event_val * decay)
array.set(intensity, i, lambda_0 + alpha * sum_decay)
intensity
The parameters alpha, beta, and lambda all represent a different real thing.
Alpha (α):
Definition: Alpha represents the excitation factor or the magnitude of the influence that past events have on the future intensity of the process. In simpler terms, it measures how much each event "excites" or triggers additional events. It is constrained between 0.01 and 1.0 (e.g., clamp(array.get(params, 0), 0.01, 1.0)). A higher alpha means past events have a stronger influence on increasing the intensity (likelihood) of future events. Initial value is set to 0.1 in init_params. In the hawkes_process function, alpha scales the contribution of past events to the current intensity via the term alpha * sum_decay.
Beta (β):
Definition: Beta controls the rate of exponential decay of the influence of past events over time. It determines how quickly the effect of a past event fades away. It is constrained between 0.1 and 10.0 (e.g., clamp(array.get(params, 1), 0.1, 10.0)). A higher beta means the influence of past events decays faster, while a lower beta means the influence lingers longer. Initial value is set to 0.1 in init_params. In the hawkes_process function, beta appears in the decay term math.exp(-beta * time_diff), which reduces the impact of past events as the time difference (time_diff) increases.
Lambda_0 (λ₀):
Definition: Lambda_0 is the baseline intensity of the process, representing the rate at which events occur in the absence of any excitation from past events. It’s the "background" rate of the process. It is constrained between 0.01 and 0.3 .A higher lambda_0 means a higher natural frequency of events, even without the influence of past events. Initial value is set to 0.1 in init_params. In the hawkes_process function, lambda_0 sets the minimum intensity level, to which the excitation term (alpha * sum_decay) is added: lambda_0 + alpha * sum_decay
Alpha (α): Strength of event excitation (how much past events boost future events).
Beta (β): Rate of decay of past event influence (how fast the effect fades).
Lambda_0 (λ₀): Baseline event rate (background intensity without excitation).
Other parts of the script.
Clamp
The clamping function is a simple way to make sure parameters don’t grow or shrink too much.
ObjectiveFunction
This function defines the objective function (negative log-likelihood) to minimize during parameter optimization.It returns a float representing the negative log-likelihood (to be minimized).
How It Works:
Calls hawkes_process to compute the intensity array based on current parameters.Iterates over the lookback period:lambda_t: Intensity at time i.event: Event magnitude at time i.Handles na values by replacing them with 0.Computes log-likelihood: event_clean * math.log(math.max(lambda_t_clean, 0.001)) - lambda_t_clean.Ensures lambda_t_clean is at least 0.001 to avoid log(0).Accumulates into log_likelihood.Returns -log_likelihood (negative because the goal is to minimize, not maximize).
It is used in the optimization process to evaluate how well the parameters fit the observed event data.
Finite Difference Gradient:
This function calculates the gradient of the objective function we spoke about. The gradient is like a directional derivative. Which is like the direction of the rate of change. Which is like the direction of the slope of a hill, we can go up or down a hill. It nudges around the parameter, and calculates the derivative of the parameter. The array of these nudged around parameters is what is returned after they are optimized.
Minimize:
This is the function that actually has the loop and calls the Finite Difference Gradient each time. Here is where the minimizing happens, how we go down the hill. If we are below a tolerance, we are at the bottom of the hill.
Applied
After an initial guess the parameters are optimized with a mix of bid and ask levels to prevent some over-fitting for each side while keeping some efficiency. We initialize two different arrays to store the bid and ask sizes. After we optimize the parameters we clamp them for the calculations. We then get the array of intensities from the Hawkes Process of bid and ask and plot them both. When the bids are greater than the ask it represents a bullish scenario where there are likely to be more buy than sell orders, pushing up price.
Tool examples:
The idea is that when the bid side is more excitable it is more likely to see a bullish reaction, when the ask is we see a bearish reaction.
We see that there are a lot of crossovers, and I picked two specific spots. The idea of this isn’t to spot crossovers but avoid chop. The values are either close together or far apart. When they are far, it is a classification for us to look for our own opportunities in, when they are close, it signals the market can’t pick a direction just yet.
The value works just as well on a higher timeframe as on a lower one. Hawkes Process is an estimate, so there is a leading value aspect of it.
The value works on equities as well, here is NASDAQ:TSLA on a lower time frame with a lookback of 5.
Inputs
Users can enter the lookback value and timeframe.
No tool is perfect, the Hawkes Process value is also not perfect and should not be followed blindly. It is good to use any tool along with discretion and price action.
EMA 5/10/25/50/75/200Easy EMA you can use with any stock or crypto whatever
so now can I public this? lol

Donchian Channel Trend Meter [Custom TF]DC TREND METER WITH CUSTOM TF
Check trend patterns in combi with other confleunces w/m formation above 50 ma 1 hr
BUY trend breaks and pay attention to 50 line
1 minute works good already

[4LC] Period Highs, Lows and OpensPeriod Highs, Lows, and Opens (HLO)
This script plots highs, lows, and opens from different time periods—yearly, monthly, weekly, Monday, and daily—on your chart. It includes a grouping feature that combines levels close to each other, based on a percentage distance, to keep the display organized.
What It Does:
It shows key price levels from various timeframes, marking where the market has hit highs, lows, or started a period. These levels can indicate potential support or resistance zones and help track price behavior over time.
How to Use It:
Add it to your chart and choose which levels to display (e.g., "Yearly High," "Daily Open").
Check where price is relative to these levels—above might suggest upward momentum, below could point to downward pressure.
Use the highs and lows to identify ranges for trading or watch for breakouts past these points.
Adjust settings like colors, spacing, or grouping distance as needed, and toggle price labels to see exact values.
Notes:
The script pulls data from multiple periods to give a broader view of price action. The grouping reduces overlap by averaging nearby levels into a single line with a combined label (e.g., "Yearly High, Monthly High"). It’s meant for traders interested in tracking significant levels across timeframes, whether for range trading or spotting market direction.

Fibonacci Levels with SMA SignalsThis strategy leverages Fibonacci retracement levels along with the 100-period and 200-period Simple Moving Averages (SMAs) to generate robust entry and exit signals for long-term swing trades, particularly on the daily timeframe. The combination of Fibonacci levels and SMAs provides a powerful way to capitalize on major trend reversals and market retracements, especially in stocks and major crypto assets.
The core of this strategy involves calculating key Fibonacci retracement levels (23.6%, 38.2%, 61.8%, and 78.6%) based on the highest high and lowest low over a 365-day lookback period. These Fibonacci levels act as potential support and resistance zones, indicating areas where price may retrace before continuing its trend. The 100-period SMA and 200-period SMA are used to define the broader market trend, with the strategy favoring uptrend conditions for buying and downtrend conditions for selling.
This indicator highlights high-probability zones for long or short swing setups based on Fibonacci retracements and the broader trend, using the 100 and 200 SMAs.
In addition, this strategy integrates alert conditions to notify the trader when these key conditions are met, providing real-time notifications for optimal entry and exit points. These alerts ensure that the trader does not miss significant trade opportunities.
Key Features:
Fibonacci Retracement Levels: The Fibonacci levels provide natural price zones that traders often watch for potential reversals, making them highly relevant in the context of swing trading.
100 and 200 SMAs: These moving averages help define the overall market trend, ensuring that the strategy operates in line with broader price action.
Buy and Sell Signals: The strategy generates buy signals when the price is above the 200 SMA and retraces to the 61.8% Fibonacci level. Sell signals are triggered when the price is below the 200 SMA and retraces to the 38.2% Fibonacci level.
Alert Conditions: The alert conditions notify traders when the price is at the key Fibonacci levels in the context of an uptrend or downtrend, allowing for efficient monitoring of trade opportunities.
Application:
This strategy is ideal for long-term swing trades in both stocks and major cryptocurrencies (such as BTC and ETH), particularly on the daily timeframe. The daily timeframe allows for capturing broader, more sustained trends, making it suitable for identifying high-quality entries and exits. By using the 100 and 200 SMAs, the strategy filters out noise and focuses on larger, more meaningful trends, which is especially useful for longer-term positions.
This script is optimized for swing traders looking to capitalize on retracements and trends in markets like stocks and crypto. By combining Fibonacci levels with SMAs, the strategy ensures that traders are not only entering at optimal levels but also trading in the direction of the prevailing trend.
RSI Support & Resistance Breakouts with OrderblocksThis tool is an overly simplified method of finding market squeeze and breakout completely based on a dynamic RSI calculation. It is designed to draw out areas of price levels where the market is pushing back against price action leaving behind instances of short term support and resistance levels you otherwise wouldn't see with the common RSI.
It uses the changes in market momentum to determine support and resistance levels in real time while offering price zone where order blocks exist in the short term.
In ranging markets we need to know a couple things.
1. External Zone - It's important to know where the highs and lows were left behind as they hold liquidity. Here you will have later price swings and more false breakouts.
2. Internal Zone - It's important to know where the highest and lowest closing values were so we can see the limitations of that squeeze. Here you will find the stronger cluster of orders often seen as orderblocks.
In this tool I've added a 200 period Smoothed Moving Average as a trend filter which causes the RSI calculation to change dynamically.
Regular Zones - without extending
The Zones draw out automatically but are often too small to work with.
To solve this problem, you can extend the zones into the future up to 40 bars.
This allows for more visibility against future price action.
--------------------------------------------
Two Types of Zones
External Zones - These zones give you positioning of the highest and lowest price traded within the ranging market. This is where liquidity will be swept and often is an ultimate breaking point for new price swings.
How to use them :
External Zones - External zones form at the top of a pullback. After this price should move back into its impulsive wave.
During the next corrective way, if price breaches the top of the previous External Zone, this is a sign of trend weakness. Expect a divergence and trend reversal.
Internal Zones - (OrderBlocks) Current price will move in relation to previous internal zones. The internal zone is where a majority of price action and trading took place. It's a stronger SQUEEZE area. Current price action will often have a hard time closing beyond the previous Internal Zones high or low. You can expect these zones to show you where the market will flip over. In these same internal zones you'll find large rejection candles.
**Important Note** Size Doesn't Matter
The size of the internal zone does not matter. It can be very small and still very powerful.
Once an internal zone has been hit a few times, its often not relevant any longer.
Order Block Zone Examples
In this image you can see the Internal Zone that was untouched had a STRONG price reaction later on.
Internal Zones that were touched multiple times had weak reactions later as price respected them less over time.
Zone Overlay Breakdown
The Zones form and update in real time until momentum has picked up and price begins to trend. However it leaves behind the elements of the inducement area and all the key levels you need to know about for future price action.
Resistance Fakeout : Later on after the zone has formed, price will return to this upper zone of price levels and cause fakeouts. A close above this zone implies the market moves long again.
Midline Equilibrium : This is simply the center of the strongest traded area. We can call this the Point of Control within the orderblock. If price expands through both extremes of this zone multiple times in the future, it eliminates the orderblock.
Support Fakeout : Just like its opposing brother, price will wick through this zone and rip back causing inducement to trap traders. You would need a clear close below this zone to be in a bearish trend.
BARCOLOR or Candle Color: (Optional)
Bars are colored under three conditions
Bullish Color = A confirmed bullish breakout of the range.
Bearish Color = A confirmed bearish breakout of the range.
Squeeze Color = Even if no box is formed a candle or candles can have a squeeze color. This means the ranging market happened within the high and low of that singular candle.

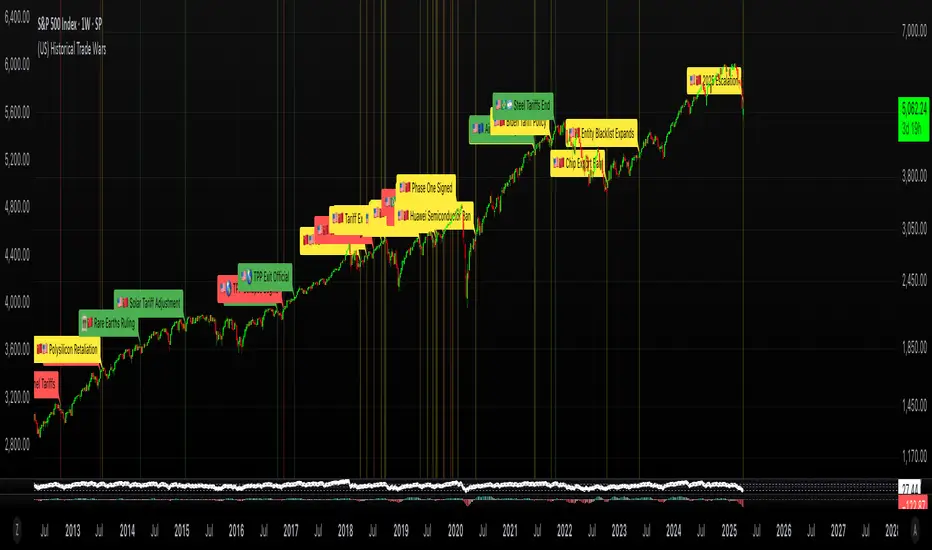
(US) Historical Trade WarsHistorical U.S. Trade Wars Indicator
Overview
This indicator visualizes major U.S. trade wars and disputes throughout modern economic history, from the McKinley Tariff of 1890 to recent U.S.-China tensions. This U.S.-focused timeline is perfect for macro traders, economic historians, and anyone looking to understand how America's trade conflicts correlate with market movements.
Features
Comprehensive U.S. Timeline: Covers 130+ years of U.S.-centered trade disputes with historically accurate dates.
Color-Coded Events:
🔴 Red: Marks the beginning of a U.S. trade war or major dispute.
🟡 Yellow: Highlights significant events within a trade conflict.
🟢 Green: Shows resolutions or ends of trade disputes.
Global Partners/Rivals: Tracks U.S. trade relations with China, Japan, EU, Canada, Mexico, Brazil, Argentina, and others.
Country Flags: Uses emoji flags for easy visual identification of nations in trade relations with the U.S.
Major Trade Wars Covered:
McKinley Tariff (1890-1894)
Smoot-Hawley Tariff Act (1930-1934)
U.S.-Europe Chicken War (1962-1974)
Multifiber Arrangement Quotas (1974-2005)
Japan-U.S. Trade Disputes (1981-1989)
NAFTA and Softwood Lumber Disputes
Clinton and Bush-Era Steel Tariffs
Obama-Era China Tire Tariffs
Rare Earth Minerals Dispute (2012-2014)
Solar Panel Dispute (2012-2015)
TPP and TTIP Negotiations
U.S.-China Trade War (2018-present)
Airbus-Boeing Dispute
Usage
Analyze how markets historically responded to trade war initiations and resolutions.
Identify patterns in market behavior during periods of trade tensions.
Use as an overlay with price action to examine correlations.
Perfect companion for macro analysis on daily, weekly, or monthly charts.
About
This indicator is designed as a historical reference tool for traders and economic analysts focusing on U.S. trade policy and its global impact. The dates and events have been thoroughly researched for accuracy. Each label includes emojis to indicate the U.S. and its trade partners/rivals, making it easy to track America's evolving trade relationships across time.
Note: This indicator works best on larger timeframes (daily, weekly, monthly) due to the historical span covered.
Pullback Long Screener - Bougie Verte 4h
This script is designed to be used within a Pullback Long Screener on TradingView.
It identifies cryptocurrencies currently displaying a green 4-hour candle (i.e., when the close is higher than the open).
The goal is to quickly detect assets in a potential bullish move, which is particularly useful for scalping.
This script is configured to work exclusively on cryptocurrencies listed on Binance as perpetual futures contracts.
The green circles displayed below the candles indicate a valid green 4-hour candle condition.

OPR 14h30-14h45 amélioré avec options avancées + MA200OPR 14h30-14h45 amélioré avec options avancées + MA200

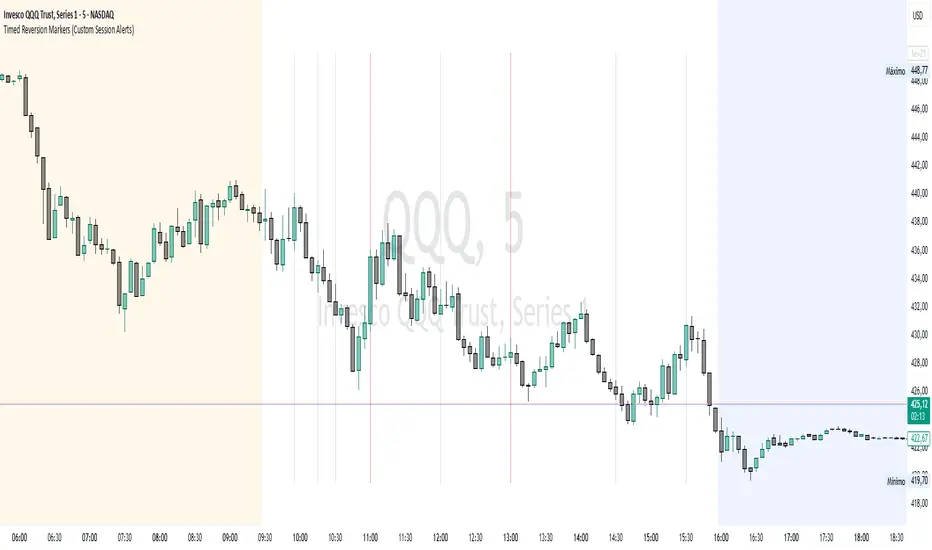
Timed Reversion Markers (Custom Session Alerts)This script plots vertical histogram markers at specific intraday time points defined by the user. It is designed for traders who follow time-based reversion or breakout setups tied to predictable market behavior at key clock times, such as institutional opening moves, midday reversals, or end-of-day volatility.
Unlike traditional price-action indicators, this tool focuses purely on time-based triggers, a technique often used in time cycle analysis, market internals, and volume-timing strategies.
The indicator includes eight fully customizable time inputs, allowing users to mark any intraday minute with precision using a decimal hour format (for example, 9.55 for 9:55 AM). Each input is automatically converted into hour and minute format, and a visual histogram marker is plotted once per day at that exact time.
Example use cases:
Mark institutional session opens (e.g., 9:30, 10:00, 15:30)
Time-based mean reversion or volatility windows
Backtest recurring time-based reactions
Highlight algorithmic spike zones
The vertical plots serve as non-intrusive, high-contrast visual markers for scalping setups, session analysis, and decision-making checkpoints. All markers are displayed at the top of the chart without interfering with price candles.
ADR Actual en RecuadroADR data in a separate box. Shows a visualization of the average "market limit".

Buy and Sell Signal xNawaf (SMA)
"A new indicator, customizable for future adjustments. Thank you all!"
xNawaf
Nawaf aLOtaibi
thank you all
