Sessions [TradingFinder] New York, London, Tokyo & Sydney ForexTiming is one of the influential factors in a trader's position. This indicator categorizes transactions into three sessions (Asia, Europe, and America). Five significant trading cities (New York, London, Frankfurt, Tokyo, and Sydney) are selectable.
I recommend using the tool on a 5-minute time frame, but it is usable on all time frames.
Settings:
• Trading sessions: Display or hide each trading session as needed.
• Color: Change the color of each box.
• Session time intervals: The default is based on the main working hours for each time interval and can be adjusted.
• Information table: Delete or display additional information table.
Information Table:
• Trading sessions
• Opening and closing times of each trading session
How to Use:
Initiating trading sessions involves entering with increased liquidity, and the market usually experiences significant movements. Many trading strategies are based on "time" and "session openings." This tool empowers traders to focus intensely on each time interval.
These trading sessions are crucial for all Forex, stock, and index traders:
The total price ceiling and floor in the Asia session (Tokyo and Sydney) are crucial for traders in the European session.
The European session starts with Frankfurt, and an hour later, London begins, collectively forming the European session.
The dashboard provides additional information, displaying hours based on UTC.
Customization options are considered in all sections so that everyone can apply their own settings.
Important: Default times are the most accurate for each region, and in most indicators, this time is not correctly selected. Therefore, the level of influence and time intervals are specified at the beginning of each session. If you are using another indicator, match its default time to the announced time and share the results with me in the comments.
Educational

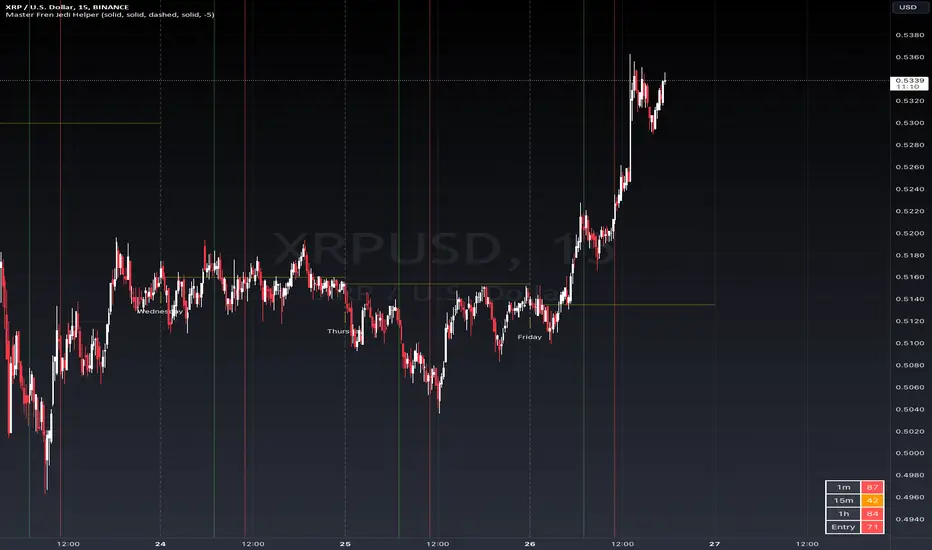
Master Fren Jedi HelperDescription:
The "Master Fren Jedi Helper" is a TradingView indicator designed to enhance trading analysis by plotting distinct lines at crucial times of the trading day.
This indicator is an invaluable tool for traders who focus on intraday price movements and patterns around specific times. Its primary features include:
Customizable Time Markers: The script allows users to mark specific times of the day with lines of different colors and styles. These times are adjustable based on the user's timezone and preferences.
Configurable Line Properties: Users can customize the color and style of each line. The script offers options for a green line at 7 AM, a red line at 11 AM, a grey line at midnight, and a yelow line to denote the daily open.
Time Zone Adjustment: To work with New York time zone, you have ability to adjust for different time zones. Users can input their time zone offset, advised to use UTC -5 allowing the script to plot the lines accurately according to their local time.
Day Labels: The indicator also labels each day of the week at midnight, providing a clear and easy way to track the days on the chart.
Functionality Overview:
Green Line at 7 AM: This line helps identify the early morning market sentiment. Users can customize the color and style of this line.
Red Line at 11 AM: Plotted to highlight mid-morning price levels, this line is also customizable in color and style.
Grey Line at Midnight: Marks the start of a new trading day. The line style and color can be personalized.
Yellow Line for Daily Open: Indicates the opening price of the day. The line's color and style are adjustable.
Time Zone Configuration: Users can set their local time zone to ensure the lines correspond accurately with their specific market hours.
Day of the Week Labels: Each midnight is labeled with the day of the week, aiding in the weekly analysis of price patterns.
This indicator is perfect for traders who need to quickly identify key times and price levels each day. It's easily configurable to suit various trading strategies and assists in enhancing the visual representation of intraday market dynamics.
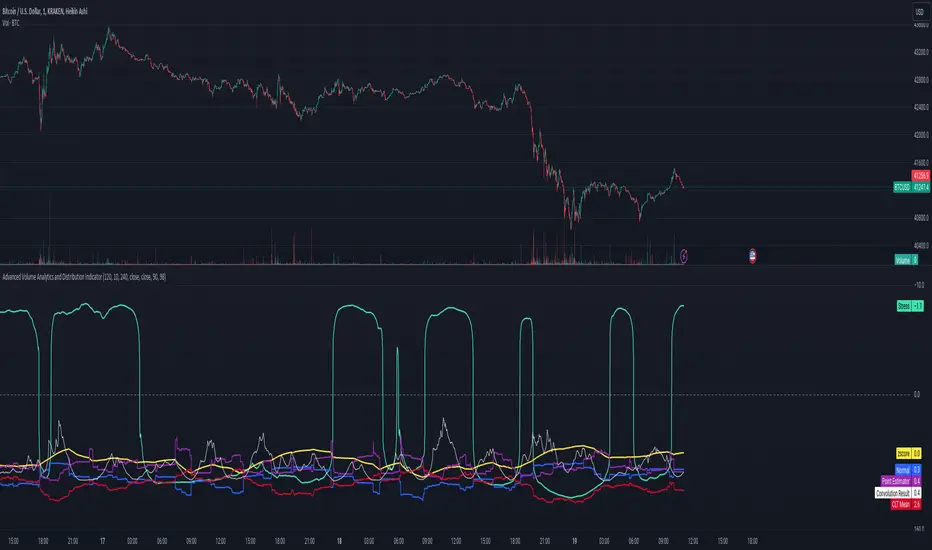
Advanced Volume Analytics and Distribution IndicatorThe Advanced Volume Analytics and Distribution Indicator is a sophisticated tool designed for financial analysts and traders who seek in-depth insights into market volume dynamics. This Pine Script-based indicator is a comprehensive solution, offering a rich set of features that analyze volume data using various statistical methods and theories. It's tailored for those who require a deeper understanding of market movements and volume distribution.
Key Features:
Volume Distribution Analysis: Utilizes standard deviation and mean calculations to analyze the distribution of trading volume. Employs z-scores to measure the standard deviations of volume from its mean, offering insights into volume anomalies.
Bell Curve Modeling: Constructs a bell curve (normal distribution) based on volume data, enabling users to visualize and assess the distribution of volume in a standard statistical format.
Provides a z-score based bell curve, offering a normalized view of volume deviations.
Exponential Smoothing: Applies exponential smoothing to volume data, giving more weight to recent observations. This feature is crucial for analyzing trending behaviors in volume data.
Stress Metric Calculation: Introduces a unique 'stress' metric, calculated using a custom formula. This metric is designed to evaluate the volatility or variability in the volume data over a specified period.
Central Limit Theorem (CLT) Mean Estimation: Implements CLT for estimating the mean of volume data. The CLT states that the distribution of sample means approximates a normal distribution as the sample size becomes larger.
Variance Point Estimation: Calculates the variance of volume data, providing insights into its variability and consistency over time.
Chi-Squared Test (Commented): Although not active in the initial release, the script includes a framework for a Chi-Squared Test to compare observed and expected volume frequencies, offering potential for future statistical comparisons.
Percentile Calculations and Convolution: Performs percentile calculations on volume data and employs convolution to these percentiles, enabling a more nuanced analysis of volume distribution.
Customizability: Users can input various parameters like anchor period, degrees of freedom, and smoothing preferences, making the tool adaptable to different analysis needs.
Visualization and Plotting: Features multiple plots for easy visualization of volume metrics, including stress, bell curves, point estimators, and smoothed data.
Theoretical Foundations:
This indicator is grounded in established statistical theories and methods, including the Central Limit Theorem, Chi-Squared Test (for future implementations), and convolution techniques. These foundations ensure that the indicator not only provides practical insights but also maintains a high standard of statistical rigor.
Intended Users:
This indicator is ideal for technical analysts, traders, and financial professionals who require a deep and statistically sound understanding of market volume behavior.
Release Notes:
This tool is designed a theoretical test of established statistical models and requires familiarity with Pine Script for customization. Future updates may include activation and expansion of the Chi-Squared Test functionality and additional statistical modules based on user feedback. It should be noted that it is advisable to use a logarithmic-inverted scale; when combined, these scales can provide a unique perspective that neither could offer alone. This combination might be particularly useful in highlighting exponential growth or decay trends, or in cases where the most significant data points are in the lower range of the dataset.
Notes of Stress Calculations:
The "stress metric" in the script is a custom-designed feature intended to measure the level of variability or volatility in the volume data over a given time period. This metric is calculated using a novel approach with concepts similar to those used in the field of engineering , particularly in stress analysis and finite element analysis (FEA).
Segmentation of Time Frame:
The script divides the given time frame (timeFrame) into smaller segments based on a specified number of units (units). This segmentation essentially breaks down the entire period into smaller, more manageable intervals for analysis. For each segment, the script calculates a 'stress' value. This involves iterating through each segment and performing calculations based on the source data (src), the default src is the volume data.
Calculation per Segment:
For each segment, the script identifies two points: the starting point (x1) and the ending point (x2). It then retrieves the corresponding values of the source data at these points (y1 and y2).
It calculates the difference in the x-axis (delta_x, the length of the segment) and the difference in the y-axis (delta_y, the change in volume over that segment).
Stress Calculation:
The script then calculates the 'stress' for each segment as the ratio of delta_y to delta_x. This ratio gives a measure of how much the volume has changed per unit of time within each segment. The stress values for each segment are then summed up to provide a cumulative measure of stress over the entire time frame.
The stress metric is essentially a measure of the volatility or variability in volume data. High stress values indicate larger changes in volume over shorter periods, suggesting more volatile market conditions. For traders and analysts, understanding the level of volatility is crucial. It can inform decision-making processes, risk management strategies, and provide insights into market sentiment. By comparing stress levels across different time frames or different securities, analysts can gain insights into relative market dynamics.
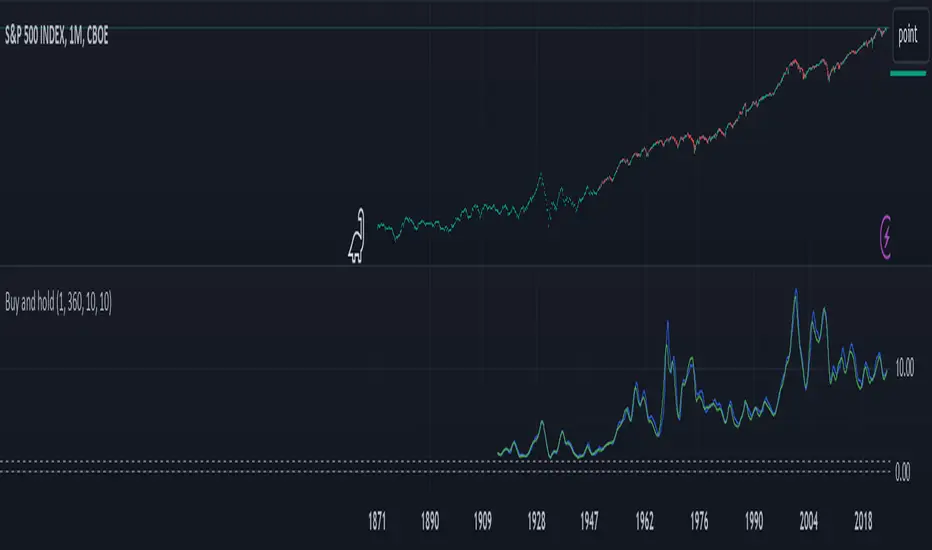
Buy and hold visualiserThis indicator shows the historical performance of a buy and hold portfolio. The purpose of the indicator is to show
1. the effect of the hold time (time between buying and selling a number of instruments) and
2. the effect of investing all capital at once (lump sum) versus dividing the investment over a number of months or years (cost averaging).
The indicator shows four lines:
- a dotted line at 0 (dollar or any other currency),
- a dotted line at the level of initial investment,
- a blue line that shows the amount of capital after selling at the end of the investment period after a lump sum investment,
- a green line that shows the amount of capital after selling at the end of the investment period after an investment that was done in chunks (cost averaging)
When 'chunks' is set to 1, the green line will match the blue line.
When 'investment' is set to 1, the blue and green lines will show the factor by which the initial investment was multiplied at the end of the investment period.
The effect of the hold time can be easily seen in the following example: Choose SPX (CBOE) as the active instrument, set 'chunks' to 1 and 'months' to 12. Depending on when you bought your portfolio, selling it a year later is like tossing a coin. Set 'months' to 360 and it becomes clear that it doesn't matter when you buy, the value of your portfolio will likely multiply considerably in 30 years, even if you bought everything all at once just before a bear market. It shows that with a long time horizon, you don't have to worry about timing the market.
Continue the example above and set 'chunks' to 12, thus spreading the initial investment over 12 months. The green line shows the cost averaging performance. The blue lump sum line is above the green line most of the time. Increase the chunks to 60 and the difference increases.
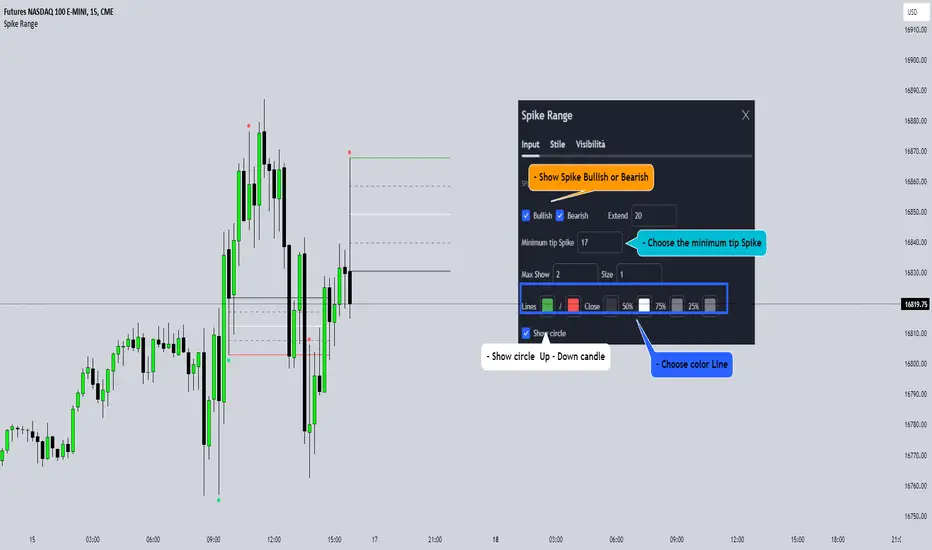
Spike RangeGuided by new ICT tutoring, I create this versatile Spike Range
This indicator shows a different way on how to display "Spikes or Shadows" based on their size,
the indicator divides the "Spike or Shadows" into levels 0.5 - 0.75 - 0.25 Fibonacci, giving the possibility of viewing the "Spike or Shadows" with a certain size and being able to use them as continuation or reversal zones
The user has the possibility to:
- Choose the size of the "Spike or Shadows"
- Choose to view "Spike or Shadows" levels
- Choose to show only bullish or only bearish "Spike or Shadows" levels
The indicator should be used as ICT shows in its concepts.
The indicator takes into account the "Spades or Shadows" that have a certain size (based on the minimum range set)
These Spikes can be rated as "FVG" so you can expect reactions on the levels it marks, considering a reversal or continuation based on the range being respected
If the Spike is Bullish and the Price closes by invalidating 50% of the range we can evaluate a possible entry up to the High of the Spike
Below is an example of how to use them:
Invalidades Range
Respect Range
Modern Portfolio TheoryModern Portfolio Theory
The indicator is designed to apply the principles of Modern Portfolio Theory, a financial theory developed by Harry Markowitz. MPT aims to maximize portfolio returns for a given level of risk by diversifying investments.
User Inputs:
Users can customize various parameters, including the bar scale, risk-free rate, and the start year for the portfolio. Additionally, users can assign weights to different assets (symbols) in the portfolio.
Asset Selection:
Users can choose up to 10 different symbols (assets) for the portfolio. The script supports a variety of symbols, including cryptocurrencies such as BTCUSD and ETHUSD.
Weights and Allocation:
Users can assign weights to each selected asset, determining its percentage allocation in the portfolio. The script calculates the total portfolio weight to ensure it equals 100%. If total portfolio weight is lower then 100% you will see orange color with additional cash % bellow
If total portfolio weight is bigger then 100% you will see red big % warning.
Warning: (Total Weight must be 100%)
Cash Mode:
Risk and Return Calculation:
The script calculates the daily returns and standard deviation for each selected asset. These metrics are essential for assessing the risk and return of each asset, as well as the overall portfolio.
Scatter Plot Visualization:
The indicator includes a scatter plot that visualizes the risk-return profile of each asset. Each point on the plot represents an asset, and its position is determined by its risk (X-axis) and return (Y-axis).
Portfolio Optimization:
The script calculates the risk and return of the overall portfolio based on the selected assets and their weights. Based on the selected assets and their weights user can create optimal portfolio with preferable risk and return.
It then plots the portfolio point on the scatter plot, indicating its risk-return profile.
Additional Information:
The indicator provides a table displaying information about each selected asset, including its symbol, weight, and total portfolio weight. The table also shows the total portfolio weight and, if applicable, the percentage allocated to cash.
Visualization and Legend:
The script includes visual elements such as a legend, capital allocation line (CAL), and labels for risk-free rate and key information. This enhances the overall understanding of the portfolio's risk and return characteristics.
User Guidance:
The script provides informative labels and comments to guide users through the interpretation of the scatter plot, risk-return axes, and other key elements.
Interactivity:
Users can interact with the indicator on the TradingView platform, exploring different asset combinations and weightings to observe the resulting changes in the portfolio's risk and return.
In summary, this Pine Script serves as a comprehensive tool for traders and investors interested in applying Modern Portfolio Theory principles to optimize their portfolio allocations based on individual asset characteristics, risk preferences, and return

itradesize /\ Silver Bullet x Macro x KillzoneThis indicator shows the best way to annotate ICT Killzones, Silver Bullet and Macro times on the chart. With the help of a new pane, it will not distract your chart and will not cause any distractions to your eye, or brain but you can see when will they happen.
The indicator also draws everything beforehand when a proper new day starts.
You can customize them how you want to show up.
Collapsed or full view?
You can hide any of them and keep only the ones you would like to.
All the colors can be customized, texts & sizes or just use shortened texts and you are also able to hide those drawings which are older than the actual day.
You should minimize the pane where the script has been automatically drawn to therefore you will have the best experience and not show any distractions.
The script automatically shows the time-based boxes, based on the New York timezone.
Killzone Time windows ( for indices ):
London KZ 02:00 - 05:00
New York AM KZ 07:00 - 10:00
New York PM KZ 13:30 - 16:00
Silver Bullet times:
03:00 - 04:00
10:00 - 11:00
14:00 - 15:00
Macro times:
02:33 - 03:00
04:03 - 04:30
08:50 - 0910
09:50 - 10:10
10:50 - 11:10
11:50 - 12:50

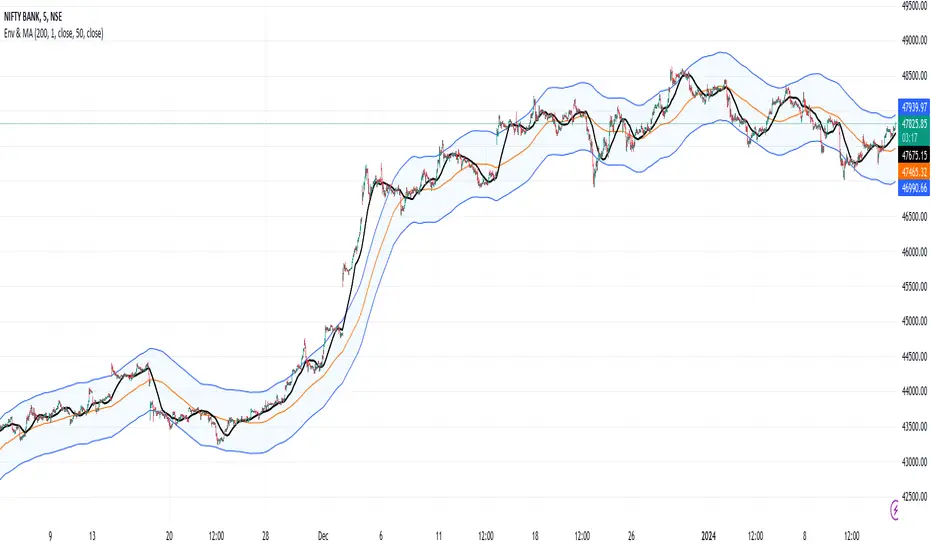
Envelope and Moving Average**Description:**
- This script creates an indicator that combines an envelope and a simple moving average (MA).
- The envelope is constructed using a specified length, percentage deviation, and source price (close by default).
- The moving average is calculated based on a specified length and source price.
**Inputs:**
1. Envelope:
- Length: Number of periods used for the envelope calculation (default is 20).
- Percentage Deviation: Percentage above and below the envelope basis (default is 10%).
- Source: The price used for the envelope calculation (default is close).
- Exponential MA: Option to use exponential moving average for the envelope basis (default is false).
2. Moving Average:
- Length: Number of periods used for the moving average calculation (default is 20).
- Source: The price used for the moving average calculation (default is close).
**Plotting:**
- The script plots the envelope basis, upper envelope line, and lower envelope line.
- The area between the upper and lower envelope lines is filled with a semi-transparent color for better visualization.
- The moving average is plotted on the chart with a specified color and line width.
**How to Use in a Strategy:**
1. **Envelope Crossovers:**
- Go Long (Buy): When the close price crosses above the upper envelope line.
- Go Short (Sell): When the close price crosses below the lower envelope line.
2. **Moving Average Crossovers:**
- Go Long (Buy): When the close price crosses above the moving average.
- Go Short (Sell): When the close price crosses below the moving average.
3. **Confirmation:**
- Consider additional confirmation signals or filters to improve the robustness of your strategy.
- For example, you might require a certain amount of price momentum or use other technical indicators in conjunction with envelope and moving average signals.
4. **Optimization:**
- Experiment with different parameter values (e.g., envelope length, percentage deviation, moving average length) to optimize the strategy for specific market conditions.
5. **Risk Management:**
- Implement proper risk management techniques, such as setting stop-loss orders and position sizing, to control risk.
Remember to thoroughly backtest any strategy before deploying it in a live trading environment. Additionally, consider the current market conditions and adapt your strategy accordingly.
Leveraged Share Decay Tracker [SS]Releasing this utility tool for leveraged share traders and investors.
It is very difficult to track the amount of decay and efficiency that is associated with leveraged shares and since not all leveraged shares are created equally, I developed this tool to help investors/traders ascertain:
1. The general risk, in $$, per share associated with investing in a particular leveraged ETF
2. The ability of a leveraged share to match what it purports to do (i.e. if it is a 3X Bull share, is it actually returning consistently 3X the underlying or is there a large variance?)
3. The general decay at various timepoints expressed in $$$
How to use:
You need to be opened on the chart of the underlying. In the example above, the chart is on DIA, the leveraged share being tracked is UDOW (3X bull share of the DOW).
Once you are on the chart of the underlying, you then put in the leveraged share of interest. The indicator will perform two major assessments:
1. An analysis of the standard error between the underlying and the leveraged share. This is accomplished through linear regression, but instead of creating a linreg equation, it simply uses the results to ascertain the degree of error associated at various time points (the time points are 10, 20, 30, 40, 50, 100, 252).
2. An analysis of the variance of returns. The indicator requires you to put in the leverage amount. So if the leverage amount is 3% (i.e. SPXL or UPRO is 3 X SPY), be sure that you are putting that factor in the settings. It will then modify the underlying to match the leverage amount, and perform an assessment of variance over 10, 20, 30, 40, 50, 100, 252 days to ensure stability. This will verify whether the leveraged ETF is actually consistently performing how it purports to perform.
Here are some examples, and some tales of caution so you can see, for yourself, how not all leveraged shares are created equal.
SPY and SPXL:
SPY and UPRO:
XBI and LABU (3 x bull share):
XBI and LABD (3 x bear share):
SOX and SOXL:
AAPL and AAPU:
It is VERY pivotal you remember to check and adjust the Leveraged % factor.
For example, AAPU is leveraged 1.5%. You can see above it tracks this well. However, if you accidently leave it at 3%, you will get an erroneous result:
You can also see how some can fail to track the quoted leveraged amount, but still produce relatively lower risk decay.
And, as a final example, let's take a look at the worst leveraged share of life, BOIL:
Trainwreck that one. Stay far away from it!
The chart:
The chart will show you the drift (money value over time) and the variance (% variance between the expected and actual returns) over time. From here, you can ascertain the general length you feel comfortable holding a leveraged share. In general, for most stable shares, <= 50 trading days tends to be the sweet spot, but always check the chart.
There are also options to plot the variances and the drifts so you can see them visually.
And that is the indicator! Kind of boring, but there are absolutely 0 resources out there for doing this job, so hopefully you see the use for it!
Safe trades everyone!

Bias DailyThis indicator shows in a different way how to evaluate the BIAS Daily.
Evaluate yesterday's closed candle and that of the day before yesterday
The conditions are:
LONG BIAS =
Candle closed above High Candle [2 ]
- In this condition a long continuation can be considered
SHORT BIAS =
The candle closed below the low candle [2 ]
- In this condition a short continuation can be considered
IN THE RANGE =
The candle did not close below or above the Low and High candle
- In this condition it is better not to risk it
The user has the possibility to:
- Choose to show high or low BIAS levels
- Shows the Table in which the BIAS D is marked
The indicator should be used as TTrades shows in its videos, it can also be implemented in ICT strategies.
The indicator takes into consideration the last 2 candles already closed, so on the candle that is forming you can expect reactions in the Pd Array of the Candle Range , below I show examples of how to use it in Multitimeframe
BIAS LONG =
BIAS SHORT =

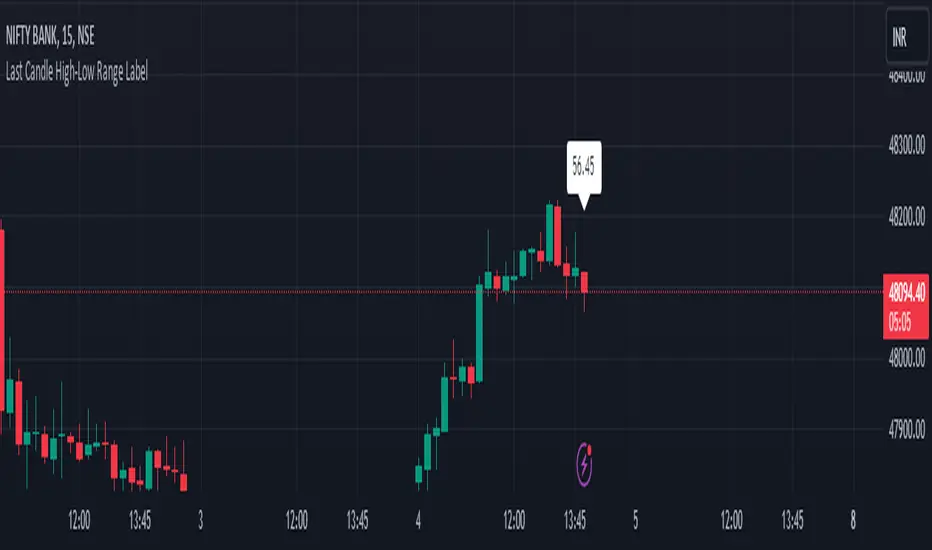
HL range by durgaThe script we've been working on is an indicator designed to display the high-low range of the last candlestick on a TradingView chart. It does so by plotting two lines: one for the high and another for the low of the last completed candlestick.
Additionally, the script includes a label that shows the numerical value of the high-low range. This label is positioned between the plotted lines, showing the difference between the high and low prices of the last candlestick.
The script operates in real-time, updating dynamically as new candlesticks form. Furthermore, it automatically removes the label after the close of the candlestick, maintaining a clean and clutter-free chart.
This indicator can help traders quickly visualize and assess the range of the last completed candlestick, aiding in their analysis of price action.
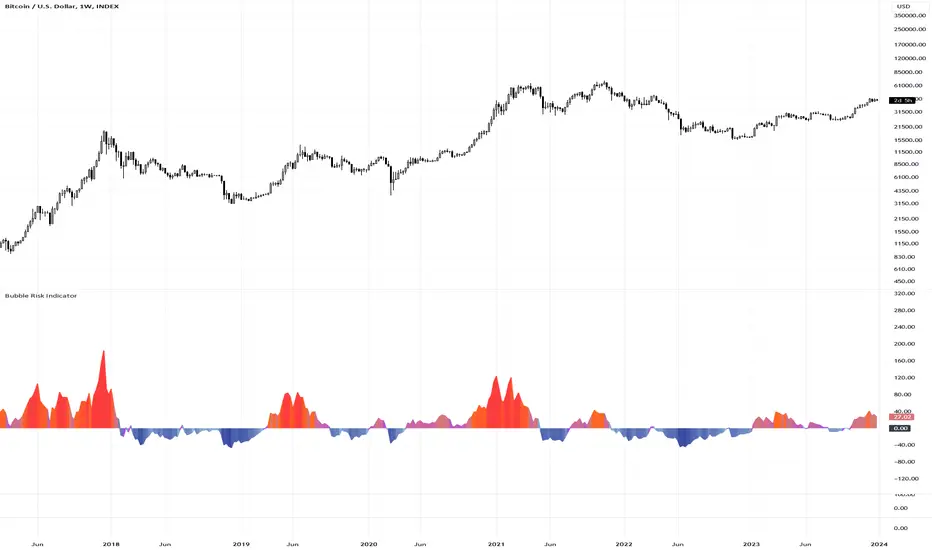
Bubble Risk IndicatorThe Bubble Risk Indicator is a sophisticated tool designed to assess the potential risk level of a trading instrument by measuring its deviation from a 20-week Simple Moving Average (SMA). This dynamic indicator visually represents the deviation with a color-changing line, indicating the degree of risk based on the distance from the SMA.
🔷 Calculation
The indicator calculates the deviation from the 20-week SMA and expresses it as a percentage extension:
20-Week SMA : Averages the closing prices over the past 20 periods, providing a consistent measure of the long-term trend.
Deviation Percentage : Measures the percentage difference between the current closing price and the 20-week SMA.
🔷 Color Coding
The line changes color based on the deviation level to represent different risk levels. Users can customize these colors as per their preferences. However, the following are the default recommended settings:
Extreme Low Risk (Below 0) : Blue
Low Risk (Below 0) : Light Blue
Low Risk (Above 0) : Light Purple
Medium Risk : Orange
High Risk : Red
Colors transition smoothly to reflect the increasing or decreasing risk based on the deviation from the SMA.
🔷 Customization
Users have the flexibility to change the colors representing each risk level through the indicator settings. While the default colors are recommended for a standard view, users comfortable with custom color schemes can adjust according to their preference.
🔷 Usage
This indicator is beneficial for gauging the relative risk associated with current price movements compared to a historical average. It's most effective when used in conjunction with other technical analysis tools and market knowledge.
🔷 Limitations
While the Bubble Risk Indicator provides valuable insights, it should form part of a broader trading strategy. It assesses risk levels based on historical data and does not predict future market directions.
🔷 Conclusion
The Bubble Risk Indicator offers a nuanced and visually intuitive way to understand market risk levels, providing traders with an additional tool for informed decision-making.
🔷 Risk Disclaimer
Trading involves significant risk and is not suitable for every investor. The value of investments can fluctuate. Past performance is not indicative of future results. Always consider your circumstances and seek independent advice before making financial decisions. This indicator is provided for informational purposes only and is not intended as financial advice.
Mean Reversion with Incremental Entry by HedgerLabsThe "Mean Reversion with Incremental Entry" strategy, designed by HedgerLabs, is an advanced TradingView strategy script focusing on the mean reversion technique in financial markets. This strategy is engineered for traders who prefer a systematic approach with an emphasis on incremental entries based on price movements relative to a moving average.
Key Features:
Moving Average Based Strategy: Central to this strategy is the simple moving average (SMA), around which all trade entries and exits revolve. Traders can customize the MA length, making it flexible for various trading styles and timeframes.
Incremental Entry Mechanism: Unique to this strategy is the incremental entry system. The strategy initiates an initial trade when the price deviates from the MA by a specified percentage. Subsequent entries are made at incremental steps, defined by the trader, as the price moves further away from the MA. This method can potentially capitalize on increasing market volatility.
Dynamic Position Management: The strategy intelligently manages positions by entering long when the price is below the MA and short when above, allowing for adaptive positioning in different market conditions.
Automated Exit Logic: Exit points are determined when the price touches the MA, aiming to close positions at potential reversal points for optimized trade outcomes.
Continuous Market Analysis: With 'calc_on_every_tick' enabled, the strategy constantly evaluates market conditions, ensuring prompt reaction to price movements.
Usage Scenario:
This strategy is particularly beneficial in markets exhibiting mean-reverting behavior. It is suitable for traders focusing on swing trading or those who prefer to scale into positions during periods of high volatility.
Disclaimer:
Please remember that this strategy is for informational and educational purposes only and is not intended as financial or investment advice. Trading in financial markets carries risks, including the potential loss of capital. We advise doing your own research and consulting with a financial expert before making any investment decisions.

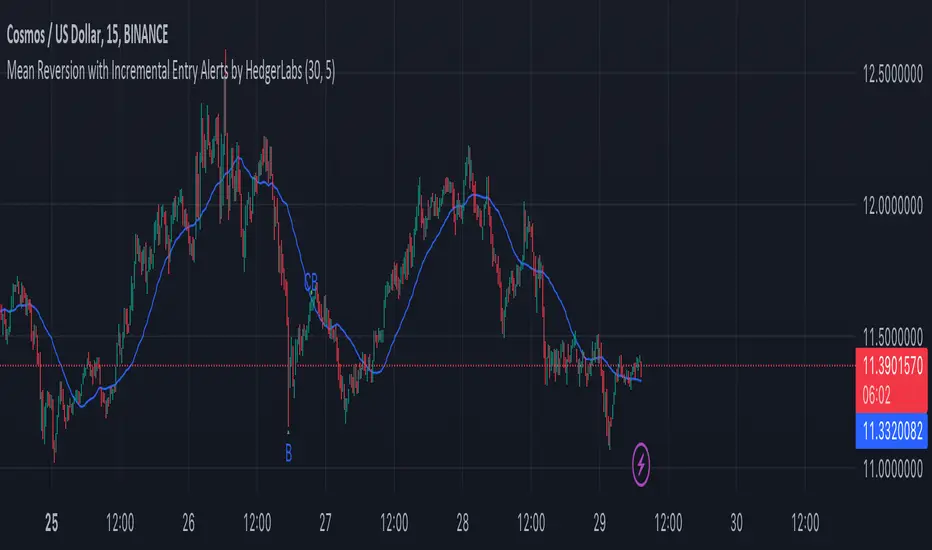
Mean Reversion with Incremental Entry Alerts by HedgerLabsThe "Mean Reversion with Incremental Entry Alerts" is a sophisticated TradingView indicator designed by HedgerLabs. It's built on the concept of mean reversion, a fundamental trading strategy in financial markets. This indicator is tailored for traders seeking systematic and disciplined entry points in volatile markets.
Key Features:
Moving Average (MA) Based: At its core, the indicator utilizes a simple moving average (SMA) as the baseline for mean reversion. You can customize the length of the MA according to your trading style.
Initial Entry Conditions: The script generates initial buy and sell alerts based on a defined percentage deviation from the moving average. This approach allows traders to enter trades at points where the price significantly deviates from its mean, potentially signaling a reversion opportunity.
Buy and Sell Signals: Clear visual cues are provided for buy and sell positions, making it easy to interpret and act upon the signals.
Close Conditions: In addition to entry signals, the indicator also plots closing signals (green and red crosses) when the price touches the moving average. This feature assists in timely exits from positions, aiming to optimize trade outcomes.
Alert System: Integrated alert conditions notify you when a new buy or sell order condition is met, as well as when to close existing positions. This ensures you never miss an opportunity or an exit point.
Usage Scenario:
This indicator is particularly useful in markets where prices tend to revert to a mean value over time. It's ideal for day traders who focus on asset price volatility.
Disclaimer:
Please note that this tool is for informational and educational purposes only and should not be considered as financial or investment advice. Trading involves substantial risk, including the potential loss of principal. We recommend conducting your research and consulting with a financial expert before making any investment decisions.
VWAP, MFI, RSI with S/R StrategyBest for 0dte/intraday trading on AMEX:SPY with 1 minute chart
Strategy Concept
This strategy aims to identify potential reversal points in a price trend by combining momentum indicators (RSI and MFI), volume-weighted price (VWAP), and recent price action trends. It looks for conditions where the price is poised to change direction, either bouncing off a support level in a potential uptrend or falling from a resistance level in a potential downtrend.
By incorporating both price level analysis (support/resistance) and momentum indicators, the strategy seeks to increase the likelihood of identifying significant trend reversals, taking into consideration both recent price movements and the current price's position relative to historical highs and lows.
VWAP (Volume-Weighted Average Price)
VWAP acts as a benchmark to determine the general market trend. It's an average price weighted by volume.
A price above VWAP is often considered bullish, and a price below VWAP is seen as bearish.
MFI (Money Flow Index) and RSI (Relative Strength Index) Parameters
MFI is a volume-weighted RSI, used to identify overbought (above 70) or oversold (below 30) conditions.
RSI is a momentum indicator that measures the magnitude of recent price changes to identify overbought or oversold conditions, similar to MFI.
The script uses standard overbought (70) and oversold (30) thresholds for both MFI and RSI.
Trend Check Function
The function trendCheck analyzes the past pastBars candles to count how many were bullish (closing price higher than the opening price) and bearish.
This function is used to assess the recent trend direction.
Support and Resistance Detection
The script calculates the highest high (highestHigh) and lowest low (lowestLow) over the last lookbackSR (50) periods to identify potential support and resistance levels.
isNearSupport and isNearResistance are conditions to check if the current price is within 0.08% of these identified levels, indicating proximity to support or resistance.
Buy and Sell Logic
Buy Signal:
The RSI crosses over the oversold threshold (30).
The MFI is also below its oversold level (30).
The current price is above the VWAP.
The recent trend (past 20 bars) has been predominantly bearish.
The price is near the identified support level.
Sell Signal:
The RSI crosses under the overbought threshold (70).
The MFI is above its overbought level (70).
The current price is below the VWAP.
The recent trend has been predominantly bullish.
The price is near the identified resistance level.
Triple Confirmation Kernel Regression Overlay [QuantraSystems]Kernel Regression Oscillator - Overlay
Introduction
The Kernel Regression Oscillator (ᏦᏒᎧ) represents an advanced tool for traders looking to capitalize on market trends.
This Indicator is valuable in identifying and confirming trend directions, as well as probabilistic and dynamic oversold and overbought zones.
It achieves this through a unique composite approach using three distinct Kernel Regressions combined in an Oscillator.
The additional Chart Overlay Indicator adds confidence to the signal.
Which is this Indicator.
This methodology helps the trader to significantly reduce false signals and offers a more reliable indication of market movements than more widely used indicators can.
Legend
The upper section is the Overlay. It features the Signal Wave to display the current trend.
Its Overbought and Oversold zones start at 50% and end at 100% of the selected Standard Deviation (default σ = 3), which can indicate extremely rare situations which can lead to either a softening momentum in the trend or even a mean reversion situation.
The lower one is the Base Chart.
The Indicator is linked here
It features the Kernel Regression Oscillator to display a composite of three distinct regressions, also displaying current trend.
Its Overbought and Oversold zones start at 50% and end at 100% of the selected Standard Deviation (default σ = 2), which can indicate extremely rare situations.
Case Study
To effectively utilize the ᏦᏒᎧ, traders should use both the additional Overlay and the Base
Chart at the same time. Then focus on capturing the confluence in signals, for example:
If the 𝓢𝓲𝓰𝓷𝓪𝓵 𝓦𝓪𝓿𝓮 on the Overlay and the ᏦᏒᎧ on the Base Chart both reside near the extreme of an Oversold zone the probability is higher than normal that momentum in trend may soften or the token may even experience a reversion soon.
If a bar is characterized by an Oversold Shading in both the Overlay and the Base Chart, then the probability is very high to experience a reversion soon.
In this case the trader may want to look for appropriate entries into a long position, as displayed here.
If a bar is characterized by an Overbought Shading in either Overlay or Base Chart, then the probability is high for momentum weakening or a mean reversion.
In this case the trade may have taken profit and closed his long position, as displayed here.
Please note that we always advise to find more confluence by additional indicators.
Recommended Settings
Swing Trading (1D chart)
Overlay
Bandwith: 45
Width: 2
SD Lookback: 150
SD Multiplier: 2
Base Chart
Bandwith: 45
SD Lookback: 150
SD Multiplier: 2
Fast-paced, Scalping (4min chart)
Overlay
Bandwith: 75
Width: 2
SD Lookback: 150
SD Multiplier: 3
Base Chart
Bandwith: 45
SD Lookback: 150
SD Multiplier: 2
Notes
The Kernel Regression Oscillator on the Base Chart is also sensitive to divergences if that is something you are keen on using.
For maximum confluence, it is recommended to use the indicator both as a chart overlay and in its Base Chart.
Please pay attention to shaded areas with Standard Deviation settings of 2 or 3 at their outer borders, and consider action only with high confidence when both parts of the indicator align on the same signal.
This tool shows its best performance on timeframes lower than 4 hours.
Traders are encouraged to test and determine the most suitable settings for their specific trading strategies and timeframes.
The trend following functionality is indicated through the "𝓢𝓲𝓰𝓷𝓪𝓵 𝓦𝓪𝓿𝓮" Line, with optional "Up" and "Down" arrows to denote trend directions only (toggle “Show Trend Signals”).
Methodology
The Kernel Regression Oscillator takes three distinct kernel regression functions,
used at similar weight, in order to calculate a balanced and smooth composite of the regressions. Part of it are:
The Epanechnikov Kernel Regression: Known for its efficiency in smoothing data by assigning less weight to data points further away from the target point than closer data points, effectively reducing variance.
The Wave Kernel Regression: Similarly assigning weight to the data points based on distance, it captures repetitive and thus wave-like patterns within the data to smoothen out and reduce the effect of underlying cyclical trends.
The Logistic Kernel Regression: This uses the logistic function in order to assign weights by probability distribution on the distance between data points and target points. It thus avoids both bias and variance to a certain level.
kernel(source, bandwidth, kernel_type) =>
switch kernel_type
"Epanechnikov" => math.abs(source) <= 1 ? 0.75 * (1 - math.pow(source, 2)) : 0.0
"Logistic" => 1/math.exp(source + 2 + math.exp(-source))
"Wave" => math.abs(source) <= 1 ? (1 - math.abs(source)) * math.cos(math.pi * source) : 0.
kernelRegression(src, bandwidth, kernel_type) =>
sumWeightedY = 0.
sumKernels = 0.
for i = 0 to bandwidth - 1
base = i*i/math.pow(bandwidth, 2)
kernel = kernel(base, 1, kernel_type)
sumWeightedY += kernel * src
sumKernels += kernel
(src - sumWeightedY/sumKernels)/src
// Triple Confirmations
Ep = kernelRegression(source, bandwidth, 'Epanechnikov' )
Lo = kernelRegression(source, bandwidth, 'Logistic' )
Wa = kernelRegression(source, bandwidth, 'Wave' )
By combining these regressions in an unbiased average, we follow our principle of achieving confluence for a signal or a decision, by stacking several edges to increase the probability that we are correct.
// Average
AV = math.avg(Ep, Lo, Wa)
The Standard Deviation bands take defined parameters from the user, in this case sigma of ideally between 2 to 3,
to help the indicator detect extremely improbable conditions and thus take an inversely probable signal from it to forward to the user.
The parameter settings and also the visualizations allow for ample customizations by the trader. The indicator comes with default and recommended settings.
For questions or recommendations, please feel free to seek contact in the comments.

Bullish Candle Highlighter by MalviyaOverview:
The Bullish Candle Highlighter is a comprehensive and user-friendly TradingView indicator designed to assist traders in identifying individual bullish candles, facilitating the recognition of potential bullish trends and reversal patterns. This tool is meticulously crafted to enhance the precision of your technical analysis, making it an essential addition to your trading arsenal.
Key Features:
Bullish Candle Identification:
The indicator meticulously scans price action, pinpointing individual candles with a bullish bias.
Each identified bullish candle is distinctly marked on the chart for easy recognition.
Minimum Body Size Filter:
To refine the selection of signals, the indicator incorporates a minimum body size filter.
This filter ensures that only candles with a significant body size are considered, reducing noise and enhancing the reliability of bullish signals.
Visual Highlighting:
Bullish candles are visually highlighted with a vibrant green background, ensuring they stand out on your chart.
The visual cues simplify the process of identifying potential entry points during bullish market conditions.
How to Use:
Bullish Candle Identification:
Keep an eye on the chart for instances where the indicator marks a candle with the label "Bullish Candle."
Each marked candle signifies a potential bullish reversal or continuation pattern.
Buy Signal:
Consider entering a long position when the current candle closes above the high of the identified bullish candle.
The indicator's signals can be used to align your trading decisions with emerging bullish trends.
Advanced Tips:
Confirmation with Other Indicators:
Boost the accuracy of your trades by combining Bullish Candle Highlighter signals with other technical indicators or trend analysis tools.
Risk Management:
Implement sound risk management strategies to protect your capital and optimize your trading performance.
Important Note:
The Bullish Candle Highlighter is a valuable tool, but no indicator guarantees profits. Always conduct thorough analysis and consider multiple factors before making trading decisions.
Disclaimer:
This indicator is provided for educational purposes and is not financial advice. Trading involves risk, and past performance is not indicative of future results.
Feel free to tailor the description to match any specific features or nuances of your indicator. Providing detailed information and usage guidance will help users understand and maximize the benefits of your Bullish Candle Highlighter.

Bitcoin Price to Volume per $1 FeeTransaction value to transaction fee:
The Bitcoin network's efficiency, usability and volume scalability has been improving over time and this can be measured by dividing the average transaction volume by the transaction fee.
The indicator give us:
Price to volume per $1 fee = BTC price / (avg tx value / avg tx fee)
A low ratio of "Price to volume per $1 fee" indicates that the Bitcoin network is being used for high volumes in comparison to the Bitcoin price, which means that the network is cost-effective compared to the price. On the other hand, a high "Price to volume per $1 fee" suggests that the average transaction size is smaller than the price of Bitcoin, which means that the network is less cost-effective compared to the Bitcoin price.
Note that the dynamics of transaction fees may change over time as new use cases emerge in the Bitcoin chain. These use cases include L2s such as Stacks, where DeFi applications can run, and Bitcoin Ordinals.
It's worth mentioning that Bitcoin is not only a cost-effective way of transferring value, but also highly energy efficient. Despite receiving criticism for its energy consumption, when we compare its energy usage to other industries (such as banking and gold) and correlate it with the transaction volumes, we can easily conclude that Bitcoin's energy efficiency is remarkable when compared to other methods of transferring value.

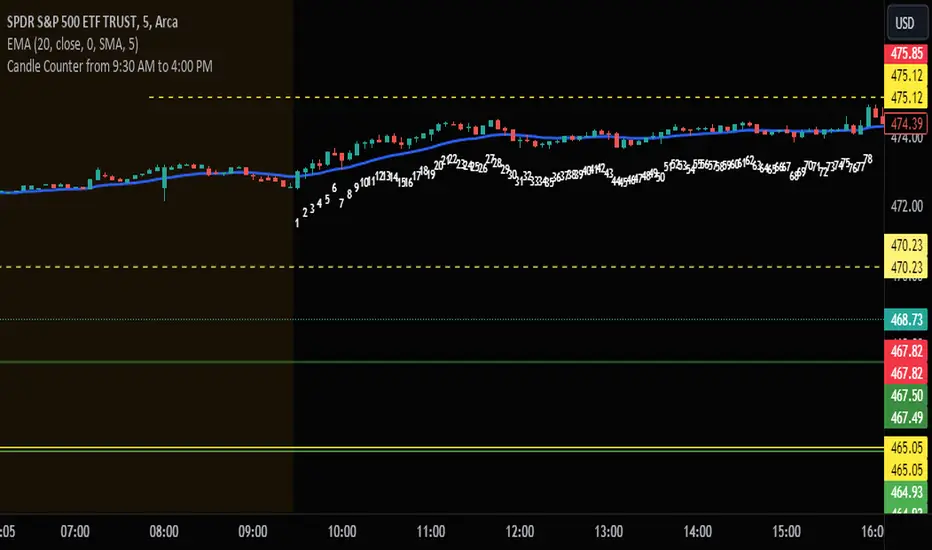
Candle Counter from 9:30 AM to 4:00 PMThis Pine Script, designed for TradingView, serves as a candle counter exclusively for a 5-minute chart. It operates within the specific market hours of 9:30 AM to 4:00 PM. Key features of the script include:
Market Hours Specification: The script is configured to track candles only during the trading hours from 9:30 AM to 4:00 PM.
Daily Reset: Each trading day, the candle counter resets, starting anew from the market opening at 9:30 AM.
Candle Counting: It increments a counter with each 5-minute candle during the specified market hours.
Label Display: The counter number for each candle is displayed as a label at the candle's low point. This label is in bright white color with large font size, ensuring clear visibility against various chart backgrounds.
5-Minute Chart Specificity: The script is tailored to function only when the chart is set to a 5-minute timeframe, making it ideal for traders focusing on intraday movements.
New Day Detection: Utilizes a function to identify the start of a new trading day, ensuring accurate daily counting.
This script is particularly useful for traders who focus on intraday trading within the standard stock market hours, providing a clear and easy-to-read candle count that resets daily.
VaR Market Sentiment by TenozenHello there! I am excited to share with you my new trading concept implemented in the "VaR Market Sentiment" indicator. But before that, let me explain what VaR is. VaR, or Value at Risk, is an indicator that helps you identify the worst-case scenario of a market movement based on a percentile/confidence level. This means that it calculates the worst moves, whether it's a buy or sell, based on the timeframe you're using.
Now, let's discuss how VaR Market Sentiment works. It uses a historical VaR to calculate the worst move either if the market goes up or down based on a percentile/confidence level. The default setting is the 95th percentile, which means that the market is unlikely to hit your SL level within the day if you're using a daily timeframe, etc.
To determine the strength of a candle, it subtracts the value of both sides based on the returns of the current timeframe with the VaR value (Bullish VaR - Bullish Returns, Bearish VaR - Bearish Returns). If the result is above the mean, the current candle is potentially weak. Conversely, if the result is below the mean, the current candle is potentially strong. The deviation shows critical sentiments, where if the market is above the deviation, it means that the current candle is really weak. If it's below the deviation, it means that the current candle is really strong.
It's important to note that this indicator needs other supporting indicators such as trend-following or mean reversion indicators based on your trading style. Also, as a follow-up to my previous concept, I called out that the market has what's called "power." And for now, I conclude that VaR Market Sentiment is the "power."
I'm going to share more helpful indicators in the future! I hope this indicator will be helpful for you guys! Ciao!

Candlestick Patterns [NAS Algo]Candlestick Patterns plots most commonly used chart patterns to help and understand the market structure.
Bullish Reversal Patterns:
Hammer:
Appearance: Small body near the high, long lower shadow.
Interpretation: Indicates potential bullish reversal after a downtrend.
Inverted Hammer:
Appearance: Small body near the low, long upper shadow.
Interpretation: Signals potential bullish reversal, especially when the preceding trend is bearish.
Three White Soldiers:
Appearance: Three consecutive long bullish candles with higher closes.
Interpretation: Suggests a strong reversal of a downtrend.
Bullish Harami:
Appearance: Small candle (body) within the range of the previous large bearish candle.
Interpretation: Implies potential bullish reversal.
Bearish Reversal Patterns:
Hanging Man:
Appearance: Small body near the high, long lower shadow.
Interpretation: Suggests potential bearish reversal after an uptrend.
Shooting Star:
Appearance: Small body near the low, long upper shadow.
Interpretation: Indicates potential bearish reversal, especially after an uptrend.
Three Black Crows:
Appearance: Three consecutive long bearish candles with lower closes.
Interpretation: Signals a strong reversal of an uptrend.
Bearish Harami:
Appearance: Small candle (body) within the range of the previous large bullish candle.
Interpretation: Implies potential bearish reversal.
Dark Cloud Cover:
Appearance: Bearish reversal pattern where a bullish candle is followed by a bearish candle that opens above the high of the previous candle and closes below its midpoint.
Continuation Patterns:
Rising Three Methods:
Appearance: Consists of a long bullish candle followed by three small bearish candles and another bullish candle.
Interpretation: Indicates the continuation of an uptrend.
Falling Three Methods:
Appearance: Consists of a long bearish candle followed by three small bullish candles and another bearish candle.
Interpretation: Suggests the continuation of a downtrend.
Gravestone Doji:
Appearance: Doji candle with a long upper shadow, little or no lower shadow, and an opening/closing price near the low.
Interpretation: Signals potential reversal, particularly in an uptrend.
Long-Legged Doji:
Appearance: Doji with long upper and lower shadows and a small real body.
Interpretation: Indicates indecision in the market and potential reversal.
Dragonfly Doji:
Appearance: Doji with a long lower shadow and little or no upper shadow.
Interpretation: Suggests potential reversal, especially in a downtrend.

TrailingTakeProfit exampleQuite recently I came upon a concept of Trailing Take Profit and I couldn't find a PineScript which implements it for the fastest possible execution, so here it is :)
Everybody knows Trailing StopLoss - an invisible mechanism follows the price and exits the trade once the price retreats too much from its recent most extended favourable value. Trailing TakeProfit does the similar thing, but at the opposite end - the trade gets closed if a price moves too well, in too favourable extent.
Why close the trade if it is going so good? Well, whatever goes up, must go down and vice versa. It is expected, that after fast rally a market will soon fall and after a dump it will go up. So Trailing TakeProfit's role is to secure profits.
But how does Trailing TakeProfit differ from the standard one? "Trailing" means, the exit level is moving. Its role is to be executed only after a rapid favourable move within 1-2 candles, not more. We never know when a rapid move happens, but when it does, we wanna catch those pips and quickly exit without looking back.
Visually Trailing TakeProfit levels are... bands. In this script example these are ATR multiplied bands (aka Keltner Channel), but they could also be Bollinger Bands or something else.
The code is simple just to focus on this single functionality, so you can quickly copy-paste it into your script. Entries are triggered by default SMA crosses.
P.S. I wouldn't be myself, if I didn't add alert messages compatible with the syntax of recently revamped TradingConnector - both in the code already and in the table showing them.

Central Bank Liquidity YOY % ChangeThis shows the percent change from a year ago (YOY%) in Central Bank Liquidity
It's important to the study rate of change data in this liquidity metric and compare it to the nominal chart.
When this chart is accelerating, liquidity is being added, meaning it's a good time to be in assets.
When this chart is declining, liquidity is being removed, meaning it's a good time to be in cash.
Bottoms in markets coincide with the rate of change of liquidity going from negative (below the zero line) to positive (above zero)
Central Bank Liquidity = Total value of the assets of all Federal Reserve Banks - Overnight Reverse Repurchase Agreements (RRP) - The Treasury General Account (TGA)

Stock's Intrinsic Value| DCF modelScript Description
This pine script is based on a YouTube video titled: Warren Buffett: How to Calculate the Intrinsic Value of a Stock. Warren Buffett is a famous value investor who follows the principles of his mentor Benjamin Graham. He looks for companies that have strong competitive advantages, consistent earnings, and low debt. He also considers the intrinsic value of a company, which is the present value of its future cash flows, and compares it to the market price. He prefers to buy stocks that are trading below their intrinsic value and hold them for a long time.
One of the methods that Buffett uses to estimate the intrinsic value of a company is the discounted cash flow (DCF) model. This involves projecting the free cash flow (FCF) of the company for several years and then discounting it back to the present using an appropriate discount rate. The discount rate is usually the weighted average cost of capital (WACC) of the company, which reflects its cost of equity and debt. The sum of the discounted FCFs and terminal value is the intrinsic value of the company.
Lastly, a margin of safety is included when using the DCF method for stock valuation because of uncertainty and error in estimating future cash flows and the intrinsic value of the company.
When the current price is below margin of safety, it means that the stock is currently undervalued and being price at significantly below its intrinsic value.
Guideline for determining each variable in this script
FCF growth rate: This is the annual rate at which the free cash flow (FCF) of the company is expected to grow over a forecast 10-year period. You can use historical FCF growth rates, industry averages, analyst estimates, or your assumptions to project the FCF growth rate. The higher the FCF growth rate, the higher the intrinsic value will be.
Discount rate: This is the rate of return that you require to invest in the company. It reflects the risk and opportunity cost of investing in the company. You can use the weighted average cost of capital (WACC) of the company, capital pricing model (CAPM), hurdle rate, or market rate as the discount rate. The lower the discount rate, the higher the intrinsic value.
The margin of safety: Provides a cushion against errors in the valuation or adverse events that may affect the company. The margin of safety depends on your personal preference and risk tolerance. Normally is at 15% - 30%, the higher the margin of safety you set, the lower the chance that the stock will hit that level.
How to use this script
Step 1: This script only works for stocks that have financial data of free cash flow and total common shares outstanding
Step 2: Please use a yearly chart (12-month chart)
Step 3: You are required to determine a growth rate that will grow the free cash flow 10 years into the future
Step 4: You are required to determine a discount rate for the calculations
Step 5: You are required to add a margin of safety (Accounting for uncertainty)
Step 6: The rest of the calculations will be done automatically.
Disclaimer when using this script
I'm not a financial advisor
This script is for education purposes only
There are risks involved with stock market investing and investors should not act upon the content or information found here without first seeking advice from an accountant, financial planner, lawyer or other professional.
I can’t guarantee that this script will be error-free as I still consider myself a Pinescript beginner
Before making any decisions, investors should always research companies individually
I'll not be liable for any loss incurred, arising from the use of, or reliance on, this script
Limitations of this script
This script only works on the yearly chart (12 monthly charts)
The intrinsic value of a company will be negative if the company have a negative forecasted free cash flow
You need to make an educated guess about the growth rate, discount rate and margin of safety
This script uses free cash flow instead of owner's earnings (Operating cash flow - Maintenance capital expenditure), therefore it can't accurately estimate the maintenance capital expenditure.
Need at least 6 years’ worth of financial data
Market capitalisation uses total common shares outstanding multiplied by the closing price instead of using company-level total outstanding shares multiplied by the closing price
