Currency Pairs High Low RangeIndicator gives the High-Low range of 18 currency pairs. There is a High Ave which is the average of the top four (you may need to adjust which ones are in the average) as well as the bottom four Low Ave. The picture is of a weekly chart with the indicator set at 12 week average of the High-Low range with a .7 (70%) multiplier. When I am looking for week long trades with lots of movement I pick my pairs based on the most actives with a 70% capture of the range as a guide line of when to exit. Sometime when I am not in the mood for volatility I go with the ones in the Low Ave area. Further, when I day trade I set the indicator to a 1Day chart and move the percent to 20% or 30% as a guideline to tell when to get out of a trade.
GBPUSD


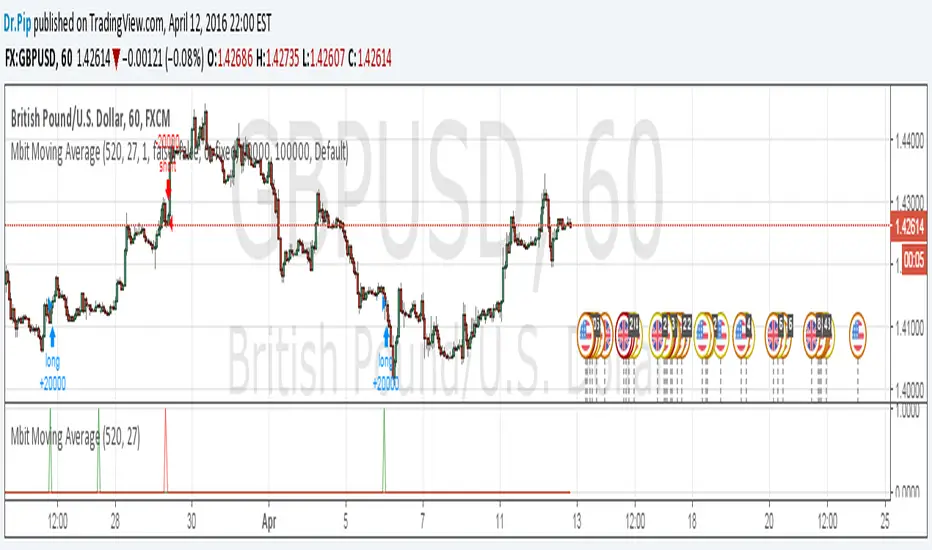
Simple Moving Average StrategyThis is a modification of MOVINGAVG CROSS with different inputs of bar lengths that work with a great average percentage with not much drawdown. I ran the strategy tester with GBPUSD on 1 hour time frame.
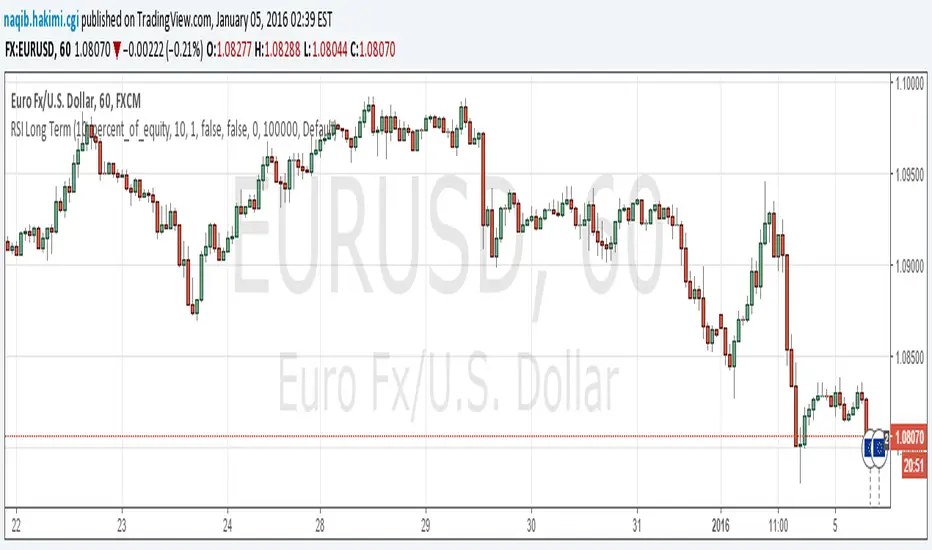
RSI Long TermThis strategy work good with long term ?
but only can check this in 9 month's
i am still working to see if it really works on 10 year data ( actually i still do not know how to do that in this site any idea ?)
and increase the trade number
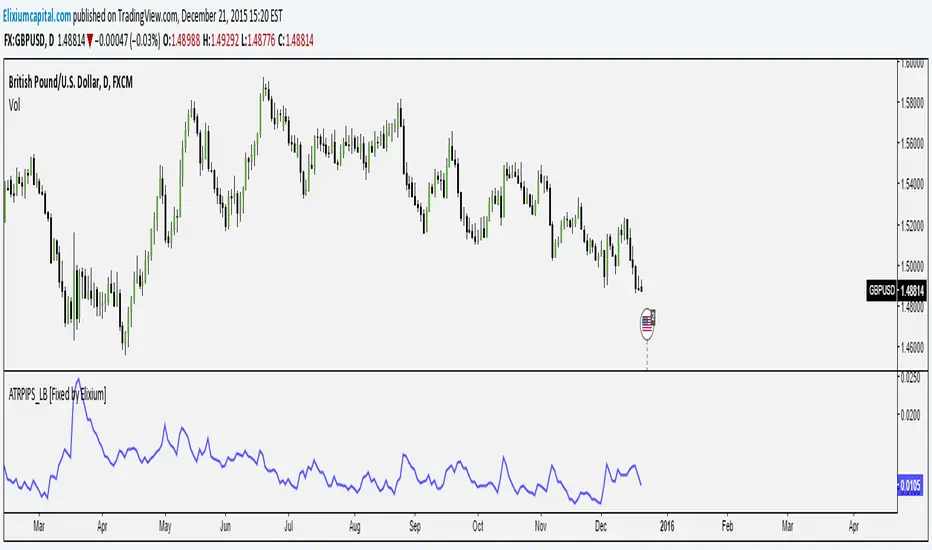
ATR Pips [LazyBear] [Fixed by Elixium]This is ATR in pips. This was requested by user @ElixiumCapital on Twitter. ATRPIPs in his words:
How to use: Change the chart to the Daily time frame. The indicators value e.g. 0.0105 means that the average daily range of the past 5 trading days is 105 pips. (On standard pairs like EURUSD, GBPUSD)
"ATR PIPs is useful for finding markets with your desired amount of volatility, for example I prefer to trade forex pairs with the highest amount of volatility in the past 5 days, setting the length parameter to 5 days. And setting my stop loss at 25% to 33% of the the indicators value."
Fixed: Default parameters and a critical bug.
POC bands 2.0 and other assorted goodiesI updated my old indicator that plotted a Kalman filter avg. of the bars inside a higher timeframe bar, to attempt to find the most frequent price in that bar's timespan.
It ended up being somewhat close, but not exact, but the result is that you get a pseudo-vwap without a need for volume data, that isn't cumulative and can indicate trend direction, or if the market's ranging.
This is very powerful information!
I highlight a trade setup we get here, derived from observing the indicator's slope and knowing how to read price action, assisted by rgmov and cci readings.
To get the code for the other indicator's you will have to click on share, and then on 'Make it mine' so you get the whole layout.
Good luck and hope you find these of use.
Cheers,
Ivan.
