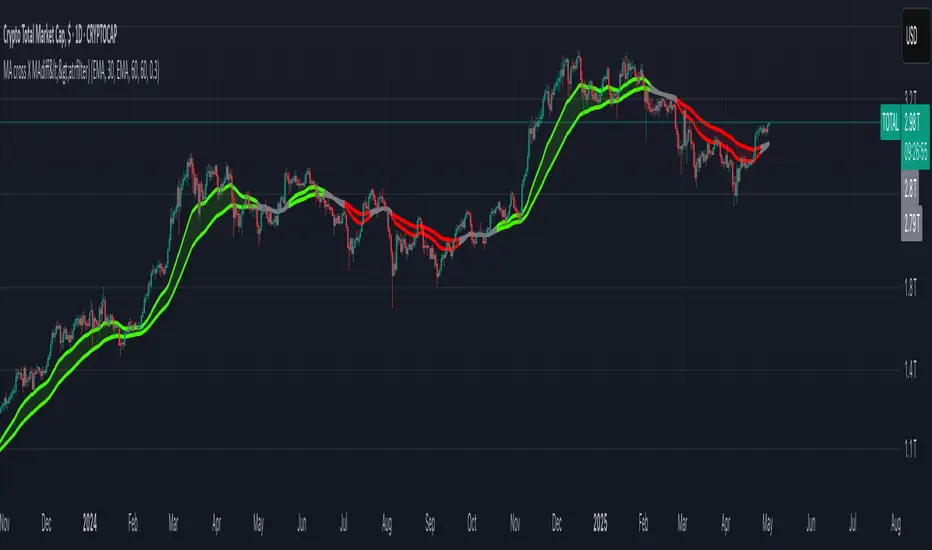
MA cross X MAdiff<>atrfilter)📈 MA cross X MAdiff<>ATR filter
Smarter Trend Confirmation Using Adaptive Volatility Thresholds
🔍 What It Does
This indicator upgrades classic moving average crossovers by adding volatility awareness via ATR filtering. Instead of reacting to every small crossover, it waits for the distance between two moving averages to exceed a volatility-adjusted threshold, making signals more meaningful and less noisy.
⚙️ Core Logic
Calculates the difference between a Fast MA and a Slow MA.
Uses Average True Range (ATR) as a dynamic volatility filter.
Confirms trend only when MA difference exceeds:
diff > ATR × multiplier → Bullish
diff < -ATR × multiplier → Bearish
Otherwise: Neutral (gray zone)
The gray zone avoids false signals by detecting indecision or choppy markets.
🧠 Customizable Inputs
Choose any MA type independently for Fast and Slow:
SMA, EMA, WMA, VWMA, RMA, DEMA, TEMA, LSMA, Kijun
Control sensitivity via:
ATR Length
ATR Multiplier
✅ Why It Works
Reduces fake outs in ranging markets.
Adapts to volatility automatically.
Fully customizable for any asset or style.
Ideal for trend traders, momentum entries, or as a confluence layer.
Moving Averages
Seekho roj kamaoVery accurate buy and sell entries.This custom trading indicator delivers powerful market insights by combining price action, volume trends, and momentum shifts. Designed for precision, it identifies high-probability entry and exit points, minimizing noise and maximizing clarity. Whether you're day trading or swing trading, it enhances decision-making and adapts seamlessly to various market conditions

All‑MA Crossover + analyzer + risk Management [quantotc]🔍 Overview
All‑MA Trend Analyzer + Risk Management is a full-featured, multi-purpose trend and crossover system that lets you compare 8 different moving average types, visualize their alignment across timeframes, and apply robust risk management strategies — all in one powerful tool.
🧠 What Makes This Indicator Unique?
🔄 8 Moving Average Types — Easily switch between SMA, EMA, WMA, VWMA, HMA, RMA, SMMA, and TMA.
🟢 Signal Clarity — Buy/Sell labels appear on fast/slow MA crossovers.
📊 Dual Analysis Tables
Top-right: Multi-timeframe crossover trends (15m, 1h, 4h, Daily)
Bottom-right: MA type trends on current timeframe (Bull/Bear)
⚙️ Risk Management
Supports fixed SL/TP or trailing stop-loss
Works in % or Points
Visual SL/TP/TSL exit labels with separate alerts
🎯 How to Use
Select your desired MA Type (e.g., TMA, VWMA, etc.)
Adjust Fast/Slow Lengths depending on your strategy
Enable Long/Short entries as needed
Choose SL/TP Mode: Points or Percentage
Enable Trailing Stop for dynamic protection
Each feature is grouped and labeled with tooltips in the settings panel for clarity.
🖼 Visual Aids
A TMA Bull signal
Table-based trend analysis
Buy label clarity
Sell label clarity
Exit label on Take Profit
Exit label on Stop Loss
Trailing Stop Loss Exit
🚨 Alerts Included
BUY / SELL
TAKE PROFIT
STOPLOSS
TRAILING STOPLOSS
Each is customizable in the settings.
👤 Developer Info
Developer: quantotc
Website: quantotc.com
YouTube:https://youtube.com/@quantotc
Tags: multi timeframe, crossover, risk management, all MA, trailing stop, bullish bearish, trend table, strategy builder
⚠️ Disclaimer
This script is for educational purposes only. No guarantee of profitability. Always backtest and use proper risk management.

Vortex SMA StrategyThere are two components to this script:
- Vortex Indicator (This will signal the long and short entries)
- SMA (This acts as a filter when price is above the SMA it only signals longs, when the price is below the SMA it only signals shorts)
Examples of longs and shorts
It's best to use a volume indicator paired with this to further filter losing trades.
If you have any ideas send me a message please!

5-facher EMA mit individuellen EinstellungenThis is a good EMA.
This is a good EMA
This is a good EMA
This is a good EMA.
This is a good EMA
This is a good EMA
This is a good EMA.
This is a good EMA
This is a good EMA
This is a good EMA.
This is a good EMA
This is a good EMA
This is a good EMA.
This is a good EMA
This is a good EMA
This is a good EMA.
This is a good EMA
This is a good EMA
This is a good EMA.
This is a good EMA
This is a good EMA
This is a good EMA.
This is a good EMA
This is a good EMA
This is a good EMA.
This is a good EMA
This is a good EMA
This is a good EMA.
This is a good EMA
This is a good EMA
This is a good EMA.
This is a good EMA
This is a good EMA
This is a good EMA.
This is a good EMA
This is a good EMA

DECODE Multi SMA EMANo need to keep reconfiguring your moving averages. Set up to 10 moving averages, 5 x SMA and 5 x EMA, and optionally apply coloured shading between pairs. Once it's set up, just turn them on or off as needed!

GMMA - Dr. Wish StyleGuppy Multiple Moving Average (GMMA) chart, as popularized by Daryl Guppy. It overlays multiple exponential moving averages (EMAs) to identify trends and confirm breakouts. Dr. Eric Wish seems to be using a version of this as part of his technical setup.
🧠 Quick GMMA Breakdown:
Guppy charts typically include:
Short-term EMAs: 3, 5, 8, 10, 12, 15
Long-term EMAs: 30, 35, 40, 45, 50, 60
These two groups show how traders vs investors are behaving. Convergence/divergence of these lines signals strength/weakness in the trend.


MA Trendline with Angle LockThis indicator is just white line in screenshot (and will show the MA it is using).... This grabs the slope of the MA and makes a trendline out of it until the angle changes by x percentage then it recalculates. Mimics what a 2x sma envelope does to a smaller sma envelope... carves out the impulses just with straight rather than curved edges if that makes sense. Envelopes are shown as an example.

Weekly Moving Averages (MAs) to Intraday ChartThis indicator overlays key weekly timeframe moving averages onto your intraday chart, allowing you to visualize important long-term support and resistance levels while trading shorter timeframes. The indicator includes:
330-period Simple Moving Average (white): Ultra long-term trend indicator
200-period Simple Moving Average (fuchsia): Major long-term trend indicator often watched by institutional traders
100-period Simple Moving Average (purple): Medium-to-long term trend indicator
50-period Exponential Moving Average (blue): Medium-term trend indicator, more responsive to recent price action
21-period Exponential Moving Average (teal): Short-to-medium term trend indicator
9-period Exponential Moving Average (aqua): Short-term trend indicator, highly responsive to recent price movements
This multi-timeframe approach helps identify significant support/resistance zones that might not be visible on your current timeframe. When price interacts with these weekly moving averages during intraday trading, it often signals important areas where institutional orders may be placed.
The indicator uses color-coding with increasing line thickness to help you quickly distinguish between different moving averages. Consider areas where multiple MAs cluster together as particularly strong support/resistance zones.
Perfect for day traders and swing traders who want to maintain awareness of the bigger picture while focusing on shorter-term price action.

StochRSI Strategy with SL/TPSimple approach the StochiRSi strategy that has stop loss and take profit, A fully control the inputs of stochi RSi and back testing date.. code are credit to ryzinray@gmail.com

MACD - El Cruce de Oro//@version=5
strategy("MACD - El Cruce de Oro", overlay=true, default_qty_type=strategy.percent_of_equity, default_qty_value=2)
// === INPUTS ===
fastLength = input.int(20, title="MACD Fast Length")
slowLength = input.int(40, title="MACD Slow Length")
signalSmoothing = input.int(20, title="Signal Smoothing")
sl_pct = input.float(0.5, title="Stop Loss %", minval=0.1, maxval=5)
trailing_pct = input.float(0.5, title="Trailing Stop %", minval=0.1, maxval=5)
// === MACD CÁLCULO ===
= ta.macd(close, fastLength, slowLength, signalSmoothing)
// === CONDICIONES DE ENTRADA ===
longCondition = ta.crossover(macdLine, signalLine)
shortCondition = ta.crossunder(macdLine, signalLine)
// === GESTIÓN DE RIESGO ===
sl = close * sl_pct / 100
tsl = close * trailing_pct / 100
// === ENTRADAS Y SALIDAS ===
if (longCondition)
strategy.entry("Compra", strategy.long)
strategy.exit("SL/TS Long", from_entry="Compra", stop=close - sl, trail_points=tsl, trail_offset=tsl)
if (shortCondition)
strategy.entry("Venta", strategy.short)
strategy.exit("SL/TS Short", from_entry="Venta", stop=close + sl, trail_points=tsl, trail_offset=tsl)
// === PLOTEO DE LÍNEAS MACD ===
plot(macdLine, color=color.blue, title="MACD Line")
plot(signalLine, color=color.red, title="Signal Line")

SMA 5/20 Crossover PointsThis script plots the 5 and 20 Simple Moving Averages (SMAs) and highlights key crossover points that can signal trend changes. When the 5 SMA crosses above the 20 SMA, a green triangle appears below the candle (bullish signal). When the 5 SMA crosses below the 20 SMA, a red triangle appears above the candle (bearish signal). It's a simple tool for identifying potential entry and exit points in trending markets.

BLCKBOX EMA Cross StudyThe BLCKBOX EMA Cross Study is a simple EMA ribbon overlayed on the chart with the following timeframes;
7, 14, 21, 42, 90, 180
I hope you find this indicator useful. I have released several indicators that can be used in conjunction to hopefully improve your chances of making a ton of money!
BLCKBOX indicators include;
BLCKBOX Buying / Selling Sentiment
BLCKBOX MACD Indicator
BLCKBOX Relative Strength Index
BLCKBOX Crypto Bear Market Prediction
BLCKBOX Stochtastic
BLCKBOX EMA Cross Study
If you find this or any other indicator useful and wish to show your gratitude, you may!
Doge
DJwW7XazGk2R8nXjt8y5ydQfGKYSz3XV3h
Litecoin
ltc1qh8t4dmz8sugjcd5unn0g49985u0tz5gs6kf98y
Bitcoin
bc1q0deh9t9w9tm3qgd3npn7965rzel35qumez7m5v
Ethereum
0xa23a7bbde03ea31f5cce4b115c8ef1ea8bc9f467
Pepe
Pr7DZSXKwVGv7LYhRQ9oSuuWxUecc3Dvwq

Algoguy Toolkit [CuriousB]modified QuantVue GMMA Toolkit to change the moving average bands for Algoguy specs for Scott's Zone Traders Algoguy
bands are:
short term: 7-14 ema in 1 step increments
long term: 30-60 ema in 2 step increments
the oscillator shows:
trend strength in the distance away from the 0 line
compression or short term, long term and both indicating market consolidation possibly affecting reversal or continuation
band cross over
buy and sell signals

Hull Moving Average with Cloud📈 Hull Moving Average with Cloud – Adaptive Trend Visualization
This indicator combines the power of the Hull Moving Average (HMA) with a visual signal line and trend cloud, giving traders a clearer view of market direction, momentum shifts, and potential reversals.
🔍 Key Features:
Dynamic HMA Length (optional): Adjusts the HMA period based on ATR volatility, allowing the moving average to adapt to changing market conditions.
Custom Smoothing Options: Smooth the main HMA with your choice of SMA, EMA, or WMA for a tailored trend line.
Signal Line (Orange HMA): A shorter-period Hull MA that acts as a trigger line for crossovers and trend changes.
Color-Coded Trend Cloud:
🟩 Green Cloud: Bullish – main HMA is above the signal HMA.
🟥 Red Cloud: Bearish – main HMA is below the signal HMA.
Real-Time Trend Coloring: Both lines dynamically change color based on slope (green for rising, red/purple for falling).
Offset Capability: Shift the HMA forward to visualize trend development and potential future direction.
✅ Use Cases:
Identify trend direction with cloud coloration.
Spot early reversals through HMA crossover signals.
Filter trades with volatility-aware moving average responsiveness.


Fibonacci + TP/SL Strategy [Backtest]✅ Key Features Added and Adjusted:
Fibonacci Retracement Levels:
Automatically calculated based on the last 100 bars' high/low
Plotted levels: 0%, 23.6%, 38.2%, 50%, 61.8%, 78.6%, 100%
Extension targets: 161.8%, 261.8%, 423.6%
Buy/Sell Signal Logic:
Buy: Price is between 78.6% and 38.2% levels
Sell: Price is between 61.8% and 23.6% levels
Both depend on a can_trade time filter to avoid overtrading
ATR-based Stop-Loss:
Stop-loss dynamically adapts to market volatility:
SL = Entry - ATR * 1.5 (long)
SL = Entry + ATR * 1.5 (short)
Fixed Take-Profit:
Configurable via input: default is 4%
Can be changed in TradingView UI
Golden/Death Cross Indicator (Visual Only):
EMA 50 crossing EMA 200 plotted on chart:
Golden Cross = Buy signal (green triangle)
Death Cross = Sell signal (red triangle)
Weekly Profit Cap:
Prevents new trades if weekly profit exceeds 15%
Resets at the start of every week
Visual Elements:
All Fibonacci levels are plotted
Buy/Sell signals are labeled on the chart (BUY, SELL)

BLCKBOX Moving Average RibbonThe BLCKBOX Moving Average Ribbon is a simple moving average ribbon overlayed on the chart with the following timeframes;
7, 21, 42, 90, 180, 365
I hope you find this indicator useful. I have released several indicators that can be used in conjunction to hopefully improve your chances of making a ton of money!
BLCKBOX indicators include;
BLCKBOX Buying / Selling Sentiment
BLCKBOX MACD Indicator
BLCKBOX Relative Strength Index
BLCKBOX Crypto Bear Market Prediction
BLCKBOX Stochtastic
BLCKBOX EMA Cross Study
BLCKBOX Moving Average Ribbon
If you find this or any other indicator useful and wish to show your gratitude, you may!
Doge
DJwW7XazGk2R8nXjt8y5ydQfGKYSz3XV3h
Litecoin
ltc1qh8t4dmz8sugjcd5unn0g49985u0tz5gs6kf98y
Bitcoin
bc1q0deh9t9w9tm3qgd3npn7965rzel35qumez7m5v
Ethereum
0xa23a7bbde03ea31f5cce4b115c8ef1ea8bc9f467
Pepe
Pr7DZSXKwVGv7LYhRQ9oSuuWxUecc3Dvwq

21 EMA + VWAP Trend BiasThis indicator provides a clear market trend bias by combining the 21-period Exponential Moving Average (EMA) and Volume Weighted Average Price (VWAP) — two powerful tools for identifying short-term and intraday trend direction.
📊 How It Works:
A bullish trend is identified when the current price is trading above both the 21 EMA and VWAP. During these conditions, the chart background turns green, signaling that buying opportunities may have higher probability.
A bearish trend is identified when the price is below both the 21 EMA and VWAP. The background turns red, suggesting that selling pressure dominates.
If price is between the two indicators (e.g., above EMA but below VWAP), no background color appears — indicating uncertain or mixed market structure, and suggesting traders wait for better clarity.
✅ Use Cases:
Quickly filter trades to stay aligned with market momentum
Apply as a bias filter for scalping, day trading, or swing trading
Combine with price action, candlestick patterns, or RSI for enhanced setups
🧠 Note:
This is not a signal-based system. It's a trend bias tool designed to help traders avoid counter-trend entries and maintain directional discipline.

[SlawaF] Money Flow Oscillator (MFO)The Money Flow Oscillator (MFO) is a technical indicator that measures the strength of money flow in and out of a security by analyzing price and volume. It helps identify overbought and oversold conditions, similar to the RSI but with a stronger emphasis on volume.
Key Features:
Length (14 default) – The lookback period for calculating money flow.
Smoothing Period (9 default) – Applies an SMA to smooth the oscillator for cleaner signals.
Gradient Mode – When enabled, the line changes color based on value (green at lower levels, red at higher levels).
Custom Line Color – If gradient is disabled, a user-defined color is used.
Overbought/Oversold Levels – Horizontal lines at 80 (overbought) and 20 (oversold).
How It Works:
Typical Price is calculated as (High + Low + Close) / 3.
Raw Money Flow is Typical Price × Volume.
Positive & Negative Money Flow are summed over the selected period.
Money Flow Ratio compares buying vs. selling pressure.
MFO converts the ratio into a 0-100 oscillator.
Smoothing is applied via SMA for refined signals.
Usage:
Overbought (>80) – Potential selling opportunity.
Oversold (<20) – Potential buying opportunity.
Trend Confirmation – Rising MFO suggests bullish momentum, while falling MFO indicates bearish pressure.
Money Flow Oscillator (MFO) – это технический индикатор, который оценивает силу притока и оттока денежных средств на основе цены и объема. Он помогает определять состояния перекупленности и перепроданности, аналогично RSI, но с большим акцентом на объем.
Основные параметры:
Длина (14 по умолчанию) – Период расчета денежного потока.
Сглаживание SMA (9 по умолчанию) – Скользящая средняя для сглаживания осциллятора.
Градиент – Если включен, цвет линии меняется от зеленого (низкие значения) до красного (высокие).
Цвет линии без градиента – Пользовательский цвет, если градиент отключен.
Уровни перекупленности/перепроданности – Горизонтальные линии на 80 (перекупленность) и 20 (перепроданность).
Принцип работы:
Типичная цена = (High + Low + Close) / 3.
Сырой денежный поток = Типичная цена × Объем.
Положительный и отрицательный потоки суммируются за выбранный период.
Отношение денежных потоков сравнивает давление покупателей и продавцов.
MFO преобразует отношение в осциллятор 0-100.
Сглаживание SMA улучшает качество сигналов.
Как использовать:
Перекупленность (>80) – Возможность продажи.
Перепроданность (<20) – Возможность покупки.
Подтверждение тренда – Рост MFO указывает на бычий импульс, падение – на медвежий.

RSI-EMA-Crossing with Donchian-Stop-LossThe Donchian RSI Indicator is a visual tool that combines momentum and trend analysis to identify high-quality long opportunities based on RSI crossovers, price action, and Donchian channel dynamics.
How It Works
Momentum Signal: A bullish RSI crossover is detected when the RSI crosses above its moving average.
Trend Filter: A signal is only valid if the crossover occurs while the price is above its moving average – filtering out entries against the prevailing trend.
Signal Candle: The high of the crossover candle is stored.
Entry Trigger: A valid signal occurs when a later candle closes above that signal high.
Stop-Loss (Visual Only)
The lower band of the Donchian Channel acts as a visual reference for a dynamic stop-loss level.
Features
Customizable RSI, Donchian Channel, and moving average lengths
Selectable MA types: SMA, EMA, WMA, VWMA, HMA
Signal candle highlighted (yellow background)
Entry points labeled on the chart
Price MA and Donchian Channel plotted
Trend filter improves signal quality by confirming upward bias
Use Case
Designed for swing and position traders
Optimized for use on daily or 4H charts

Candle Crossing 9 & 20 SMAdouble cross on both 9 and 20 sma, red arrow when crossing down, green arrow when crossing up

SMAs (8,21,33,55,233) by lharsha5 SMA's in one indicator, rather than using seperate indicators for each moving average
