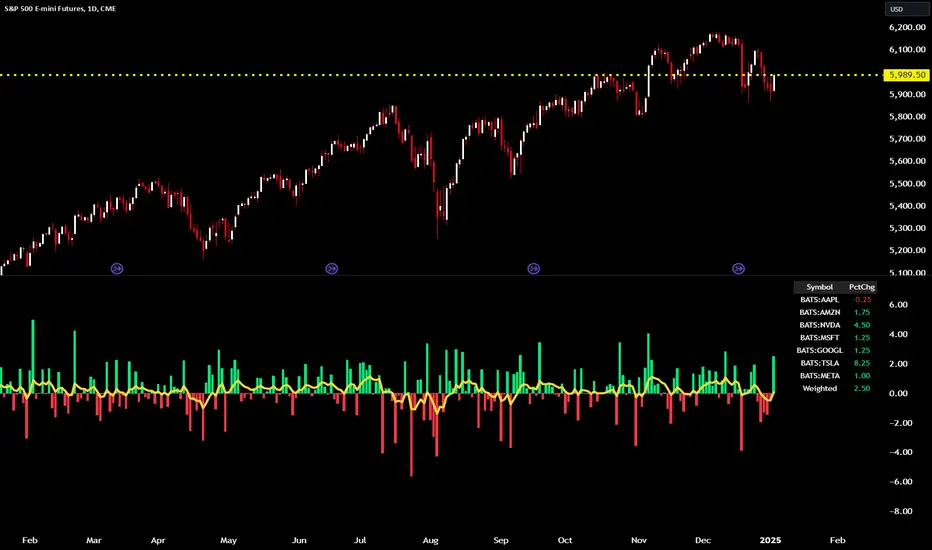
MAG 7 - Weighted Multi-Symbol Momentum + ExtrasOverview
This indicator aggregates the percentage change of multiple symbols into a single “weighted momentum” value. You can set individual weights to emphasize or de-emphasize particular stocks. The script plots two key items:
The default tickers in the script are:
AAPL (Apple)
AMZN (Amazon)
NVDA (NVIDIA)
MSFT (Microsoft)
GOOGL (Alphabet/Google)
TSLA (Tesla)
META (Meta Platforms/Facebook)
Raw Weighted Momentum (Histogram):
Each bar represents the combined (weighted) percentage change across your chosen symbols for that bar.
Bars are colored green if the momentum is above zero, or red if below zero.
Smoothed Momentum (Yellow Line):
An Exponential Moving Average (EMA) of the raw momentum for a smoother trend view.
Helps visualize when short-term momentum is accelerating or decelerating relative to its average.
Features
Symbol Inputs: Up to seven user-defined tickers, with weights for each symbol.
Smoothing Period: Set a custom lookback length to calculate the EMA (or switch to SMA in the code if you prefer).
Table Display: A built-in table in the top-right corner lists each symbol’s real-time percentage change, plus the total weighted momentum.
Alerts:
Configure alerts for when the weighted momentum crosses above or below user-defined thresholds.
Helps you catch major shifts in sentiment across multiple symbols.
How To Use
Select Symbols & Weights: In the indicator’s settings, specify the tickers you want to monitor and their corresponding weights. Weights default to 1 (equal weighting).
Watch the Bars vs. Zero:
Bars above zero mean a positive weighted momentum (the basket is collectively moving up).
Bars below zero mean negative weighted momentum (the basket is collectively under pressure).
Check the Yellow Line: The EMA of momentum.
If the bars consistently stay above the line, short-term momentum is stronger than its recent average.
If the bars dip below the line, momentum is weakening relative to its average.
Review the Table: Quick snapshot of each symbol’s daily percentage change plus the total basket momentum, all color-coded red or green.
Caution & Tips
This indicator measures rate of change, not absolute price levels. A rising momentum can still be part of a larger downtrend.
Always combine momentum readings with other technical and/or fundamental signals for confirmation.
For better reliability, experiment with different smoothing lengths to suit your trading style (shorter for scalping, longer for swing or positional approaches).
Oscillators
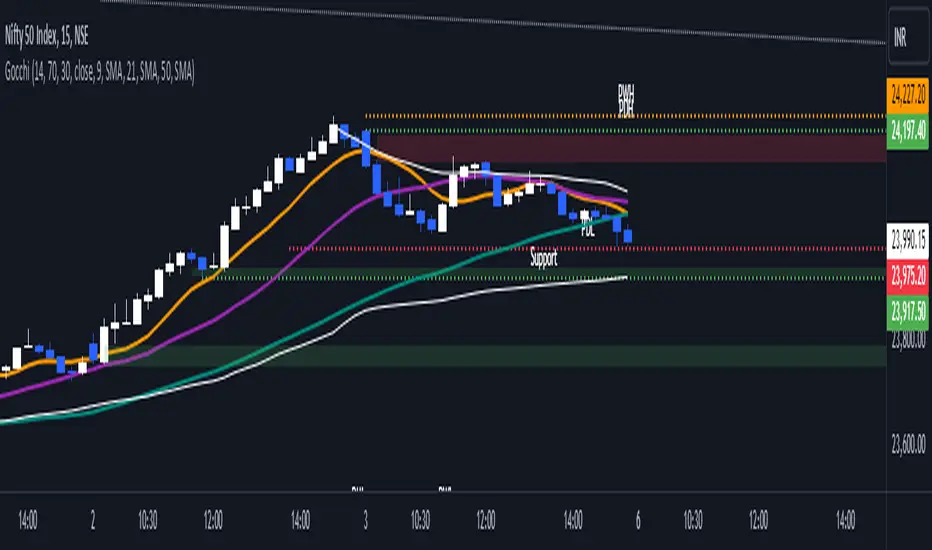
GocchiMulti-Indicator: RSI & Moving Averages
This versatile TradingView indicator combines two essential tools for technical analysis—Relative Strength Index (RSI) and Moving Averages (MAs)—into one comprehensive solution. It is designed for traders seeking flexibility, customization, and efficiency in their charting experience.
Features:
Relative Strength Index (RSI):
Customizable RSI length.
Adjustable overbought and oversold levels.
Selectable source input (e.g., close, open, high, low).
Visual levels for overbought and oversold zones, aiding in quick trend and momentum identification.
Three Moving Averages:
Three independently customizable moving averages.
Options for Simple Moving Average (SMA) or Exponential Moving Average (EMA) for each line.
Adjustable lengths for short-, medium-, and long-term trend tracking.
Visual Enhancements:
Clear, color-coded plots for RSI and each moving average.
Overbought and oversold zones are highlighted with horizontal dotted lines.
Alerts:
Get notified when RSI crosses above the overbought level or below the oversold level.
Alerts help traders stay on top of potential market reversals or breakout opportunities.
Use Cases:
RSI Analysis: Spot overbought or oversold conditions to identify potential reversals.
Trend Following: Use moving averages to confirm trends or identify crossovers for potential entry and exit points.
Custom Strategies: Tailor the settings to fit specific trading styles, such as scalping, swing trading, or long-term investing.
This all-in-one indicator streamlines your analysis by reducing the need for multiple overlays, making your charts cleaner and more actionable. Whether you're a novice or an experienced trader, this tool provides the flexibility and insights you need to succeed in any market condition.
Dynamic Market ScannerDynamic Market Scanner is a powerful tool for analyzing financial markets, combining a variety of indicators to provide clear and understandable signals.
Key Features:
- Signal Generation:
The main signals "Buy", "Sell", and "Hold" are formed based on the analysis of indicators:
- MACD
- RSI
- SMA
- EMA
- WMA
- Hull MA
Additional Analytical Tools:
- ATR is used to assess volatility and helps to understand the risk of the current market situation.
- SMA Ichimoku does not generate signals but is used to assess their accuracy.
- If the price is above the SMA, "Buy" signals are more likely, as this confirms the strength of the upward movement.
- If the price is below the SMA, "Buy" signals require additional confirmations.
Dashboard:
Displays the current price position relative to the indicators, helping the trader understand how strong or weak the current signals are.
Advantages of Using:
1. Signal Filtering:
The price position relative to the SMA Ichimoku helps to assess the likelihood of successful trades.
2. Volatility Analysis:
ATR provides additional information about risks and market fluctuations.
3. Comprehensive Approach:
Signal generation is based on a combination of key indicators, offering a multifaceted view of the market.
Explanation of Percent Calculation in the Table:
- The table shows the values of indicators such as MACD, ATR, EMA, SMA, WMA, and Hull MA in percentages. Percentages are calculated based on the current value of the indicator relative to its maximum and minimum.
- Percentages are displayed for each indicator, allowing traders to assess market conditions based on their current values.
Dynamic Market Scanner will become a reliable assistant in your technical analysis toolkit, providing a comprehensive overview of market conditions and helping to make informed trading decisions.

HMA Buy Sell Signals - Profit ManagerNote : Settings should be adjusted according to the selected time frame. Try to find the best setting according to the profitability rate
Overall Functionality
This script combines several trading tools to create a comprehensive system for trend analysis, trade execution, and performance tracking. Users can identify market trends using specific moving averages and RSI indicators while managing profit and loss levels automatically.
Trend Detection and Trade Signals
Hull Moving Averages (HMA):
Two HMAs (a faster one and a slower one) are used to determine the market trend.
A buy signal is generated when the faster HMA crosses above the slower HMA.
Conversely, a sell signal is triggered when the faster HMA crosses below the slower one.
Visual Feedback:
Trend lines on the chart change color to reflect the trend direction (e.g., green for upward trends and red for downward trends).
Trade Levels and Management
Entry, Take-Profit, and Stop-Loss Levels:
When the trend shifts upwards, the script calculates entry, take-profit, and stop-loss levels based on the opening price.
Similarly, for downward trends, these levels are determined for short trades.
Commission Tracking:
Each trade includes a commission cost, which is factored into net profit and loss calculations.
Dynamic Labels:
Entry, take-profit, and stop-loss levels are visually marked on the chart for easier tracking.
Performance Tracking
Profit and Loss Tracking:
The script keeps a running total of profits, losses, and commissions for both long and short trades.
It also calculates the net profit after all costs are considered.
Performance Table:
A table is displayed on the chart summarizing:
The number of trades.
Total profit and loss for long and short positions.
Commission costs.
Net profit.
Fractal Support and Resistance
Dynamic Lines:
The script identifies the most recent significant highs and lows using fractals.
It draws support and resistance lines that automatically update as new fractals form.
Simplified Visuals:
The chart always shows the last two support and resistance lines, keeping the visualization clean and focused.
RSI-Based Signals
Overbought and Oversold Levels:
RSI is used to identify overbought (above 80) and oversold (below 20) conditions.
The script generates buy signals at oversold levels and sell signals at overbought levels.
Chart Indicators:
Arrows and labels appear on the chart to highlight these RSI-based opportunities.
Customization
The script allows users to customize key parameters such as:
Moving average lengths for trend detection.
Take-profit and stop-loss percentages.
Timeframes for backtesting.
Starting capital and commission rates.
Conclusion
This script is a versatile tool for traders, combining trend detection, automated trade management, and visual feedback. It simplifies decision-making by providing clear signals and tracking performance metrics, making it suitable for both beginners and experienced traders.
* The most recently drawn fractals represent potential support and resistance levels. If the price aligns with these levels at the time of entering a trade, it may indicate a likelihood of reversal. In such cases, it’s advisable to either avoid entering the trade altogether or proceed with increased caution.

The JewelThe Jewel is a comprehensive momentum and trend-based indicator designed to give traders clear insights into potential market shifts. By integrating RSI, Stochastic, and optional ADX filters with an EMA-based trend filter, this script helps identify high-conviction entry and exit zones for multiple trading styles, from momentum-based breakouts to mean-reversion setups.
Features
Momentum Integration:
Leverages RSI and Stochastic crossovers for real-time momentum checks, reducing noise and highlighting potential turning points.
Optional ADX Filter:
Analyzes market strength; only triggers signals when volatility and directional movement suggest strong follow-through.
EMA Trend Filter:
Identifies broad market bias (bullish vs. bearish), helping traders focus on higher-probability setups by aligning with the prevailing trend.
Caution Alerts:
Flags potentially overbought or oversold conditions when both RSI and Stochastic reach extreme zones, cautioning traders to manage risk or tighten stops.
Customizable Parameters:
Fine-tune RSI, Stochastic, ADX, and EMA settings to accommodate various assets, timeframes, and trading preferences.
How to Use
Momentum Breakouts: Watch for RSI cross above a set threshold and Stochastic cross up, confirmed by ADX strength and alignment with the EMA filter for potential breakout entries.
Mean Reversion: Look for caution signals (RSI & Stoch extremes) as early warnings for trend slowdown or reversal opportunities.
Trend Continuation: In trending markets, rely on the EMA filter to stay aligned with the primary direction. Use momentum crosses (RSI/Stochastic) to time add-on entries or exits.
Important Notes
Non-Investment Advice
The Jewel is a technical analysis tool and does not constitute financial advice. Always use proper risk management and consider multiple confirmations when making trading decisions.
No Warranty
This indicator is provided as-is, without warranty or guarantees of performance. Traders should backtest and verify its effectiveness on their specific instruments and timeframes.
Collaborate & Share
Feedback and suggestions are welcome! Engaging with fellow traders can help refine and adapt The Jewel for diverse market conditions, strengthening the TradingView community as a whole.
Happy Trading!
If you find this script valuable, please share your feedback, ideas, or enhancements. Collaboration fosters a more insightful trading experience for everyone.

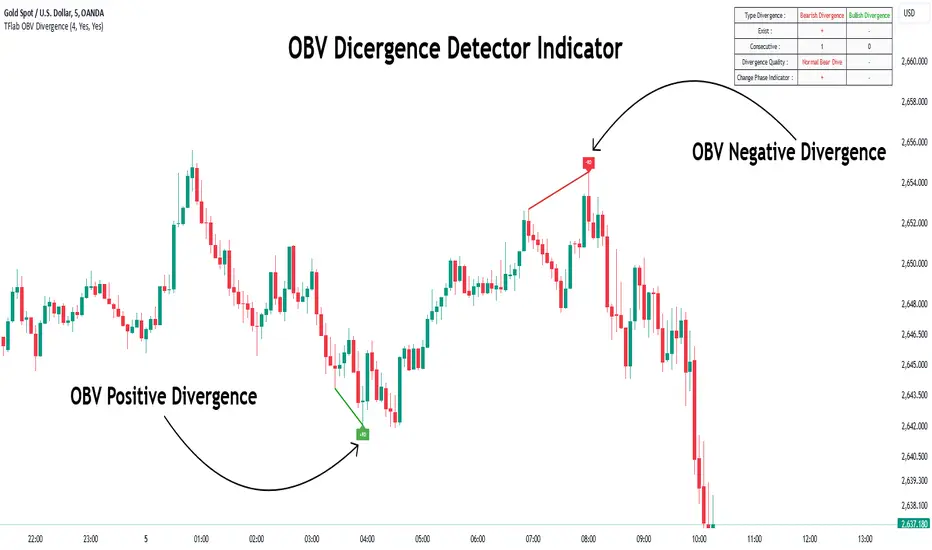
OBV Divergence Indicator [TradingFinder] On-Balance Vol Reversal🔵 Introduction
The On-Balance Volume (OBV) indicator, introduced by Joe Granville in 1963, is a powerful technical analysis tool used to measure buying and selling pressure based on trading volume and price.
By aggregating trading volume—adding it on positive days and subtracting it on negative days—OBV creates a cumulative line that reflects market volume pressure, making it valuable for confirming trends, identifying entry and exit points, and forecasting potential price movements.
Divergences between price and OBV often provide significant signals. A bearish divergence occurs when the price forms higher highs while the OBV line forms lower highs. This discrepancy indicates that upward momentum is weakening, increasing the likelihood of a downward trend.
In contrast, a bullish divergence happens when the price makes lower lows, but the OBV line forms higher lows. This suggests increasing buying pressure and the potential for an upward trend reversal.
For instance, if the price is rising but the OBV trendline is falling, it may signal a bearish divergence, warning of a possible price decline. Conversely, if the price is falling while the OBV line is rising, this could signal a bullish divergence, indicating a possible price recovery. These signals are particularly useful for identifying market turning points.
OBV often acts as a leading indicator, moving ahead of price changes. For example, a rising OBV alongside stable or declining prices can signal an impending upward breakout.
Conversely, a declining OBV with rising prices may indicate that the current uptrend is losing strength. Traders using this strategy often consider entering positions at breakout levels while setting stop losses near recent swing highs or lows to manage risk effectively.
This integration highlights how OBV divergences can provide actionable insights for predicting price movements and managing trades efficiently.
Bullish Divergence :
Bearish Divergence :
🔵 How to Use
The OBV indicator, as a cumulative tool, assists analysts in comparing volume and price changes to identify new trends and key levels for entering or exiting trades. Beyond confirming existing trends, it is particularly effective in analyzing positive and negative divergences between price and volume, providing valuable signals for trading decisions.
🟣 Bullish Divergence
A bullish divergence occurs when the price continues its downward or stable trend, but the OBV line starts rising, forming a higher low compared to its previous low. This suggests increasing volume on up days relative to down days and often signals a reversal to the upside.
For instance, if an asset's price stabilizes near a support level but the OBV line shows an upward trend, this divergence could present an opportunity to enter a long position.
🟣 Bearish Divergence
A bearish divergence occurs when the price forms higher highs, but the OBV line declines, creating lower highs compared to previous peaks. This indicates decreasing volume on up days relative to down days and often acts as a warning for a reversal to the downside.
For example, if an asset’s price approaches a resistance level while OBV starts declining, this divergence may signal the beginning of a downtrend and could indicate a good time to exit long trades or enter short positions.
🔵 Setting
Period : The "Period" setting allows you to define the number of bars or intervals for "Periodic" and "EMA" modes. A shorter period captures more short-term movements, while a longer period smooths out the fluctuations and provides a broader view of market trends.
You can enable or disable labels to highlight key levels or divergences and tables to show numerical details like values and divergence types. These options allow for a customized chart display.
🔵 Table
The following table breaks down the main features of the oscillator. It covers four critical categories: Exist, Consecutive, Divergence Quality, and Change Phase Indicator.
Exist : If divergence is detected, a "+" will appear in this row.
Consecutive: Shows the number of consecutive divergences that have formed in a short period.
Divergence Quality : Evaluates the quality of the divergence based on the number of occurrences. One is labeled "Normal," two are "Good," and three or more are considered "Strong."
Change Phase Indicator : If a phase change is detected between two oscillation peaks, this is marked in the table.
🔵 Conclusion
The OBV (On Balance Volume) indicator is a simple yet effective tool in technical analysis that combines volume and price changes to provide a comprehensive view of market buying and selling pressure. By identifying positive and negative divergences, OBV enables analysts to detect early signs of trend reversals and refine their trading strategies.
Divergences in OBV often precede price changes, making it a leading indicator for predicting market movements. Using OBV alongside other technical tools can enhance decision-making accuracy and help traders identify better entry and exit points. However, it is essential to consider the limitations of OBV, such as the potential for signal errors and the impact of sudden news events.
Ultimately, OBV serves as a complementary tool in technical analysis, aiding in trend identification, signal confirmation, and risk management. A thoughtful application of this indicator, in combination with other analytical tools, can create valuable opportunities for profiting in financial markets.
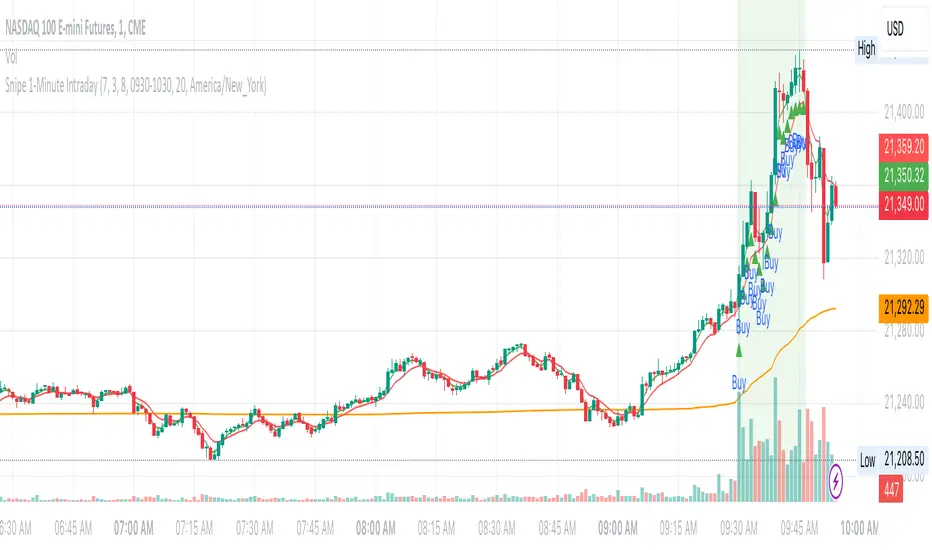
Snipe 1-Minute IntradayPurpose
This script demonstrates a simple intraday approach using RSI, EMAs, VWAP, and an optional volume filter. It plots visual buy (bullish) and sell (bearish) signals on the chart under certain conditions. You can use it as a starting point to explore or develop your own intraday strategies.
Key Features
1. VWAP (Volume Weighted Average Price)
Plots the built-in VWAP for additional context on intraday price action.
2. EMA Crossover
Uses two EMAs (fast and slow). A bullish signal triggers when the fast EMA is above the slow EMA, and a bearish signal triggers when the fast EMA is below the slow EMA.
3. RSI Momentum Filter
An RSI reading above 50 indicates bullish momentum; below 50 indicates bearish momentum.
4. Volume Filter (Optional)
Compares the current bar’s volume against the average volume (over a user-defined period). When enabled, signals only appear if the current volume exceeds the average.
5. Time Window (Optional)
Allows you to define a specific time window (e.g., the first hour of trading) for valid signals. You can enable or disable this filter and set your preferred time zone.
How the Signals Are Generated
• Bullish Signal
o Occurs when:
1. Price is above VWAP.
2. Fast EMA is above Slow EMA.
3. RSI is above 50.
4. (Optional) Current volume exceeds the average volume if the volume filter is enabled.
5. (Optional) The chart’s timestamp is within the specified session if the time filter is enabled.
A green triangle is plotted below the bar, and an optional background highlight is shown.
• Bearish Signal
Occurs when the conditions are inverted (price below VWAP, fast EMA below slow EMA, RSI below 50, volume filter and time window—if enabled—are satisfied).
A red triangle is plotted above the bar, and an optional background highlight is shown.
How to Use
1. Load on a 1-Minute Chart (Recommended)
This script is intended for intraday timeframes (specifically 1-minute). Feel free to experiment with other timeframes.
2. Adjust Inputs
You can modify the RSI length, EMA lengths, and volume lookback to suit your preferences or trading style.
If you prefer signals outside the default session hours, turn off “Use Time Filter for Signals?” or change the session window and time zone.
3. Enable or Disable Volume Filter
Turn this on if you only want signals during higher-than-average volume bars.
4. Combine with Other Analysis
This script can be used as a visual tool; however, it is not a complete trading system by itself. Consider additional technical or fundamental analysis to validate your trading decisions.
5. Risk Management
Always practice sound risk management. Setting appropriate stop-losses or using position sizing techniques can help manage potential losses.
Important Notes and Disclaimers
• Educational Only: This script is for demonstration and educational purposes and does not guarantee future results.
• No Financial Advice: Nothing here should be construed as financial or investment advice. Always do your own research and consider consulting a qualified financial professional.
• Test Before Using Live: If you plan to incorporate this script into a strategy, backtest it on historical data and consider forward-testing on a demo account.
• License: This code is subject to the Mozilla Public License 2.0.
Regime Classifier Oscillator (AiBitcoinTrend)The Regime Classifier Oscillator (AiBitcoinTrend) is an advanced tool for understanding market structure and detecting dynamic price regimes. By combining filtered price trends, clustering algorithms, and an adaptive oscillator, it provides traders with detailed insights into market phases, including accumulation, distribution, advancement, and decline.
This innovative tool simplifies market regime classification, enabling traders to align their strategies with evolving market conditions effectively.
👽 What is a Regime Classifier, and Why is it Useful?
A Regime Classifier is a concept in financial analysis that identifies distinct market conditions or "regimes" based on price behavior and volatility. These regimes often correspond to specific phases of the market, such as trends, consolidations, or periods of high or low volatility. By classifying these regimes, traders and analysts can better understand the underlying market dynamics, allowing them to adapt their strategies to suit prevailing conditions.
👽 Common Uses in Finance
Risk Management: Identifying high-volatility regimes helps traders adjust position sizes or hedge risks.
Strategy Optimization: Traders tailor their approaches—trend-following strategies in trending regimes, mean-reversion strategies in consolidations.
Forecasting: Understanding the current regime aids in predicting potential transitions, such as a shift from accumulation to an upward breakout.
Portfolio Allocation: Investors allocate assets differently based on market regimes, such as increasing cash positions in high-volatility environments.
👽 Why It’s Important
Markets behave differently under varying conditions. A regime classifier provides a structured way to analyze these changes, offering a systematic approach to decision-making. This improves both accuracy and confidence in navigating diverse market scenarios.
👽 How We Implemented the Regime Classifier in This Indicator
The Regime Classifier Oscillator takes the foundational concept of market regime classification and enhances it with advanced computational techniques, making it highly adaptive.
👾 Median Filtering: We smooth price data using a custom median filter to identify significant trends while eliminating noise. This establishes a baseline for price movement analysis.
👾 Clustering Model: Using clustering techniques, the indicator classifies volatility and price trends into distinct regimes:
Advance: Strong upward trends with low volatility.
Decline: Downward trends marked by high volatility.
Accumulation: Consolidation phases with subdued volatility.
Distribution: Topping or bottoming patterns with elevated volatility.
This classification leverages historical price data to refine cluster boundaries dynamically, ensuring adaptive and accurate detection of market states.
Volatility Classification: Price volatility is analyzed through rolling windows, separating data into high and low volatility clusters using distance-based assignments.
Price Trends: The interaction of price levels with the filtered trendline and volatility clusters determines whether the market is advancing, declining, accumulating, or distributing.
👽 Dynamic Cycle Oscillator (DCO):
Captures cyclic behavior and overlays it with smoothed oscillations, providing real-time feedback on price momentum and potential reversals.
Regime Visualization:
Regimes are displayed with intuitive labels and background colors, offering clear, actionable insights directly on the chart.
👽 Why This Implementation Stands Out
Dynamic and Adaptive: The clustering and refit mechanisms adapt to changing market conditions, ensuring relevance across different asset classes and timeframes.
Comprehensive Insights: By combining price trends, volatility, and cyclic behaviors, the indicator provides a holistic view of the market.
This implementation bridges the gap between theoretical regime classification and practical trading needs, making it a powerful tool for both novice and experienced traders.
👽 Applications
👾 Regime-Based Trading Strategies
Traders can use the regime classifications to adapt their strategies effectively:
Advance & Accumulation: Favorable for entering or holding long positions.
Decline & Distribution: Opportunities for short positions or risk management.
👾 Oscillator Insights for Trend Analysis
Overbought/oversold conditions: Early warning of potential reversals.
Dynamic trends: Highlights the strength of price momentum.
👽 Indicator Settings
👾 Filter and Classification Settings
Filter Window Size: Controls trend detection sensitivity.
ATR Lookback: Adjusts the threshold for regime classification.
Clustering Window & Refit Interval: Fine-tunes regime accuracy.
👾 Oscillator Settings
Dynamic Cycle Oscillator Lookback: Defines the sensitivity of cycle detection.
Smoothing Factor: Balances responsiveness and stability.
Disclaimer: This information is for entertainment purposes only and does not constitute financial advice. Please consult with a qualified financial advisor before making any investment decisions.

Market Cycles
The Market Cycles indicator transforms market price data into a stochastic wave, offering a unique perspective on market cycles. The wave is bounded between positive and negative values, providing clear visual cues for potential bullish and bearish trends. When the wave turns green, it signals a bullish cycle, while red indicates a bearish cycle.
Designed to show clarity and precision, this tool helps identify market momentum and cyclical behavior in an intuitive way. Ideal for fine-tuning entries or analyzing broader trends, this indicator aims to enhance the decision-making process with simplicity and elegance.

DR Oscillator 8 * Measures price deviation: Calculates the percentage difference between the closing price and a simple moving average.
* Defines upper and lower limits: User-defined upper and lower limits determine overbought and oversold conditions.
* Signal line: A simple moving average of the deviation is plotted as a signal line.
* Deviation smoothing (optional): The deviation can be smoothed using a moving average to create a smoother line.
* Additional signal line (optional): An additional signal line can be added for further analysis.
* Visual representation: The oscillator is plotted with different colors to indicate overbought, oversold, or neutral conditions.
* Background coloring: The background color changes based on the oscillator's value to provide visual cues for buy or sell signals.
In summary:
The DR Oscillator helps traders identify potential buying and selling opportunities by measuring the extent to which a security's price has deviated from its moving average. When the oscillator moves above the upper limit, it suggests that the asset may be overbought and due for a price correction. Conversely, when it moves below the lower limit, it may indicate an oversold condition and a potential buying opportunity.
However, it's important to note that the DR Oscillator is just one tool and should be used in conjunction with other technical indicators and fundamental analysis for more accurate trading decisions.
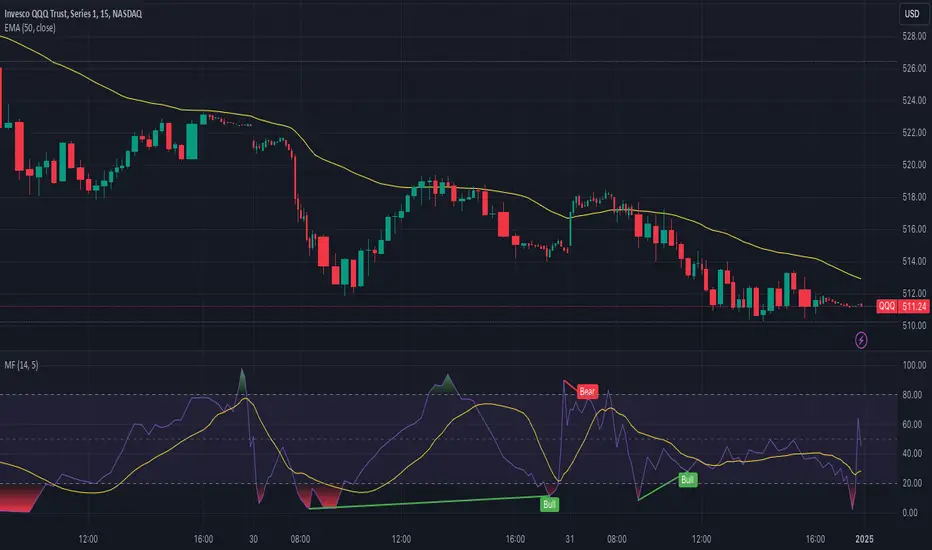
Money Flow ExtendedMoney Flow Extended (MF)
Definition
The Money Flow Extended (MF) indicator brings together the functionality of the Money Flow Index indicator (MFI) , a tool created by Gene Quong and Avrum Soudack and used in technical analysis for measuring buying and selling pressure, and The Relative Strength Index (RSI) , a well versed momentum based oscillator created by J.Welles Wilder Jr., which is used to measure the speed (velocity) as well as the change (magnitude) of directional price movements.
History
As the Money Flow Index (MFI) is quite similar to The Relative Strength Index (RSI), essentially the RSI with the added aspect of volume, adding a Moving Average, divergence calculation, oversold and overbought gradients, facilitates the transition from RSI, making the use of MFI pretty similar.
What to look for
Overbought/Oversold
When momentum and price rise fast enough, at a high enough level, eventual the security will be considered overbought. The opposite is also true. When price and momentum fall far enough, they can be considered oversold. Traditional overbought territory starts above 80 and oversold territory starts below 20. These values are subjective however, and a technical analyst can set whichever thresholds they choose.
Divergence
MF Divergence occurs when there is a difference between what the price action is indicating and what MF is indicating. These differences can be interpreted as an impending reversal. Specifically, there are two types of divergences, bearish and bullish.
Bullish MFI Divergence – When price makes a new low but MF makes a higher low.
Bearish MFI Divergence – When price makes a new high but MF makes a lower high.
Failure Swings
Failure swings are another occurrence which can lead to a price reversal. One thing to keep in mind about failure swings is that they are completely independent of price and rely solely on MF. Failure swings consist of four steps and are considered to be either Bullish (buying opportunity) or Bearish (selling opportunity).
Bullish Failure Swing
MF drops below 20 (considered oversold).
MF bounces back above 20.
MF pulls back but remains above 20 (remains above oversold)
MF breaks out above its previous high.
Bearish Failure Swing
MF rises above 80 (considered overbought)
MF drops back below 80
MF rises slightly but remains below 80 (remains below overbought)
MF drops lower than its previous low.
Summary
The Money Flow Extended (MF) can be a very valuable technical analysis tool. Of course, MF should not be used alone as the sole source for a trader’s signals or setups. MF can be combined with additional indicators or chart pattern analysis to increase its effectiveness.
Inputs
Length
The time period to be used in calculating the MF. 14 is the default.
Pivot Loopback
After how many bars you want the divergence to show, on the scale of 1-5. 5 is the default.
Calculate Divergence
Calculating divergences is needed in order for divergence alerts to fire.
Moving Average section
You can learn more about the inputs in the "Moving Average" section in this Help Center article .
Style
MF
Can toggle the visibility of the MF as well as the visibility of a price line showing the actual current value of the MF. Can also select the MF Line's color, line thickness and visual style.
MF-based MA
Can toggle the visibility of the MF-based MA as well as the visibility of a price line showing the actual current MA value. Can also select its color, line thickness and line style.
MF Upper Band
Can toggle the visibility of the Upper Band as well as sets the boundary, on the scale of 1-100, for the Upper Band (80 is the default). The color, line thickness and line style can also be determined.
MF Middle Band
Can toggle the visibility of the Middle Band as well as sets the boundary, on the scale of 1-100, for the Middle Band (50 is the default). The color, line thickness and line style can also be determined.
MF Lower Band
Can toggle the visibility of the Lower Band as well as sets the boundary, on the scale of 1-100, for the Lower Band (20 is the default). The color, line thickness and line style can also be determined.
MF Background Fill
Toggles the visibility of a Background color within the MF's boundaries. Can also change the Color itself as well as the opacity.
Overbought Gradient Fill
Can toggle the visibility of the Overbought Gradient Fill. Can also select its colors combination.
Oversold Gradient Fill
Can toggle the visibility of the Oversold Gradient Fill. Can also select its colors combination.
Precision
Sets the number of decimal places to be left on the indicator's value before rounding up. The higher this number, the more decimal points will be on the indicator's value.
MACD Pseudo Super Smoother [MACDPSS]The MACD Pseudo Super Smoother (MACDPSS) is a variation of the classic Moving Average Convergence Divergence (MACD) indicator. It utilizes the Pseudo Super Smoother (PSS) filter, a Finite Impulse Response (FIR) filter, to smooth both the MACD line and the signal line, providing a potentially refined representation of momentum compared to the traditional MACD which typically uses Exponential Moving Averages (EMAs).
The PSS, inspired by the Super Smoother filter (an Infinite Impulse Response (IIR) filter), aims to reduce noise while minimizing lag. The MACDPSS leverages this FIR implementation to create a unique MACD variant. The core concept of MACD, which involves analyzing the relationship between two moving averages of different lengths to identify momentum shifts, remains intact.
Filter Types and Customization
The MACDPSS offers independent control over the smoothing applied to the MACD line and the signal line through two "Filter Style" inputs:
Oscillator MA Type: This setting determines the filter type used to calculate the fast and slow moving averages that form the basis of the MACD line.
Signal Line MA Type: This setting controls the filter type used to smooth the MACD line, generating the signal line.
Each of these settings allows a choice between two distinct PSS filter types:
Type 1: Provides a smoother output with a more gradual response, characterized by greater attenuation of high-frequency components.
Type 2: Exhibits increased reactivity, allowing for a faster response to shifts in momentum, but with a potential for overshoot.
This dual-filter approach provides flexibility in tailoring the indicator's responsiveness and smoothness to individual preferences and specific market conditions. The user can, for example, choose a smoother Type 1 filter for the MACD line and a more reactive Type 2 filter for the signal line, or vice-versa.
Calculations
The MACDPSS calculates the MACD line by subtracting the slow moving average from the fast moving average, both derived using the PSS filter with the selected "Oscillator MA Type." The signal line is then calculated by applying the PSS filter with the selected "Signal Line MA Type" to the MACD line. The histogram represents the difference between the MACD line and the signal line.
Interpretation
The interpretation of the MACDPSS is similar to the standard MACD. Crossovers between the MACD line and the signal line, the position of the MACD line relative to the zero line, and the slope and direction of the histogram are all used to gauge momentum and potential trend changes.
Disclaimer
The MACDPSS, while inspired by the Super Smoother, utilizes a distinct FIR approximation (the PSS). Therefore, its behavior will not perfectly mirror that of a MACD calculated using IIR filters. The PSS is designed to be a rough approximation. This indicator should be used in conjunction with other technical analysis tools, and users should be aware of the inherent differences between FIR and IIR filter characteristics when interpreting the indicator's signals. Like any moving average based indicator, the MACDPSS is a lagging indicator, although it tries to improve it. The novelty of this indicator comes from applying a unique FIR filter to a classic momentum oscillator in a configurable way.

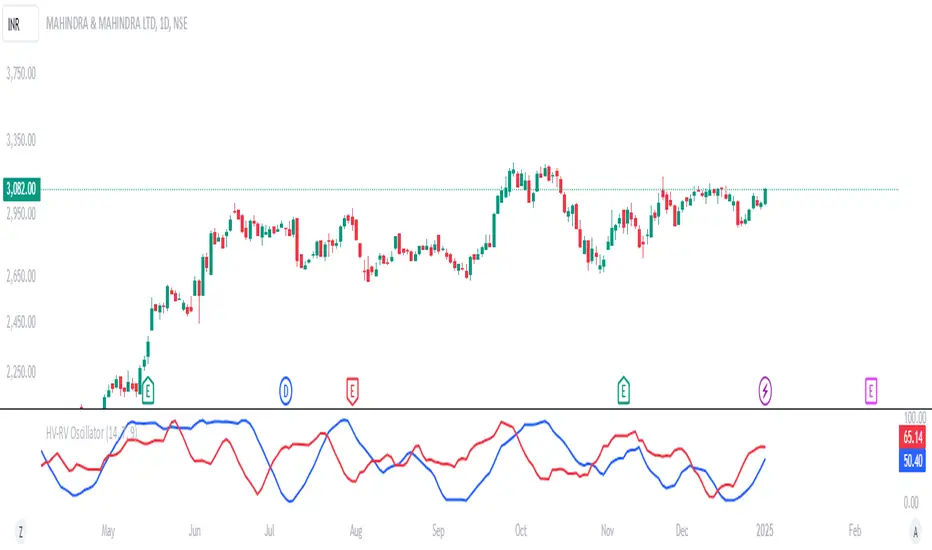
HV-RV Oscillator by DINVESTORQ(PRABIR DAS)Description:
The HV-RV Oscillator is a powerful tool designed to help traders track and compare two types of volatility measures: Historical Volatility (HV) and Realized Volatility (RV). This indicator is useful for identifying periods of market volatility and can be employed in various trading strategies. It plots both volatility measures on a normalized scale (0 to 100) to allow easy comparison and analysis.
How It Works:
Historical Volatility (HV):
HV is calculated by taking the log returns of the closing prices and finding the standard deviation over a specified period (default is 14 periods).
The value is then annualized assuming 252 trading days in a year.
Realized Volatility (RV):
RV is based on the True Range, which is the maximum of the current high-low range, the difference between the high and the previous close, and the difference between the low and the previous close.
Like HV, the standard deviation of the True Range over a specified period is calculated and annualized.
Normalization:
Both HV and RV values are normalized to a 0-100 scale, making it easy to see their relative magnitude over time.
The highest and lowest values within the period are used to normalize the data, which smooths out short-term volatility spikes.
Smoothing:
The normalized values of both HV and RV are then smoothed using a Simple Moving Average (SMA) to reduce noise and provide a clearer trend.
Crossover Signals:
Buy Signal : When the Normalized HV crosses above the Normalized RV, it indicates that the historical volatility is increasing relative to the realized volatility, which could be interpreted as a buy signal.
Sell Signal : When the Normalized HV crosses below the Normalized RV, it suggests that the historical volatility is decreasing relative to the realized volatility, which could be seen as a sell signal.
Features:
Two Volatility Lines: The blue line represents Normalized HV, and the orange line represents Normalized RV.
Neutral Line: A gray dashed line at the 50 level indicates a neutral state between the two volatility measures.
Buy/Sell Markers: Green upward arrows are shown when the Normalized HV crosses above the Normalized RV, and red downward arrows appear when the Normalized HV crosses below the Normalized RV.
Inputs:
HV Period: The number of periods used to calculate Historical Volatility (default = 14).
RV Period: The number of periods used to calculate Realized Volatility (default = 14).
Smoothing Period: The number of periods used for smoothing the normalized values (default = 3).
How to Use:
This oscillator is designed for traders who want to track the relationship between Historical Volatility and Realized Volatility.
Buy signals occur when HV increases relative to RV, which can indicate increased market movement or potential breakout conditions.
Sell signals occur when RV is greater than HV, signaling reduced volatility or potential trend exhaustion.
Example Use Cases:
Breakout/Trend Strategy: Use the oscillator to identify potential periods of increased volatility (when HV crosses above RV) for breakout trades.
Mean Reversion: Use the oscillator to detect periods of low volatility (when RV crosses above HV) that might signal a return to the mean or consolidation.
This tool can be used on any asset class such as stocks, forex, commodities, or indices to help you make informed decisions based on the comparison of volatility measures.
NOTE: FOR INTRDAY PURPOSE USE 30/7/9 AS SETTING AND FOR DAY TRADE USE 14/7/9
Dual Bayesian For Loop [QuantAlgo]Discover the power of probabilistic investing and trading with Dual Bayesian For Loop by QuantAlgo , a cutting-edge technical indicator that brings statistical rigor to trend analysis. By merging advanced Bayesian statistics with adaptive market scanning, this tool transforms complex probability calculations into clear, actionable signals—perfect for both data-driven traders seeking statistical edge and investors who value probability-based confirmation!
🟢 Core Architecture
At its heart, this indicator employs an adaptive dual-timeframe Bayesian framework with flexible scanning capabilities. It utilizes a configurable loop start parameter that lets you fine-tune how recent price action influences probability calculations. By combining adaptive scanning with short-term and long-term Bayesian probabilities, the indicator creates a sophisticated yet clear framework for trend identification that dynamically adjusts to market conditions.
🟢 Technical Foundation
The indicator builds on three innovative components:
Adaptive Loop Scanner: Dynamically evaluates price relationships with adjustable start points for precise control over historical analysis
Bayesian Probability Engine: Transforms market movements into probability scores through statistical modeling
Dual Timeframe Integration: Merges immediate market reactions with broader probability trends through custom smoothing
🟢 Key Features & Signals
The Adaptive Dual Bayesian For Loop transforms complex calculations into clear visual signals:
Binary probability signal displaying definitive trend direction
Dynamic color-coding system for instant trend recognition
Strategic L/S markers at key probability reversals
Customizable bar coloring based on probability trends
Comprehensive alert system for probability-based shifts
🟢 Practical Usage Tips
Here's how you can get the most out of the Dual Bayesian For Loop :
1/ Setup:
Add the indicator to your TradingView chart by clicking on the star icon to add it to your favorites ⭐️
Start with default source for balanced price representation
Use standard length for probability calculations
Begin with Loop Start at 1 for complete price analysis
Start with default Loop Lookback at 70 for reliable sampling size
2/ Signal Interpretation:
Monitor probability transitions across the 50% threshold (0 line)
Watch for convergence of short and long-term probabilities
Use L/S markers for potential trade signals
Monitor bar colors for additional trend confirmation
Configure alerts for significant trend crossovers and reversals, ensuring you can act on market movements promptly, even when you’re not actively monitoring the charts
🟢 Pro Tips
Fine-tune loop parameters for optimal sensitivity:
→ Lower Loop Start (1-5) for more reactive analysis
→ Higher Loop Start (5-10) to filter out noise
Adjust probability calculation period:
→ Shorter lengths (5-10) for aggressive signals
→ Longer lengths (15-30) for trend confirmation
Strategy Enhancement:
→ Compare signals across multiple timeframes
→ Combine with volume for trade validation
→ Use with support/resistance levels for entry timing
→ Integrate other technical tools for even more comprehensive analysis

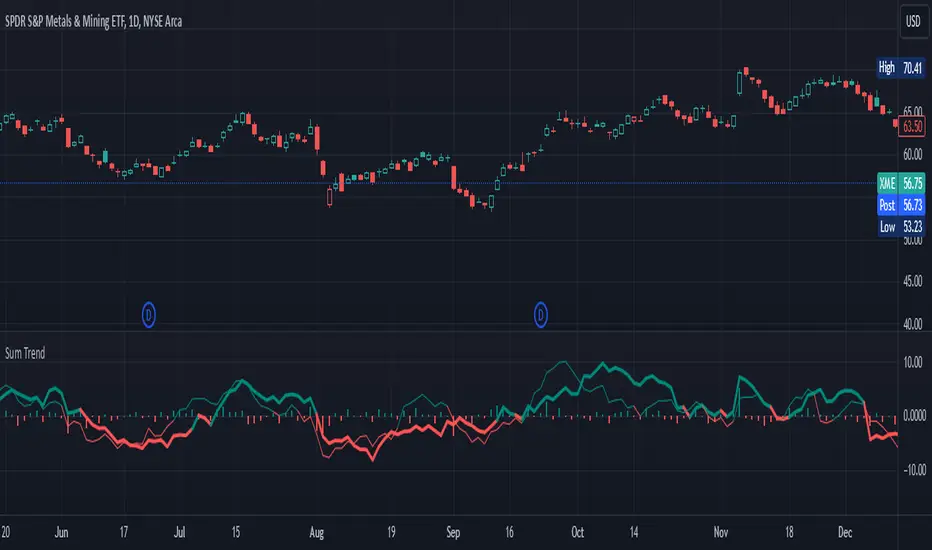
Sum Trend OscillatorPublishing my first indicator.
This one accumulates bars over two short period and divide that by the difference between a long term mean value of high-low
Buy/Sell signal is when both line cross at close below or above the center line.
Soul Button Scalping (1 min chart) V 1.0Indicator Description
- P Signal: The foundational buy signal. It should be confirmed by observing RSI divergence on the 1-minute chart.
- Green, Orange, and Blue Signals: Three buy signals generated through the combination of multiple oscillators. These signals should also be cross-referenced with the RSI on the 1-minute chart.
- Big White and Big Yellow Signals: These represent strong buy signals, triggered in extreme oversold conditions.
- BEST BUY Signal: The most reliable and powerful buy signal available in this indicator.
____________
Red Sell Signal: A straightforward sell signal indicating potential overbought conditions.
____________
Usage Guidance
This scalping indicator is specifically designed for use on the 1-minute chart, incorporating data from the 5-minute chart for added context. It is most effective when used in conjunction with:
• VWAP (Volume Weighted Average Price), already included in the indicator.
• RSI on the 1-minute chart, which should be opened as a separate indicator.
• Trendlines, structure breakouts, and price action analysis to confirm signals.
Intended for Crypto Scalping:
The indicator is optimized for scalping cryptocurrency markets.
____________
Future Enhancements:
• Integration of price action and candlestick patterns.
• A refined version tailored for trading futures contracts, specifically ES and MES in the stock market.

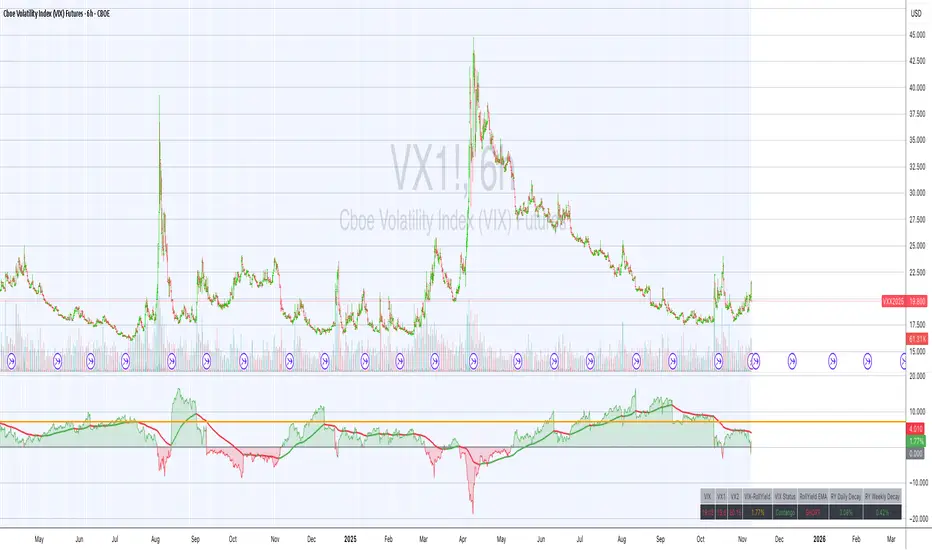
UM VIX status table and Roll Yield with EMA
Description :
This oscillator indicator gives you a quick snapshot of VIX, VIX futures prices, and the related VIX roll yield at a glance. When the roll yield is greater than 0, The front-month VX1 future contract is less than the next-month VX2 contract. This is called Contango and is typical for the majority of the time. If the roll yield falls below zero. This is considered backwardation where the front-month VX1 contract is higher than the value of the next-month VX2 contract. Contango is most common. When Backwardation occurs, there is usually high volatility present.
Features :
The red and green fill indicate the current roll yield with the gray line being zero.
An Exponential moving average is overlaid on the roll yield. It is red when trending down and green when trending up. If you right-click the indicator, you can set alerts for roll yield EMA color transitions green to red or red to green.
Suggested uses:
The author suggests a one hour chart using the 55 period EMA with a 60 minute setting in the indicator. This gives you a visual idea of whether the roll yield is rising or falling. The roll yield will often change directions at market turning points. For example if the roll yield EMA changes from red to green, this indicates a rising roll yield and volatility is subsiding. This could be considered bullish. If the roll yield begins falling, this indicates volatility is rising. This may be negative for stocks and indexes.
I look for short volatility positions (SVIX) when the roll yield is rising. I look for long volatility positions (VXX, UVXY, UVIX) when the roll yield begins falling. The indicator can be added to any chart. I suggest using the VX1, SPY, VIX, or other major stock index.
Set the time frame to your trading style. The default is 60 minutes. Note, the timeframe of the indicator does NOT utilize the current chart timeframe, it must be set to the desired timeframe. I manually input text on the chart indicator for understanding periods of Long and Short Volatility.
Settings and Defaults
The EMA is set to 55 by default and the table location is set to the lower right. The default time frame is 60 minutes. These features are all user configurable.
Other considerations
Sometimes the Tradingview data when a VX contract expires and another contract begins, may not transition cleanly and appear as a break on the chart. Tradingview is working on this as stated from my last request. This VX contract from one expiring contract to the next can be fixed on the price chart manually: ( Chart settings, Symbol, check the "Adjust for contract changes" box)
Observations
Pull up a one-hour chart of VX1 or SPY. Add this indicator. roll it back in time to see how the market and volatility reacts when the EMA changes from red to green and green to red. Adjust the EMA to your trading style and time frame. Use this for added confirmation of your long and short volatility trades with the Volatility ETFs SVIX, SVXY, VXX, UVXY, UVIX. or use it for long/short indexes such as SPY.
Buy/Sell Signals (MACD + RSI) 1HThis is a Pine Script indicator for TradingView that plots Buy/Sell signals based on the combination of MACD and RSI indicators on a 1-hour chart.
Description of the Code:
Indicator Setup:
The script is set to overlay the Buy/Sell signals directly on the price chart (using overlay=true).
The indicator is named "Buy/Sell Signals (MACD + RSI) 1H".
MACD Settings:
The MACD (Moving Average Convergence Divergence) uses standard settings of:
Fast Length: 12
Slow Length: 26
Signal Line Smoothing: 9
The MACD line and the Signal line are calculated using the ta.macd() function.
RSI Settings:
The RSI (Relative Strength Index) is calculated with a 14-period setting using the ta.rsi() function.
Buy/Sell Conditions:
Buy Signal:
Triggered when the MACD line crosses above the Signal line (Golden Cross).
RSI value is below 50.
Sell Signal:
Triggered when the MACD line crosses below the Signal line (Dead Cross).
RSI value is above 50.
Signal Visualization:
Buy Signals:
Green "BUY" labels are plotted below the price bars where the Buy conditions are met.
Sell Signals:
Red "SELL" labels are plotted above the price bars where the Sell conditions are met.
Chart Timeframe:
While the code itself doesn't enforce a specific timeframe, the name indicates that this indicator is intended to be used on a 1-hour chart.
To use it effectively, apply the script on a 1-hour chart in TradingView.
How It Works:
This indicator combines MACD and RSI to generate Buy/Sell signals:
The MACD identifies potential trend changes or momentum shifts (via crossovers).
The RSI ensures that Buy/Sell signals align with broader momentum (e.g., Buy when RSI < 50 to avoid overbought conditions).
When the defined conditions for Buy or Sell are met, visual signals (labels) are plotted on the chart.
How to Use:
Copy the code into the Pine Script editor in TradingView.
Save and apply the script to your 1-hour chart.
Look for:
"BUY" signals (green): Indicating potential upward trends or buying opportunities.
"SELL" signals (red): Indicating potential downward trends or selling opportunities.
This script is simple and focuses purely on providing actionable Buy/Sell signals based on two powerful indicators, making it ideal for traders who prefer a clean chart without clutter. Let me know if you need further customization!

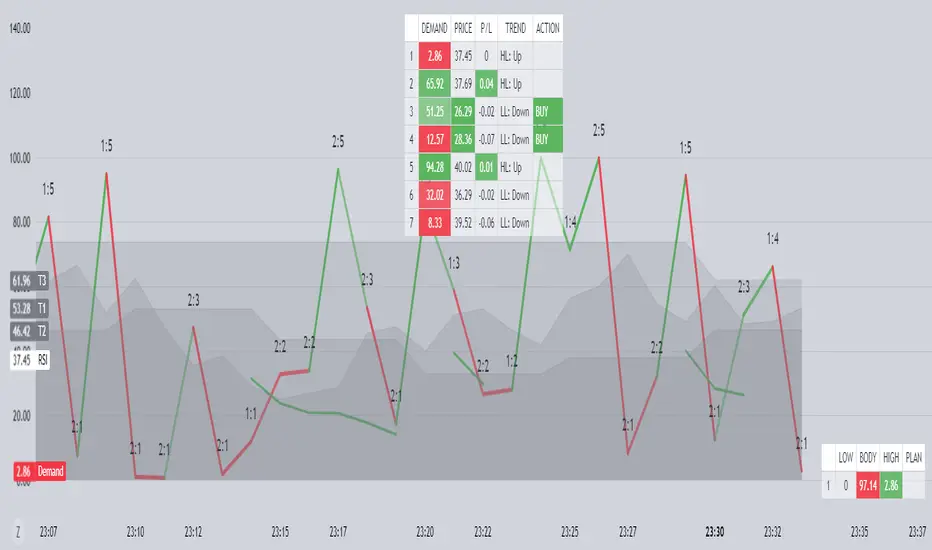
Nimu Market on DemandNimu Market On Demand is an innovative tool designed to provide a visual representation of market demand levels on a scale of 1 to 100. This scale is displayed at specific intervals , making it easy for users to understand market demand fluctuations in real time.
To enhance analysis, Nimu Market On Demand also incorporates the Relative Strength Index (RSI) with key thresholds at . RSI is a widely-used technical indicator that measures market strength and momentum, offering insights into overbought (excessive buying) or oversold (excessive selling) conditions.
The combination of the Demand graph and RSI enables users to:
Identify the right time to buy when the RSI falls below 30, signaling an oversold condition.
Determine the optimal time to sell when the RSI rises above 70, indicating an overbought condition.
With an integrated visualization, users can effortlessly observe demand patterns and combine them with RSI signals to make smarter and more strategic trading decisions. This tool is designed to help traders and investors maximize opportunities in a dynamic market environment.
Sunil High-Frequency Strategy with Simple MACD & RSISunil High-Frequency Strategy with Simple MACD & RSI
This high-frequency trading strategy uses a combination of MACD and RSI to identify quick market opportunities. By leveraging these indicators, combined with dynamic risk management using ATR, it aims to capture small but frequent price movements while ensuring tight control over risk.
Key Features:
Indicators Used:
MACD (Moving Average Convergence Divergence): The strategy uses a shorter MACD configuration (Fast Length of 6 and Slow Length of 12) to capture quick price momentum shifts. A MACD crossover above the signal line triggers a buy signal, while a crossover below the signal line triggers a sell signal.
RSI (Relative Strength Index): A shorter RSI length of 7 is used to gauge overbought and oversold market conditions. The strategy looks for RSI confirmation, with a long trade initiated when RSI is below the overbought level (70) and a short trade initiated when RSI is above the oversold level (30).
Risk Management:
Dynamic Stop Loss and Take Profit: The strategy uses ATR (Average True Range) to calculate dynamic stop loss and take profit levels based on market volatility.
Stop Loss is set at 0.5x ATR to limit risk.
Take Profit is set at 1.5x ATR to capture reasonable price moves.
Trailing Stop: As the market moves in the strategy’s favor, the position is protected by a trailing stop set at 0.5x ATR, allowing the strategy to lock in profits as the price moves further.
Entry & Exit Signals:
Long Entry: Triggered when the MACD crosses above the signal line (bullish crossover) and RSI is below the overbought level (70).
Short Entry: Triggered when the MACD crosses below the signal line (bearish crossover) and RSI is above the oversold level (30).
Exit Conditions: The strategy exits long or short positions based on the stop loss, take profit, or trailing stop activation.
Frequent Trades:
This strategy is designed for high-frequency trading, with trade signals occurring frequently as the MACD and RSI indicators react quickly to price movements. It works best on lower timeframes such as 1-minute, 5-minute, or 15-minute charts, but can be adjusted for different timeframes based on the asset’s volatility.
Customizable Parameters:
MACD Settings: Adjust the Fast Length, Slow Length, and Signal Length to tune the MACD’s sensitivity.
RSI Settings: Customize the RSI Length, Overbought, and Oversold levels to better match your trading style.
ATR Settings: Modify the ATR Length and multipliers for Stop Loss, Take Profit, and Trailing Stop to optimize risk management according to market volatility.
Important Notes:
Market Conditions: This strategy is designed to capture smaller, quicker moves in trending markets. It may not perform well during choppy or sideways markets.
Optimizing for Asset Volatility: Adjust the ATR multipliers based on the asset’s volatility to suit the risk-reward profile that fits your trading goals.
Backtesting: It's recommended to backtest the strategy on different assets and timeframes to ensure optimal performance.
Summary:
The Sunil High-Frequency Strategy leverages a simple combination of MACD and RSI with dynamic risk management (using ATR) to trade small but frequent price movements. The strategy ensures tight stop losses and reasonable take profits, with trailing stops to lock in profits as the price moves in favor of the trade. It is ideal for scalping or intraday trading on lower timeframes, aiming for quick entries and exits with controlled risk.

Range Channel by Atilla YurtsevenThis script creates a dynamic channel around a user-selected moving average (MA). It calculates the relative difference between price and the MA, then finds the average of the positive differences and the negative differences separately. Using these averages, it plots upper and lower bands around the MA as well as a histogram-like oscillator to show when price moves above or below the average thresholds.
How It Works
Moving Average Selection
The indicator allows you to choose among multiple MA types (SMA, EMA, WMA, Linear Regression, etc.). Depending on your preference, it calculates the chosen MA for the selected lookback period.
Relative Difference Calculation
It then computes the percentage difference between the source (typically the closing price) and the MA. (diff = (src / ma - 1) * 100)
Positive & Negative Averages
- Positive differences are averaged and represent how far the price typically moves above the MA.
- Negative differences are similarly averaged for when price moves below the MA.
Range Channel & Oscillator
- The channel is plotted around the MA using the average positive and negative differences (Upper Edge and Lower Edge).
- The “Untrended” histogram plots the difference (diff). Green bars occur when price is above the MA on average, and red bars when below. Two additional lines mark the upper and lower average thresholds on this histogram.
How to Use
Identify Overbought/Oversold Zones: The upper edge can serve as a dynamic overbought level, while the lower edge can suggest potential oversold conditions. When the histogram approaches or crosses these levels, it may signal price extremes relative to its average movement.
Trend Confirmation: Compare price action relative to the channel. If price and the histogram consistently remain above the MA and upper threshold, it could indicate a stronger bullish trend. If they remain below, it might signal a prolonged bearish trend.
Entry/Exit Timings:
- Entry: Traders can look for moments when price breaks back inside the channel from an extreme, anticipating a mean reversion.
- Exit: Watching how price interacts with these dynamic edges can help define stop-loss or take-profit points.
Because these thresholds adapt over time based on actual price behavior, they can be more responsive than fixed-percentage bands. However, like all indicators, it’s most effective when used in conjunction with other technical and fundamental tools.
Disclaimer
This script is provided for educational and informational purposes only. It does not guarantee any specific outcome or profit. Use it at your own discretion and risk.
Trade smart, stay safe.
Atilla Yurtseven

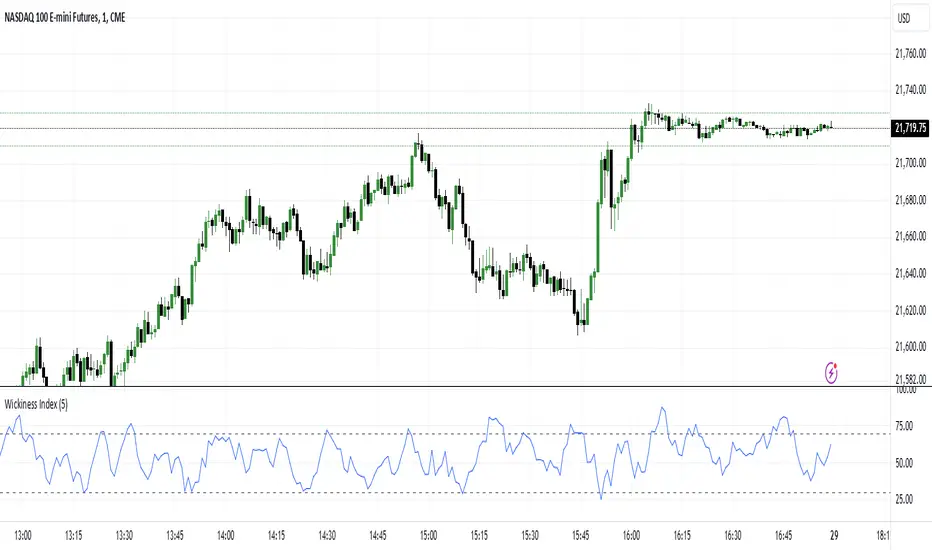
Wickiness IndexWickiness Index - Detect Indecision and Trend Exhaustion
The Wickiness Index is a versatile technical indicator designed to measure the proportion of wicks (upper and lower shadows) relative to the total range of price bars over a specified lookback period. It provides insights into market indecision, reversals, and trend exhaustion by analyzing the structural composition of candlesticks. The indicator calculates the lengths of upper and lower wicks along with the body of each candlestick. Each bar's wick length is expressed as a percentage of the total range (High - Low). The ratio is scaled to 0–100, where 100 represents entirely wicks with no body (indicating pure indecision) and 0 represents no wicks with only body (indicating strong directional movement). These values are then averaged over the lookback period (default = 5 bars) to provide a smoothed representation of wickiness, reducing noise and highlighting trends.
A high value, especially above 70, suggests indecision or potential reversals, as candlesticks dominated by wicks often appear near tops or bottoms. Conversely, low values below 30 indicate trend strength and strong momentum, useful for spotting breakouts and trend continuation. Mid-range values between 30 and 70 often indicate consolidation phases or gradual transitions between trends. Traders can adjust the lookback period to match their trading style, with shorter periods offering faster responses and longer periods providing smoother trends.
This indicator is particularly useful for trend reversal detection, breakout confirmation, and volatility filtering. It scales effectively across all timeframes, making it suitable for both intraday traders and long-term investors. When combined with volume analysis or trend-following indicators, the Wickiness Index can further strengthen trade signals. The visual design includes a blue line for the index and horizontal reference lines at 30 and 70, allowing for quick and intuitive interpretation.
The Wickiness Index offers a unique perspective on market sentiment and price action behavior, providing traders with valuable insights into potential turning points, momentum shifts, and market indecision. It is a powerful tool for improving decision-making in volatile markets and identifying areas where price trends may weaken or reverse.
Smooth RSI [MarktQuant]This indicator combines elements of the Relative Strength Index (RSI) and Rate of Change (RoC) to provide a smoother and potentially more insightful view of market momentum and price movement. The Smooth RSI calculates RSI values across four price points (high, open, low, close) to average them, offering a less volatile RSI signal. Additionally, it incorporates a Rate of Change for trend confirmation, enhancing the decision-making process for trade entries and exits.
Features:
Multi-RSI Calculation: RSI is computed for high, open, low, and close prices, then averaged to reduce noise.
Trend Confirmation with RoC: Uses the Rate of Change to validate the RSI signals, coloring bars based on the trend direction.
Visual Signals:
Bar colors change based on combined RSI and RoC signals.
Green for bullish signals (RSI above 50 and positive RoC).
Red for bearish signals (RSI below 50 and negative RoC).
Horizontal lines at 30, 50, and 70 to denote overbought, neutral, and oversold conditions.
Customizable Display:
Option to show/hide RSI plot or RoC plot for cleaner charts.
Candle plot overlay option to visualize current price action alongside the indicator.
Inputs:
RSI Length: Default 28. Adjusts the lookback period for RSI calculation.
RoC Length: Default 28. Sets the period for the Rate of Change calculation.
Plot Settings:
Show RSI - Toggle RSI plot visibility.
Show RoC - Toggle RoC plot visibility.
Usage:
Long signals are indicated when the average RSI is above 50 and the RoC is positive.
Short signals are suggested when the average RSI falls below 50 with a negative RoC.
The color coding helps visually confirm trends at a glance.
Notes:
This indicator is best used in conjunction with other analysis methods to confirm signals.
Adjust the length parameters based on your trading timeframe for optimal results.
Disclaimer:
This indicator does not guarantee trading success; use it as part of a comprehensive trading strategy. Always conduct your own analysis before making trading decisions.

Fast WMAThe Fast WMA is a reactive trend-following tool designed to provide rapid signals on the ETHBTC ratio. It uses advanced smoothing techniques and normalized thresholds to detect trends effectively. Let’s break it down further:
Source Smoothing with Standard Deviations
The source price data is smoothed by calculating its standard deviation, which measures how far prices typically move from the average. This creates upper and lower deviation levels:
The upper deviation represents a high boundary where prices might be overextended.
The lower deviation represents a low boundary where prices might be oversold.
These deviations are combined with the Weighted Moving Average (WMA) to filter out noise and focus on significant price movements.
Weighting the WMA for Further Smoothing
The Weighted Moving Average (WMA) itself is refined by applying adjustable weights:
An upper weight expands the WMA, forming an Upper Band.
A lower weight compresses the WMA, forming a Lower Band.
This dual-weighted approach allows the tool to adapt dynamically to price action, highlighting areas of potential trend reversals or continuations.
Normalized WMA (NWMA) with Adjustable Thresholds
The Normalized WMA (NWMA) adds an extra layer of analysis:
It compares the source price to its smoothed average, expressing the result as a percentage change.
This helps identify whether the market is overbought (positive NWMA) or oversold (negative NWMA).
Two adjustable thresholds—a long threshold (for buy signals) and a short threshold (for sell signals)—allow users to fine-tune the sensitivity of these signals based on their trading style or the market's volatility.
Entry/Exit Conditions
The Fast WMA generates signals based on two conditions:
Buy (Long) Signal:
Occurs when the price stays above the lower deviation level, and the NWMA crosses above the long threshold.
Indicates bullish momentum and suggests an upward trend.
Sell (Short) Signal:
Occurs when the price falls below the upper deviation level, and the NWMA drops below the short threshold.
Indicates bearish momentum and suggests a downward trend.
Important Note
This indicator is not designed to work alone. It’s a powerful tool for identifying trends but should be combined with other analyses, such as volume, higher time-frame trends, or fundamental analysis, for better decision-making.
Plotting Features
The Fast WMA includes intuitive visual cues to enhance usability:
Color-Coded Signals:
Colors change dynamically to indicate trend direction.
Options are available to customize the color scheme (e.g., for specific trading pairs like ETHBTC or SOLBTC).
Threshold Lines:
Dashed horizontal lines mark the long and short thresholds, helping users visualize signal levels.
Bands and Fill Areas:
The Upper Band and Lower Band are plotted around the WMA, with shaded regions indicating the deviation zones.
Signal Arrows:
Triangles appear below or above candles to highlight potential buy (upward arrow) or sell (downward arrow) points.
Bar Coloring:
Candlesticks are colored according to trend direction, making it easier to identify trends at a glance.
The Fast WMA combines mathematical precision with user-friendly visualization, offering traders a versatile tool to analyze trends and make informed decisions. However, like any indicator, it’s most effective when used as part of a broader trading strategy.
