Orderflow Bias Premium v2 [Pro+]Orderflow Bias Premium v2 is a dynamic Pine v6 indicator designed to identify periods of consolidation (choppy) markets versus expansion (trending) markets using a blend of volatility, volume, and market structure. When markets shift into expansion, the script computes a composite directional bias (“Bullish”, “Bearish”, or “Neutral”) along with a trend strength metric. In consolidation, it tracks how long price remains choppy, displaying elapsed minutes. All information is presented in a floating table at the top-right of the chart for instant visual clarity - with each field toggleable on / off by the user.
Key Terms and Definitions
Consolidation : A market regime where price action is confined within narrow Bollinger Band widths, low ATR/price ratios, and subdued volume—signaling uncertainty or indecision.
Expansion : A market regime where volatility, ATR, or volume “break out” of low percentile thresholds, suggesting a trending move.
Bollinger Band Width (BBW) : The normalized distance between the upper and lower Bollinger Bands, calculated as (upper – lower) / basis. Used here to detect when volatility is suppressed.
ATR/Price Ratio : The average true range (ATR) divided by the current close, normalized as a percentage. A lower ratio indicates tighter price action.
Volume Ratio (VR) : Current volume divided by its moving average; when VR is below a historical percentile, volume is considered “low.”
Percentile Test : For each metric (BBW, ATR/price, VR), we compute the current value’s rank (e.g., 20th percentile) over a look-back window. If the current value is below that percentile (after applying any intraday multipliers), it counts as “low.”
Imbalance (3-Bar Gap) : A price pattern where, two bars ago, the high is lower than the current bar’s low (bullish imbalance) or the low is higher than the current bar’s high (bearish imbalance). The script tracks whether any such gap has formed in a higher timeframe to seed directional memory.
Directional Bias : When in expansion, three methods vote on market direction: (1) DMI spread, (3) impulse-bar majority, and (4) last imbalance direction. The summed votes determine “Bullish”, “Bearish”, or “Neutral.”
Hysteresis (Bars to Flip State) : The number of consecutive bars required for a new regime (consolidation ↔ expansion) to be confirmed. This prevents false flips from single-bar noise.
Key Features
Dynamic Regime Detection
Combines BBW, ATR/price, and volume percentile tests to detect low-volatility consolidation vs. breakouts.
Supports optional intraday multipliers to scale thresholds during open (09:30–10:15), lunch (11:45–13:30), and power hour (15:30–16:00).
Optional higher-timeframe filter (current TF × user-defined multiplier) ensures false consolidations are avoided when the next larger TF is still trending.
Intuitive Chop Enhancements
N-Bar Range Test: Flags chop if (highest high – lowest low) over N bars < ATR×multiplier.
ADX Test: Considers ADX < user threshold as choppy.
RSI Flat Test: Marks chop if RSI range over N bars < threshold.
SMA Deviation Test: Detects chop if |price – SMA| (normalized by ATR) < threshold.
Composite Directional Bias (Expansion Only)
Method 1: DMI spread vote (+DI vs. –DI).
Method 2: Impulse-bar majority over a rolling window.
Method 3:Memory of last 3-bar imbalance on a user-specified higher TF.
Strength Metric:ADX normalized to percentage + textual category (Low/Moderate/High/Very High) indicates trend momentum.
Real-Time Table Display
2-column, 3-row floating table at top-right.
How Traders Can Use the Indicator Effectively
Timing Breakouts
While price remains in consolidation, the elapsed timer can reveal when an extended chop may soon resolve—enabling traders to anticipate breakouts.
Filtering Noise on Lower TFs
By enabling the higher-TF filter (e.g., 5 min chart screening 15 min chop), intraday traders can avoid false expansion signals caused by micro-noise.
Directional Confirmation
In expansion mode, seeing “Orderflow: Bullish” + “Strength: High” can be used as confluence alongside price-action entries or trendline breaks.
Combining with Other Tools
Pair with volume profile, market structure (swing highs/lows), or momentum oscillators for multi-dimensional confirmation before taking a trade.
USER TOGGLEABLE INPUTS
Show State
Toggles displaying the “State:” row (Consolidation vs. Expansion) in the table.
Show Strength
Toggles displaying the ADX-based strength (or, in consolidation, elapsed time) row in the table.
Show OrderFlow Bias
Toggles displaying the “Orderflow” (directional bias) row (or “Bias: Neutral” in consolidation).
Bars to Flip State
Number of consecutive bars required before switching between “Consolidation” and “Expansion.”
Enable BBW Percentile Test
Toggles whether Bollinger-Band-width percentile checks count toward identifying consolidation.
BB Length
Look-back length (in bars) for computing the Bollinger Band’s SMA/standard deviation.
BB StdDev Mult
Multiplier on the Bollinger Band’s standard deviation when calculating bandwidth.
BBW Look-back
Number of bars over which to compute the rolling percentile of BB width.
BBW Percentile
Percentile threshold for BB width to be considered “low” (choppy).
Enable ATR Percentile Test
Toggles whether the ATR/price-ratio percentile check counts toward consolidation.
ATR Length
Look-back length (in bars) for calculating ATR.
ATR Look-back
Number of bars over which to compute the rolling percentile of ATR/price.
ATR Percentile
Percentile threshold for ATR/price ratio to be considered “low.”
Enable Volume Percentile Test
Toggles whether volume percentile checks count toward consolidation.
Volume MA Length
Look-back length (in bars) for computing the moving average of volume.
Vol Percentile
Percentile threshold for current volume (relative to its MA) to be considered “low.”
Vol Factor (fallback)
Multiplier applied to the volume percentile threshold if the primary percentile test fails.
Enable Intraday Multipliers
Toggles whether open/lunch/power-hour scaling factors apply to BBW/ATR tests.
BBW Open/Power Mult
Multiplier on BB width threshold during market open (09:30–10:15) and power hour (15:30–16:00).
ATR Open/Power Mult
Multiplier on ATR threshold during market open and power hour.
BBW Lunch Mult
Multiplier on BB width threshold during the lunch lull (11:45–13:30).
ATR Lunch Mult
Multiplier on ATR threshold during the lunch lull.
Enable Higher TF Filter
Toggles checking the BBW/ATR/Vol tests on a higher timeframe before allowing consolidation.
Higher-TF Multiplier
Integer factor by which to multiply the current timeframe (e.g., 5 min × 3 = 15 min) for higher-TF checks.
Show ADX Strength
Toggles whether ADX is used to compute and display the “Strength” metric when expanding.
ADX Length
Look-back length (in bars) for computing DMI/ADX.
Table Opacity %
Opacity (0–100) of the floating table’s background.
DI Spread Threshold
Minimum difference between +DI and −DI needed to cast a bullish or bearish vote in directional bias.
Impulse Window Size
Number of bars over which to count “impulse bars” (close in top 40 % vs. bottom 40 %) for directional voting.
Enable Bar Range Test
Toggles checking if the N-bar high–low range is unusually narrow (another chop criterion).
Range Test N Bars
Look-back period (in bars) for computing the highest high minus lowest low for the range test.
Range Test ATR Mult
Multiplier on the average ATR when comparing against the N-bar range.
Enable ADX Test
Toggles marking “choppy” if ADX is below the user-defined threshold.
ADX Threshold
ADX value below which the market is considered non-trending (choppy).
Enable RSI Flat Test
Toggles checking whether RSI has been stuck in a tight range (another chop signal).
RSI Length
Look-back length (in bars) for computing standard RSI.
RSI Range N Bars
Look-back period (in bars) for computing RSI’s highest minus lowest.
RSI Range Threshold
Maximum RSI range over the look-back period to qualify as “flat.”
Enable SMA Deviation Test
Toggles checking if price is “near” its SMA (another chop heuristic).
SMA Length
Look-back length (in bars) for computing the simple moving average (SMA).
Dev Test ATR Length
Look-back length (in bars) for ATR when normalizing deviation from the SMA.
Dev Threshold (ATR units)
Maximum (|price − SMA| / ATR) allowed to count as “near” the SMA.
Enable TF1
Toggles the higher-timeframe imbalance logic on or off.
Timeframe 1
Base resolution (e.g., “1” = 1 minute) used for detecting 3-bar imbalances.
Lookback Timeframe
Higher timeframe (e.g., “15” = 15 minutes) used to compute how many base-resolution bars to look back.
Bars 1
(Calculated internally) Number of base-timeframe bars contained within one lookback-timeframe bar.
Terms and Conditions
Informational Purposes Only : OrderFlow Bias v2 Premium is provided without any guarantees. It is not financial advice, nor does it predict market movements. Users assume full responsibility for any trading decisions made.
No Liability : By using this indicator, you acknowledge that neither the script’s author nor TradingView is liable for losses arising from its use. Past performance is not indicative of future results.
Licensing : This script is published as closed-source (protected). Its Pine code is hidden from view and may not be forked, modified, or redistributed without express permission from the author. Protected scripts on TradingView require a Pro, Pro+, or Premium account to publish and remain accessible only to invited users; all usage rights and access control are governed by the author’s invite settings.
Disclaimer
The information and code in OrderFlow Bias v2 Premium are provided “as is” for educational and analytical purposes only. They do not constitute any investment, trading, or financial advice. Users should conduct their own due diligence and seek professional counsel before making trading decisions. The author and TradingView disclaim all liability for actions based on this information.
Indicators and strategies

US30 Daily Trade FinderElevate Your US30 Trading with Daily Trade Finder
Welcome to the next evolution in breakout-based trading on Daily Trade Finder v1.0—for US30 (Dow Jones). Designed by FX DISTRIBUTION for traders who demand clarity, consistency, and built-in risk control, this invite-only indicator cuts through the noise and delivers high-probability entry signals every New York session.
✨ What It Does
Session-Based Breakout Detection
Tracks the Asian session’s high and low (automatically highlighted on your chart).
Monitors London’s liquidity sweeps of those Asian extremes to determine directional bias (bullish if the Asian high is breached, bearish if the Asian low is pierced).
During the New York session, fires a “Buy” or “Sell” label whenever price closes beyond the prior session range in the direction of your bias.
Fixed & Dynamic TP/SL Calculation
Fixed Mode: Uses a Simple “Pip Offset” for Stop-Loss and Take-Profit (30–50 pips SL, 75–100 pips TP by default).
Dynamic ATR Mode: Automatically adjusts your SL/TP based on real-time market volatility (ATR), so you never risk being prematurely stopped out during high-volatility episodes or leaving money on the table in tight ranges.
Built-In Backtest Dashboard
On the final bar of your replay or live chart, a compact, on-screen table displays:
Total Entries
Wins vs. Losses
Win Rate (%)
Average Profit per Trade (%)
Total Profit (%)
No need for external export—see exactly how the indicator has performed over your chosen timeframe, so you trade with confidence rather than guesswork.
On-Chart Trade Labels & Alerts
Entry Labels: Green “Buy” arrows and red “Sell” arrows appear precisely when conditions align.
Exit Labels: Clearly marks “Exit Long” or “Exit Short” at TP levels if your SL/TP is hit and if the “Show Exit Point” option is enabled.
Customizable Alerts: Receive native TradingView push, email, or pop-up alerts when a signal fires or a TP/SL is reached—never miss a key move again.
🏆 Why It’s Unique
Integrated Session Logic + Breakout Edge: Most breakout tools simply watch price vs. a static range. Daily Trade Finder layers on ICT session philosophy—filtering Asian ranges, waiting for London sweeps, and then only trading in New York. This three-step filter drastically reduces false signals.
Adaptive Risk Management: Instead of forcing a one-size-fits-all pip offset, our Dynamic ATR mode scales every SL/TP to the market’s current volatility—giving you breathing room in wild markets and tighter exits in calm markets.
Transparency with Backtest Metrics: Built-in, on-chart backtesting metrics mean you see your win rate and profitability at a glance without exporting data to spreadsheets or Blockchain. You’ll know in real time if your set-and-forget strategy really works.
Invite-Only, Protected Code: The logic is proprietary to FX DISTRIBUTION. By keeping this indicator invite-only, we ensure you have a dedicated support channel and a hand-picked community of serious US30 traders.
⚙️ How It Works (Step-by-Step)
Add ICT Session Marker (Optional)
Drop the ICT Sessions indicator on your US30 chart to color-code Asian, London, and New York blocks for clearer context.
Add Daily Trade Finder to Your 5 Min (or 3 Min) US30 Chart
Confirm your inputs:
Market Open Time: Set your broker’s UTC-offset so “New York” session aligns correctly.
TP/SL Mode: Select “Fixed” (30–50 pip SL, 75–100 pip TP) or “Dynamic ATR” (custom ATR length & multipliers).
Show Exit Labels: Toggle on if you want to see exactly where TP or SL triggered.
Identify Bias via London Sweep
During 2 AM–5 AM EST (London session), wait for price to break above the prior Asian High (bullish bias) or below the prior Asian Low (bearish bias).
If no clear sweep, skip the day or wait for retest—there is no forced entry.
Trade in New York Session (7 AM–10 AM EST)
On the 5 Min (or 3 Min) chart, watch for a “Buy” label (green arrow) if bullish bias, or a “Sell” label (red arrow) if bearish bias.
Execute market order immediately at label’s candle close.
Set Stop-Loss & Take-Profit
SL: 30–50 pips away from entry. With a R 1 500 starting balance on US30, we recommend 0.01 lots (30 pip SL ≈ R 12 = ~0.8 % risk).
TP: 75–100 pips (1 – 2 Risk:Reward). If price reaches TP, you’ll see an “Exit Long” or “Exit Short” label.
Review Backtest Dashboard
As soon as the final bar of your replay or live chart loads, your on-screen table shows your results: number of signals, wins/losses, win rate, average % return per trade, and total % profit.
Use this immediate feedback to adjust your session times, TP/SL preferences, or risk tolerance if needed.
🚀 Benefits for Traders
Clarity Over Noise: Rather than guessing which breakout to follow, you see exactly when and why those breakouts occur (session sweeps).
Automated Precision: One click installs, and all key SL/TP levels auto-calculate in real time—no need for manual pip counting.
Built-In Proof of Concept: The dashboard quantifies your edge in seconds—no more “back-of-the-napkin” calculations or Excel exports.
Invite-Only Community: By maintaining a private roster, we ensure each user has direct support, receives update notices, and trades alongside other committed US30 specialists.
Scalable Risk Control: Whether you’re starting with R 1 500 or R 150 000, simply adjust your lot size and the indicator’s built-in rules keep your risk at 1–2 % per trade.
Final Thoughts
Daily Trade Finder v1.0 marries ICT session logic with real-time breakout filtering and adaptive risk controls, all packaged into a slick, on-chart dashboard. For serious US30 (Dow Jones) traders, this is not just another indicator—it’s a complete, invite-only toolkit designed to minimize guesswork, maximize clarity, and put your edge firmly in your corner.
Ready to trade like a pro? Request your invite now and join the FX DISTRIBUTION community of high-performance US30 breakout specialists. Good luck, and trade with confidence!

Doganayy2 Buy/Sell & liquidityTrap🔧 User-Changeable Settings and Their Meanings
1. ✅ Is Wick Filter Active?
What does it do?: Controls the length of the candle wick.
Effect: If active, a long wick is considered a trap (a sign of manipulation).
2. 📊 Is Volume Filter Active?
What does it do?: Controls abnormally high volume according to the volume average.
Effect: If active, high volume candles are considered for a liquidity trap signal.
3. 📈 Is RSI Filter Active?
What does it do?: Controls overbought/oversold according to the RSI level.
Effect: If active;
If RSI > ?, a long trap is searched.
If RSI < ?, a short trap is searched.
4. 🔴🟢 Is Candle Color (Direction) Filter Active?
What does it do?: Controls whether the candle is green or red.
Effect: If active;
A red candle (selling pressure) is required for a long trap.
A green candle (buying pressure) is required for a short trap.
5. 🧮 Is Fibonacci Level Filter Active?
What does it do?: Checks whether the price has reached important Fibonacci levels.
Effect: If active;
For a long trap, the price must rise above the Fibo level.
For a short trap, the price must fall below the Fibo level.
6. 📏 Is ATR Filter Active?
What does it do?: Checks whether there is sufficient deviation in the price according to the ATR.
Effect: If active;
A trap signal is given according to whether the price has moved too far from the ATR.
📌 As a result:
As these filters are activated, the system's long/short trap detection becomes tighter and produces fewer but more reliable signals. If you close the filters, you will receive more signals, but reliability may decrease.
Purpose of the indicator: To present buy/sell opportunities by detecting liquidity traps.

Elev8+ Reversal IndicatorElev8+ Reversal Indicator from Elev8Trading.com. Detects possible reversal points especially in combination with support or resistance levels, moving averages, areas of liquidity, etc. Great for scalping on smaller time frames and trend reversals on higher time frames.

Friday SET 1 & 2 - NQ Options LevelsDaily NQ Levels - Just copy paste Zone Set 1 & 2 into this indicator to update the daily levels.

Barra de Ignição - YuriIgnition Bar - Yuri 🚨
This indicator identifies Ignition Bars, also known as “obvious candles”, which frequently mark the beginning of strong directional movements in price.
🔍 Signal Criteria:
The current candle must be the largest (high - low) among the last 20 candles.
The candle body (open-close range) must represent at least 80% of the total range, indicating strong buying or selling pressure.
A signal is triggered only if the candle has clear directional conviction:
Bullish candle → "LONG ↑" label below the bar.
Bearish candle → "SHORT ↓" label above the bar.
⚠️ Alerts:
A single, unified alert() is triggered whenever a long or short Ignition Bar is detected.
Ideal for integration with bots, webhooks, or mobile notifications.
📈 Extra Feature:
Optionally, a 200-period Exponential Moving Average (EMA200) can be plotted on the chart to provide context about long-term trend direction.
✅ Use Cases:
Spotting potential breakout candles early.
Confirming momentum entries.
Identifying trend ignition points after consolidation periods.
🎯 Designed for traders looking to enter high-momentum trades early and cleanly.

ΦTweaked version of ICT Algorithmic Macro Tracker° (Open-Source) by toodegrees. Tweak consists in changing up the macro time from xx:50 - xx:10 to xx:45 - xx:15

Preço de Reversão - Yuri🔄 Preço de Reversão - Yuri (Reversal Price - Yuri) is a technical indicator that detects trend reversal opportunities based on candle behavior and volume confirmation.
✅ Bullish Reversal:
Current candle's low is lower than the last two candles.
Current candle closes above the previous close.
Volume must be above the 20-period average.
Optionally, the signal only appears when trend EMAs confirm an uptrend.
🔻 Bearish Reversal:
Current candle's high is higher than the last two candles.
Current candle closes below the previous close.
Volume must be above average.
Optionally, the signal only appears with EMA downtrend confluence.
⚙️ User configuration includes:
Custom EMA combinations for trend filtering (Fast, Short, Mid, Long EMAs)
Display of trend zones and EMAs on chart
🔔 Automatic alerts trigger whenever a valid reversal signal is confirmed.
Perfect for traders seeking technical reversals with volume and trend alignment.

Bullish & Bearish Three Line Strike ProHello Traders!
Overview
The **Bullish & Bearish Three Line Strike Pro** indicator pin-points one of the most decisive four-candle reversal formations on any market or timeframe. Whether you trade ranges or follow strong trends, this tool spots exhaustion and offers clear entry and exit guidance.
Based on "Encyclopedia of Chart Patterns" from Thomas N. Bulkowski, in which he backtested the pattern extensively, the bullish three line strike pattern has historically had an astonishing 84 % of success rate within bull markets and it had a success rate of 77 % to highlight reversals in bear markets.
The bearish three line strike pattern has historically had an astonishing 83 % success rate* within a bear market and a success rate of 65 % to highlight reversals in bull markets.
*Based on "Encyclopedia of Chart Patterns" from Thomas N. Bulkowski
Key Features :
Precise pattern detection: Detects genuine Bullish and Bearish Three Line Strike setups, screening out look-alikes that fail to perform on the market.
Trend filter (optional): Aligns signals with a user-defined Simple Moving Average (SMA) so you can choose to trade only with, or deliberately against, the prevailing trend.
Visual clarity: Highlights Bullish and Bearish Three Line Strike patterns with customizable colors and shapes, making them easy to spot on the chart.
Filtered-signal display: Let the script reveal which patterns were rejected by the trend filter — an invaluable learning aid.
Bullish Three Line Strike
Three consecutive bearish candles that step lower.
The fourth candle opens below (or at) the last close, then charges upward engulfing all three prior bodies.
Bearish Three Line Strike
Three consecutive bullish candles that step higher.
The fourth candle opens above (or at) the last close, then plunges below engulfing all three prior bodies.
What makes this indicator unique
Precise pattern detection: Detects genuine Bullish and Bearish Three Line Strike setups, screening out look-alikes that fail to perform on the market.
Trend filter (optional): Aligns signals with a user-defined Simple Moving Average (SMA) so you can choose to trade only with, or deliberately against, the prevailing trend.
Visual clarity: Highlights Bullish and Bearish Three Line Strike patterns with customizable colors and shapes, making them easy to spot on the chart.
Filtered-signal display: Let the script reveal which patterns were rejected by the trend filter — an invaluable learning aid.
Nuanced candle analytics: Goes beyond simple price action by considering multiple factors such as candle body ratios, wick lengths, and relative positions to previous candles.
Adaptive learning mode: Display rejected setups to reverse-engineer the logic and refine your discretionary skills.
One-glance decision making: Unified color scheme and label styling make patterns pop, even on cluttered layouts.
How to Trade with this Indicator
Use Three Line Strike Pro to fade exhaustion or re-enter a trend after a healthy pull-back.
Bullish opportunities: Watch for light blue-colored strike candles as potential entry points.
Bearish opportunities: Look for orange-colored strike candles as potential entry points.
Entry: Open the position at the next bar’s open once the strike candle closes.
Stop-loss: 2 ticks beyond the extreme of the complete four-candle pattern.
Aggressive stop-loss: For exceptionally strong strike candles (tiny opposite wick, close near extreme) trail only 2 ticks beyond the strike candle itself.
Take-profit: Aim for 2R (3R for aggressive traders), or trail behind higher lows / lower highs.
Trend Alignment
For a conservative approach, enable "Use Trend Filter" and take only those strikes that agree with the SMA slope. The SMA line is color-coded—lime for up, red for down, yellow for flat—to help you confirm bias at a glance.
Tip: If you want the candle coloring to sit on top of all other studies, drag the indicator to the top of your Object Tree.

TrendisYourFriendThis script provides a trend indicator which seems quite reliable on the daily timeframe when applied to crypto currencies.

Setup 123 - YuriSetup 123 - Yuri
This indicator detects reversal opportunities based on the classic 3-candle price action structure, widely known as the “123 Setup”.
✅ Features:
Buy signal (123 bottom): Higher low structure.
Sell signal (123 top): Lower high structure.
Optional volume filter: Only shows signals with volume above the 20-period average.
Optional EMA trend filter: Allows custom EMA confluence by selecting any two EMAs.
Context zones (Long/Short): Visually highlight trend-favorable areas and restrict signals to them when enabled.
Built-in alerts: Compatible with individual alert conditions and Any alert() function call.
Confirmation candle control: Option to require bullish candle for buy signals or bearish candle for sell signals.
Perfect for traders looking to capture reversals with structured confirmation and flexible filtering. All parameters can be customized to suit your trading strategy.


💹 OptionHawkThe 💹 OptionHawk is a sophisticated, multi-featured trading indicator designed for intraday and swing traders, particularly those dealing in options (CALL/PUT) strategies. It is built to identify high-probability entries, offer dynamic risk-reward levels, and provide visual confirmations for trade validation, all while being customizable to a trader’s strategy preferences.
🧠 What Makes It Unique:
✅ Hybrid Strategy: Combines trend and custom trend logic.
🎯 Precision Targets: Multiple profit targets help with partial exits and risk management.
🔄 Dual Strategy Handling: Handles both CALL and PUT signals in a single unified system.
🖌️ Bar Coloring + Labeling: Highly visual design for ease of real-time decision-making.
🧩 Modular Design: Parameters can be fine-tuned for scalping, intraday, or swing setups.
📈 No Repainting Logic: All signals are based on confirmed candle closes.
🚀 Ideal Use Cases:
🔹 Options Traders (NIFTY, BANKNIFTY, etc.)
🔹 Intraday Traders seeking rapid confirmation and momentum-based signals.
🔹 Trend-Followers who want entry after confirmation.
🔹 Scalpers using multiple TPs for fast exits.
🔹 Manual and Semi-Automated Strategies (via alerts or visual monitoring)
The 💹 OptionHawk isn’t just another signal indicator. It's a visually rich, confirmation-based, target-driven strategy tool tailored for precision trading in volatile markets. Whether you're a discretionary trader or looking to build a semi-automated setup, this indicator acts as your personal trading assistant—offering data, direction, and discipline all in one package.


Volume By FOBOSThis indicator visualizes the aggregated trading volume of a selected cryptocurrency asset across multiple leading exchanges. It consolidates volume data into a single, easy-to-read chart.
Indicator Features:
Volume Aggregation: Displays cumulative trading volume from user-defined exchanges (1 to 40 exchanges).
Dynamic Visualization: Volume columns colored dynamically based on price direction (green for rising prices, red for falling).
24-hour Average Volume: Optional line displaying the average trading volume over the past 24 hours, facilitating quick volume comparisons.
Automated Volume Formatting: Clearly presents volume figures with automatic formatting for readability (in thousands or millions).
Multi-Timeframe Support: Automatically adapts calculations to the current chart timeframe for accurate average volume computation.
User Settings:
Adjustable number of exchanges (1 to 40).
Toggle visibility of the 24-hour average volume line.
Note:
This indicator is designed solely for informational purposes and does not provide trade recommendations or signals.

Liquidity-Quant Execution Score (LQES)Liquidity-Quant Execution Score (LQES)
Precision execution insights made simple — your go-to score for market clarity.
What you see:
A dynamic line score plotted clearly below your chart that reflects the market’s execution strength.
Color-coded threshold bands —
The upper red band signals zones where caution is advised (potential bearish conditions).
The lower green band marks areas of potential bullish strength.
A shaded purple zone between the bands that highlights “normal” or neutral conditions.
Features:
Designed to give you a clear sense of market execution dynamics without complex numbers.
Adjustable input parameters allow you to tailor the sensitivity and timeframe to your strategy.
Includes fixed alert conditions to notify you when the score crosses key zones — so you never miss important signals.
How to use it:
Watch for the score crossing above the upper red line — this could hint at increasing market pressure to the downside.
When the score drops below the lower green line, it may suggest bullish momentum picking up.
Use the middle purple zone to identify calm or balanced periods — ideal for preparation or cautious trading.
Why traders rely on LQES:
This indicator translates complex market execution data into one straightforward, visually intuitive score — making it easier to spot shifts in liquidity and price action that matter most for smart entries and exits.
No need to second guess. Just watch the score, respect the zones, and integrate it smoothly with your trading plan.

Enhanced Zones with Volume StrengthEnhanced Zones with Volume Strength
Your reliable visual guide to market zones — now with Multi-Timeframe (MTF) power!
What you get:
Clear visual zones on your chart — color-coded boxes that highlight important price areas.
Blue Boxes for neutral zones — easy to spot areas of indecision or balance.
Gray Boxes to show normal volume conditions, giving you context without clutter.
Green Boxes highlighting bullish zones where strength is showing.
Red Boxes marking bearish zones where weakness might be in play.
Multi-Timeframe Support:
Seamlessly visualize these zones from higher timeframes directly on your current chart for a bigger-picture view, helping you make smarter trading decisions.
How to use it:
Adjust the box width (in bars) to fit your trading style and timeframe.
Customize colors and opacity to suit your chart theme.
Toggle neutral blue and gray volume boxes on/off to focus on what matters most to you.
Set the maximum number of boxes to keep your chart clean and performant.
Why you’ll love it:
This indicator cuts through the noise by visually marking zones where volume and price action matter the most — without overwhelming your chart. The MTF feature means you’re always aligned with higher timeframe trends without switching views.
Pro tip:
Use these boxes as dynamic support/resistance areas or to confirm trade setups alongside your favorite indicators.
No complicated formulas here, just crisp, actionable visuals designed for clarity and confidence.


Time-Weighted Fractality (TWF)The Time-Weighted Fractality (TWF) indicator is your secret weapon to measure how stable or volatile a market truly is — by tracking how long trends persist, and weighting that against recent history.
Why you need TWF in your toolkit:
Markets aren’t always trending or choppy in a simple on/off way. TWF quantifies trend duration dynamics — revealing when the market is locked into a strong, stable trend or stuck in erratic, unpredictable moves.
How it works — sharp and simple:
Trend Duration Tracking:
Measures how many bars since the last highest high changed within a specified lookback. This tells you how long the current trend has been running.
Smoothed Average Duration:
Uses an EMA to smooth trend duration, providing a reliable baseline of recent trend behavior.
Ratio Calculation (TWF):
The core metric — current trend duration divided by average trend duration.
TWF > 1.2 means the current trend is stronger and more persistent than usual.
TWF < 0.8 signals a volatile, choppy market struggling to hold any trend.
What you see on the chart:
A clean TWF line plotted with clear zones:
Green zone = Strong, stable trend environment
Red zone = Choppy, volatile conditions to avoid or trade cautiously
Background shading highlights these zones for instant clarity
Markers appear at critical points for quick visual cues
Why traders swear by it:
✅ Reliable trend confirmation: Avoid false signals by only acting when TWF confirms sustained market momentum.
✅ Timing tool: Perfect for spotting when a trend is building strength or losing grip — invaluable for entries and exits.
✅ Versatile: Works on all timeframes and instruments, from forex to stocks to crypto.
✅ Simple but powerful: Combines fractal concept with time weighting and smoothing — giving you a next-level understanding of market rhythm.
Pro tip:
Use TWF alongside your favorite price or volume-based indicators for unmatched precision. For example, confirm breakouts only when TWF signals a stable trend zone to increase your win rate.
In a sea of noise, TWF cuts through to give you real, actionable insight. Trust it, build your strategy around it — it’s that good.

Volume Confirmation Bars📊
This script is a leveled-up companion to my earlier Volume Strength Highlight — but this time, it’s built with more focus on confirmation, clarity, and cleaner visual impact directly on your price chart.
🧠 What is this about?
This tool highlights candles only when volume truly matters — either when it’s unusually high or conspicuously low, compared to its recent average.
It uses a simple but powerful method:
A customizable SMA-based volume baseline
A multiplier filter to define what counts as "strong" or "weak" volume
Optional bar coloring to show volume sentiment right on your chart — no need to stare at the volume pane anymore.
🧮 How it works:
Average Volume Line:
We calculate a moving average (default 18 candles) of the volume. This acts as our benchmark.
Volume Spike Rule:
If current volume is above the average × multiplier (say, 1.3×), it’s marked as High Volume.
Low Volume Rule:
If current volume is below the average ÷ multiplier, it’s marked as Low Volume.
Bar Coloring:
🟢 High Volume Candle? → Green bar (you can customize it)
🔴 Low Volume Candle? → Red bar (also customizable)
Volume in between? → No coloring, just regular candles
This gives you instant volume sentiment, directly overlaid on price.
🔎 Why it matters:
Many traders watch for volume confirmation — whether it's a breakout, trend continuation, or reversal. But raw volume alone is noisy.
This script shows "when the crowd is truly active or asleep", making it perfect for:
Breakout strategies 🧨
Fakeout avoidance ⚠️
Confirming momentum moves 🚀
Identifying silent zones before news drops 📉
🛠 Settings You Control:
MA Length: How smooth or sensitive the baseline should be
Multiplier: Adjust how strict volume spikes need to be
Enable/Disable Coloring: Use as a visual tool or just a backend confirmation filter
Custom Colors: Match your theme 🎨
🧪 Tip:
You can combine this with any strategy or indicator — especially trend-following or candlestick-based tools like:
TSI / MACD
Engulfing or Hammer Candles
Support/Resistance Breakouts
✅ Use it as a volume filter, not a standalone system.
🔥 Works great with my "Volume Strength Highlight" script — use both together for better clarity!
Let me know if you’d like divergence alerts, volume zone shading, or a multi-timeframe version — always happy to build more for the community! 💬

Vervoort's True Strength Index (TSI)Hi traders! 👋
This script brings you a clean and enhanced version of the True Strength Index (TSI) developed by William Blau and later popularized by M.H. Vervoort.
It’s a momentum-based oscillator that helps identify trend direction, strength, and potential reversals with reduced noise and smoother signals compared to RSI or MACD.
🔍 What This Script Does:
Plots the TSI line — a smoothed momentum oscillator
Adds a signal line (EMA of TSI) to identify crossovers
Displays a histogram to visually show the difference between TSI and the signal line
Includes a zero line to detect trend shifts
📘 How It Works — Explained Line by Line:
momentum = price - price
We measure raw momentum (how much price changed since the last candle).
doubleSmoothedMomentum = ta.ema(ta.ema(momentum, short), long)
This is the core: we apply two layers of EMA smoothing to filter out noise and get clean momentum flow.
doubleSmoothedAbsMomentum = ta.ema(ta.ema(abs(momentum), short), long)
Same smoothing, but on absolute momentum (we use this for normalization).
TSI = 100 * (smoothed momentum / smoothed absolute momentum)
This gives us a bounded, normalized oscillator between roughly -100 and +100.
High positive values = strong bullish momentum.
Low negative values = strong bearish momentum.
Signal = EMA of TSI
Just like MACD — we smooth TSI again to generate a signal line for crossovers.
Histogram = TSI - Signal
This is the difference between the TSI and the signal. Positive = bullish bias; negative = bearish bias.
🟦 Plots on the Chart:
🔵 TSI Line (blue): Main momentum signal
🟠 Signal Line (orange): EMA of TSI, used for crossovers
🟩🟥 Histogram (green/red columns): Shows who’s in control — bulls or bears
⚪ Zero Line (gray dashed): Momentum flips around this line
✅ How to Use It:
TSI crossing above signal line → Potential bullish momentum
TSI crossing below signal line → Possible bearish shift
Both lines above zero → Uptrend confirmation
Both below zero → Downtrend confirmation
Histogram changing color → Early clue of a shift in strength
🔁 You can adjust the Short, Long, and Signal EMA lengths to fit your strategy (shorter = faster but noisier, longer = smoother but slower).
⚠️ Note:
Works best with trend-following or breakout strategies
Combine with volume or price action to confirm signals
Avoid using it alone in sideways markets (like all oscillators)
💬 Let me know if you'd like to add divergence detection, alerts, or multi-timeframe filters — happy to build on it!
Hope this helps make your trading clearer and more confident 🚀

Enhanced Candlestick Patterns (Optimized)Hey traders 👋
Ever missed a good move just because you didn't spot the pattern in time? Yeah, same here. That’s why I made this script — a cleaner, optimized version that detects key candlestick reversal patterns automatically 🔍
It highlights:
Bullish & Bearish Engulfing candles (with body ratio filtering)
Improved Harami patterns (using dynamic size filters)
Hammer & Inverted Hammer (based on wick/body ratios + position)
Morning Star & Evening Star combos (3-candle formations)
💡 Each pattern has logic tuned with extra filters — like wick lengths, ratios, and body positioning — so it’s more precise and less noisy than most basic pattern detectors.
✅ Helps spot early trend shifts
❌ Not meant to be standalone signals — use it with your own setup!
Patterns are marked clearly with color-coded shapes/labels so they’re easy to catch even in fast markets.
Feedback or ideas to improve? Just let me know — always happy to tweak and learn! 🚀

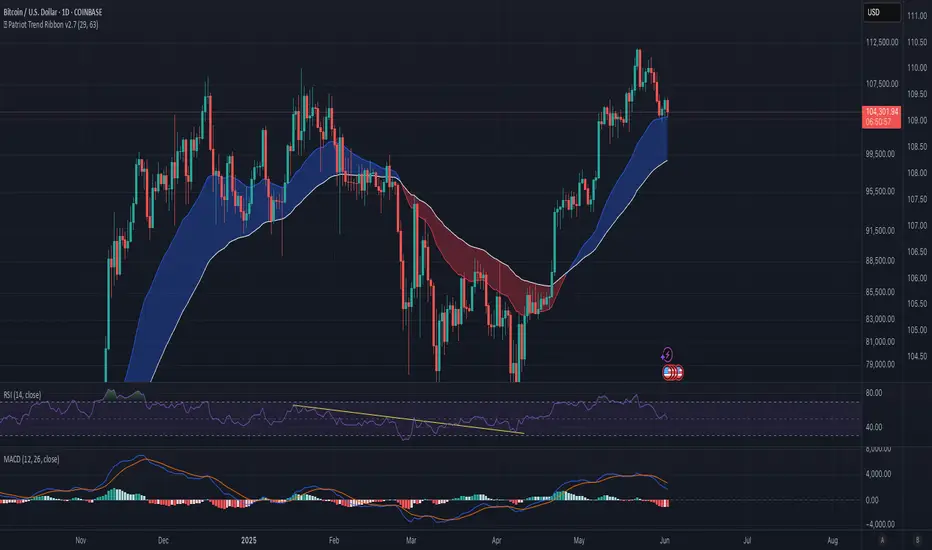
🇺🇸 Patriot Trend Ribbon v2.7🇺🇸 **Patriot Trend Ribbon v2.7** 🇬🇧
A no-nonsense trend ribbon indicator built for swing and position traders.
🚩 Red = Downtrend
🔵 Blue = Uptrend
A clean visual band identifies major market shifts with clarity.
📈 Works on:
- Crypto (BTC, ETH, SOL, etc.)
- Indices (SPX, NASDAQ)
- Forex & commodities
🎯 Optimized for 1D charts but effective across all timeframes.
🛡️ Inspired by tried and tested methods along with years of experience — Reimagined for modern patriots.
👉 DM me @GrantBev to get access.
Demand Index (Hybrid Sibbet) by TradeQUO\ Demand Index (Hybrid Sibbet) by TradeQUO \
\ Overview\
The Demand Index (DI) was introduced by James Sibbet in the early 1990s to gauge “real” buying versus selling pressure by combining price‐change information with volume intensity. Unlike pure price‐based oscillators (e.g. RSI or MACD), the DI highlights moves backed by above‐average volume—helping traders distinguish genuine demand/supply from false breakouts or low‐liquidity noise.
\ Calculation\
\
\ \ Step 1: Weighted Price (P)\
For each bar t, compute a weighted price:
```
Pₜ = Hₜ + Lₜ + 2·Cₜ
```
where Hₜ=High, Lₜ=Low, Cₜ=Close of bar t.
Also compute Pₜ₋₁ for the prior bar.
\ \ Step 2: Raw Range (R)\
Calculate the two‐bar range:
```
Rₜ = max(Hₜ, Hₜ₋₁) – min(Lₜ, Lₜ₋₁)
```
This Rₜ is used indirectly in the exponential dampener below.
\ \ Step 3: Normalize Volume (VolNorm)\
Compute an EMA of volume over n₁ bars (e.g. n₁=13):
```
EMA_Volₜ = EMA(Volume, n₁)ₜ
```
Then
```
VolNormₜ = Volumeₜ / EMA_Volₜ
```
If EMA\_Volₜ ≈ 0, set VolNormₜ to a small default (e.g. 0.0001) to avoid division‐by‐zero.
\ \ Step 4: BuyPower vs. SellPower\
Calculate “raw” BuyPowerₜ and SellPowerₜ depending on whether Pₜ > Pₜ₋₁ (bullish) or Pₜ < Pₜ₋₁ (bearish). Use an exponential dampener factor Dₜ to moderate extreme moves when true range is small. Specifically:
• If Pₜ > Pₜ₋₁,
```
BuyPowerₜ = (VolNormₜ) / exp
```
otherwise
```
BuyPowerₜ = VolNormₜ.
```
• If Pₜ < Pₜ₋₁,
```
SellPowerₜ = (VolNormₜ) / exp
```
otherwise
```
SellPowerₜ = VolNormₜ.
```
Here, H₀ and L₀ are the very first bar’s High/Low—used to calibrate the scale of the dampening. If the denominator of the exponential is near zero, substitute a small epsilon (e.g. 1e-10).
\ \ Step 5: Smooth Buy/Sell Power\
Apply a short EMA (n₂ bars, typically n₂=2) to each:
```
EMA_Buyₜ = EMA(BuyPower, n₂)ₜ
EMA_Sellₜ = EMA(SellPower, n₂)ₜ
```
\ \ Step 6: Raw Demand Index (DI\_raw)\
```
DI_rawₜ = EMA_Buyₜ – EMA_Sellₜ
```
A positive DI\_raw indicates that buying force (normalized by volume) exceeds selling force; a negative value indicates the opposite.
\ \ Step 7: Optional EMA Smoothing on DI (DI)\
To reduce choppiness, compute an EMA over DI\_raw (n₃ bars, e.g. n₃ = 1–5):
```
DIₜ = EMA(DI_raw, n₃)ₜ.
```
If n₃ = 1, DI = DI\_raw (no further smoothing).
\
\ Interpretation\
\
\ \ Crossing Zero Line\
• DI\_raw (or DI) crossing from below to above zero signals that cumulative buying pressure (over the chosen smoothing window) has overcome selling pressure—potential Long signal.
• Crossing from above to below zero signals dominant selling pressure—potential Short signal.
\ \ DI\_raw vs. DI (EMA)\
• When DI\_raw > DI (the EMA of DI\_raw), bullish momentum is accelerating.
• When DI\_raw < DI, bullish momentum is weakening (or bearish acceleration).
\ \ Divergences\
• If price makes new highs while DI fails to make higher highs (DI\_raw or DI declining), this hints at weakening buying power (“bearish divergence”), possibly preceding a reversal.
• If price makes new lows while DI fails to make lower lows (“bullish divergence”), this may signal waning selling pressure and a potential bounce.
\ \ Volume Confirmation\
• A strong price move without a corresponding rise in DI often indicates low‐volume “fake” moves.
• Conversely, a modest price move with a large DI spike suggests true institutional participation—often a more reliable breakout.
\
\ Usage Notes & Warnings\
\
\ \ Never Use DI in Isolation\
It is a \ filter\ and \ confirmation\ tool—combine with price‐action (trendlines, support/resistance, candlestick patterns) and risk management (stop‐losses) before executing trades.
\ \ Parameter Selection\
• \ Vol EMA length (n₁)\ : Commonly 13–20 bars. Shorter → more responsive to volume spikes, but noisier.
• \ Buy/Sell EMA length (n₂)\ : Typically 2 bars for fast smoothing.
• \ DI smoothing (n₃)\ : Usually 1 (no smoothing) or 3–5 for moderate smoothing. Long DI\_EMA (e.g. 20–50) gives a slower signal.
\ \ Market Adaptation\
Works well in liquid futures, indices, and heavily traded stocks. In thinly traded or highly erratic markets, adjust n₁ upward (e.g., 20–30) to reduce noise.
---
\ In Summary\
The Demand Index (James Sibbet) uses a three‐stage smoothing (volume → Buy/Sell Power → DI) to reveal true demand/supply imbalance. By combining normalized volume with price change, Sibbet’s DI helps traders identify momentum backed by real participation—filtering out “empty” moves and spotting early divergences. Always confirm DI signals with price action and sound risk controls before trading.
