LinReg Candles with 15min & 3min Signal Arrows (2x Confirmed)If the most recent 15-minute closed LinReg candle is red and the latest 3-minute closed candle (on a 3-minute chart) is red, then a Sell signal (red arrow) is generated for the next 3-minute candle.
Indicators and strategies

Wick-Scanner ab 0.20%This is a tool for daytraders or swingtraders. When a candle with a 0,2% wick is created, a signal pops up. The signal is either green(bullish) or red(bearish). The indicator is going to analyse how big the wick actually is. The longer the better.


Range Filter StrategyThe Range Filter Strategy, based on @DonovanWall Range Filter indicator, is a trend-following trading system designed for TradingView. It identifies price trends by filtering market noise using a dynamic range based on user-defined metrics.
Functionality
Core Mechanism: The strategy calculates a central filter line (filt) with upper (h_band) and lower (l_band) bands, determined by price range and smoothing parameters, to detect trend direction.
Trend Signals:
Uptrend: Initiates a long entry when the filter line rises (filt > filt ).
Downtrend: Initiates a short entry when the filter line falls (filt < filt ).
Range Calculation: The range size is configurable using metrics such as ATR, Standard Deviation, or Percentage of Price, scaled by a user-defined quantity (rng_qty).
Smoothing: Optional EMA-based smoothing (smooth_range) refines the range to reduce false signals.
Entry/Exit Rules:
Entries: Long or short positions are opened when the trend direction changes.
Exits: Stop-loss and take-profit levels are set using the filter range, scaled by multipliers (sl_multiplier, tp_multiplier).
Position Sizing: Risks a fixed percentage of equity (default 1%) per trade, calculated based on stop-loss distance.
Commission: Incorporates trading costs (default 0.1% per trade), adjustable to match broker fees.
Key Features
Inputs:
Filter Type: Select between Type 1 (basic range filter) or Type 2 (step-based filter).
Movement Source: Choose wicks (high/low) or close prices.
Range Scale: Options include Pips, Points, Ticks, % of Price, ATR, Average Change, or Standard Deviation.
Smoothing: Enable/disable range smoothing and set period.
Risk Management: Configure risk per trade, stop-loss, and take-profit multipliers.
Visuals: Plots the filter line (green for uptrend, red for downtrend) and bands (transparent green/red). Fills between bands enhance visibility.
Output: Provides trend signals (fdir) for external use.
Usage Instructions
Setup: Apply to any chart (e.g., forex, stocks, crypto) and timeframe. Adjust inputs such as rng_qty, rng_per, sl_multiplier, and tp_multiplier to optimize for specific markets.
Trading: Enter long positions on green filter line uptrends and short positions on red filter line downtrends. Exits are automated via stop-loss and take-profit.
Backtesting: Use TradingView's strategy tester to evaluate performance and refine parameters for profitability.
Commission: Set commission_value to align with your broker’s fees for accurate net profit calculations.
Disclaimer
The Range Filter Strategy is provided for educational and informational purposes only and does not constitute financial advice. Trading carries significant risks, including potential loss of capital, and is not suitable for all investors. Past performance is not indicative of future results. Users are solely responsible for their trading decisions and should conduct thorough backtesting and validation on TradingView before deploying real capital. Adjust parameters and commission settings to reflect your broker and market conditions. Consult a qualified financial advisor prior to trading. The developers and associated parties are not liable for any losses incurred.

Swing Buy/Sell with ATR FilterCustomization Tips
atrMult: Increase to reduce false signals (e.g., 1.5 = only take trades in stronger volatility)
swingLen: You can adjust this to 2 or 3 for smoother but fewer signals
Add MA or RSI filter: For trend-following or overbought/oversold filtering

📅 Candle Highlight: Weekly / Monthly / Yearly Open📝 Description:
This minimalist indicator highlights the exact candles where a new week, month, or year begins.
No lines, no labels — just subtle background coloring directly on the candles, making it easy to spot period transitions without cluttering the chart.
⚙️ Features:
✅ Highlights weekly open candles (green)
✅ Highlights monthly open candles (orange)
✅ Highlights yearly open candles (red)
✅ Clean and non-intrusive design
✅ Fully customizable toggles for each type
Perfect for traders using time-based strategies, liquidity timing, or weekly/monthly open reference points.

Swing High/Low (Length 1)How It Works
swing High is true when the previous bar's high is higher than both its neighbors.
swing Low is true when the previous bar's low is lower than both its neighbors.
Shapes are plotted at the bar where the swing actually occurred (offset by -1 to align properly).
Tips:
This is very sensitive — you might want to combine it with filters like:
ATR filter to ignore small swings
volume filter to validate significant moves
For more meaningful swings, try increasing the window size (e.g., length = 3 or 5).

NUPL-Z EMAEnhanced version of CipherDecoded's "NUPL-Z for Loop" Indicator.
I just added adjustable smoothing to reduce signal noise.

LinReg Candle Strategy - Arrows at LinReg High/LowVisual Result:
✅ Arrows appear exactly at the smoothed candle low (buy) or high (sell)
✅ Still uses strategy entries (you can backtest)
✅ Clean layout with LinReg candles and EMAs

Combined Trading System: EMAs + ATR + RSIThis indicator gives entry and exit based on rsi , moving average and atr trailing stop

Green Candle Buy Signal with Target Confirmationin this indicator signal are with buy and Target
so it will be easy for us to recognize signal

Green Candle Buy Signal with Targetit produce buy signal on special bullish candle .
data of positive day closing is 90% above .

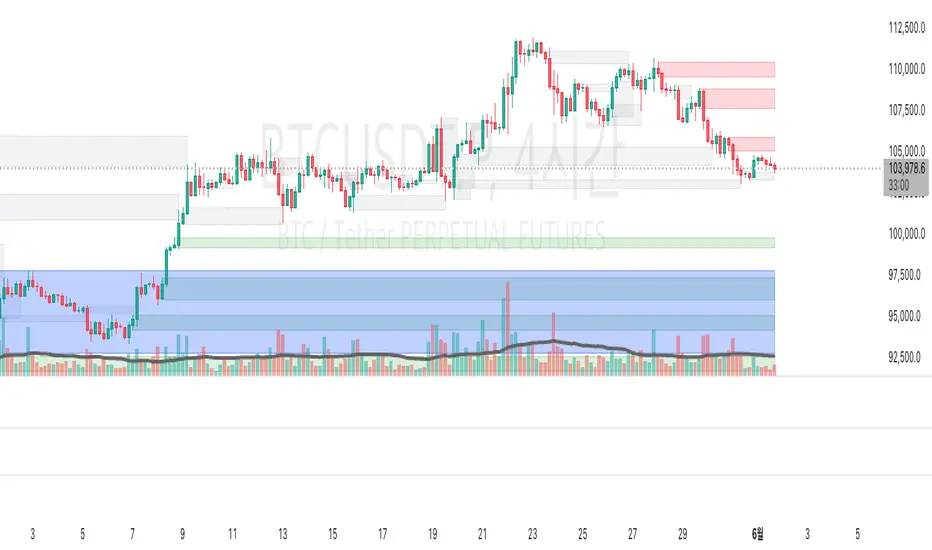
MirPapa:ICT:HTF: FVG OB Threeple# MirPapa:ICT:HTF: FVG OB (Fair Value Gap Order Block)
**Version:** Pine Script® v6
**Author:** © goodia
**License:** MPL-2.0 (Mozilla Public License 2.0)
---
## Overview
“FVG OB” (Fair Value Gap Order Block) identifies higher-timeframe candle ranges where a gap (imbalance) exists between two non-consecutive candles, signaling potential institutional order blocks. This module draws bullish or bearish FVG OB boxes on your lower-timeframe chart, extends them until price interacts a specified number of times, and then finalizes (recolors) the box.
---
## Inputs
- **Enable FVG OB Boxes** (`bool`)
Toggle drawing of HTF FVG OB boxes on the chart.
- **Enable FVG OB Midlines** (`bool`)
Toggle drawing of a midpoint line inside each FVG OB box.
- **FVG OB Close Count** (`int` 1–10)
Number of HTF closes beyond the FVG range required to finalize (recolor) the box.
- **FVG OB Bull Color** (`color`)
Fill & border color for bullish FVG OB boxes.
- **FVG OB Bear Color** (`color`)
Fill & border color for bearish FVG OB boxes.
- **FVG OB Box Transparency** (`int` 1–100)
Opacity level for FVG OB box fills (higher = more transparent).
---
## How It Works
1. **HTF Data Retrieval**
- The script uses `request.security()` (via `GetHTFrevised()`) to fetch HTF OHLC and historical values:
- `_htfHigh3` (high three bars ago) and `_htfLow1` (low one bar ago) for bullish FVG OB.
- `_htfLow3` (low three bars ago) and `_htfHigh1` (high one bar ago) for bearish FVG OB.
- It also tracks the HTF `bar_index` on the lower timeframe to align drawing.
2. **FVG OB Detection**
- **Bullish FVG OB**: Occurs when the HTF low of the previous bar (`low `) is strictly above the HTF high of three bars ago (`high `), creating a gap.
- **Bearish FVG OB**: Occurs when the HTF high of the previous bar (`high `) is strictly below the HTF low of three bars ago (`low `), creating a gap.
3. **Box Creation**
- On each new HTF bar (`ta.change(time(HTF)) != 0`), if a bullish or bearish FVG OB condition is met, the script calls `CreateBoxData()` with:
- **Bullish**: `bottom = HTF low `, `top = HTF high `, `_isBull = true`.
- **Bearish**: `bottom = HTF low `, `top = HTF high `, `_isBull = false`.
- Midline toggled by input.
- A `BoxData` struct is created and stored in either the Bull or Bear array.
4. **Box Extension & Finalization**
- On **every LTF bar**, `ProcessBoxDatas(...)` iterates over all active FVG OB boxes:
1. **Extend Right Edge**: `box.set_right(bar_index)` ensures the box follows the latest bar.
2. **Record Volume Delta**: Tracks buy/sell volume inside the box.
3. **Touch Stage Update**: `modBoxUpdateStage()` increments `_stage` when price touches its “basePoint” (for FVG OB, the basePrice is one side of the gap).
4. **Finalize**: `setBoxFinalize()` checks if the configured number of closes beyond the FVG gap (`FVG OB Close Count`) has occurred. If so:
- `_isActive := false`
- Border and background colors are changed to the “Box Close Color” (input).
- Finalized boxes remain on screen semi-transparent, indicating that the FVG OB zone has been tested.
5. **Midline (Optional)**
- If “Enable FVG OB Midlines” is checked, `ProcessBoxDatas()` also extends a horizontal midpoint line inside the box with `line.set_x2(bar_index)`.
---
## Usage Instructions
1. **Installation**
- Copy the FVG OB section of the Pine Script into TradingView’s Pine Editor (ensure the library import is included).
- Click “Add to Chart.”
2. **Configure Inputs**
- Choose a Higher Time Frame via the dropdown (e.g., “4시간” maps to a 4H timeframe).
- Toggle “Enable FVG OB Boxes” and “Enable FVG OB Midlines.”
- Select colors for bullish and bearish boxes and set transparency.
- Adjust “FVG OB Close Count” to control how many closes beyond the gap finalize the box.
3. **Interpretation**
- **Active FVG OB Boxes** extend to the right until price closes beyond the gap range the specified number of times.
- When finalized, each box changes to the “Box Close Color,” signaling that institutional orders in that gap have likely been filled.
Enjoy precise visualization of higher-timeframe Fair Value Gap Order Blocks on your lower-timeframe chart!
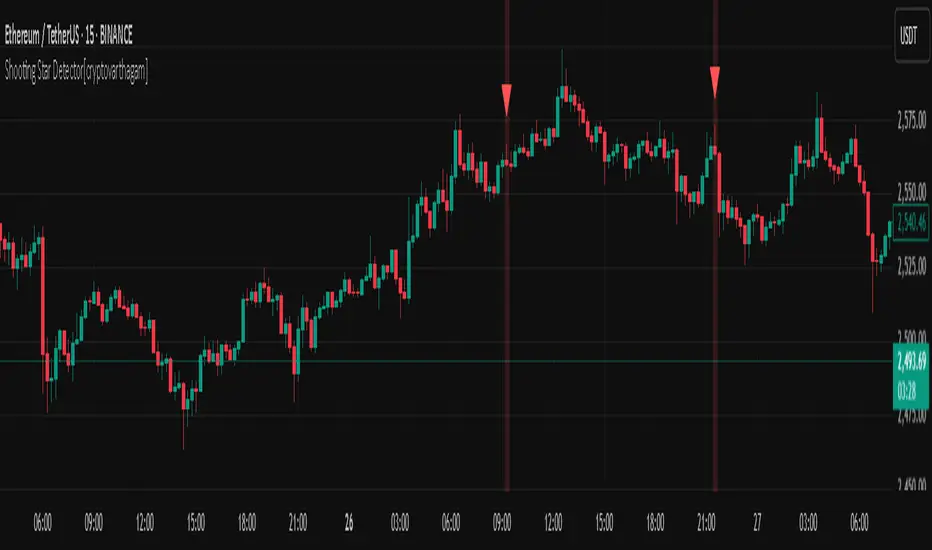
Shooting Star Detector[cryptovarthagam]🌠 Shooting Star Detector
The Shooting Star Detector is a powerful price action tool that automatically identifies potential bearish reversal signals using the well-known Shooting Star candlestick pattern.
Ideal for traders who rely on candlestick psychology to spot high-probability short setups, this script works across all markets and timeframes.
🔍 What is a Shooting Star?
A Shooting Star is a single-candle pattern that typically forms at the top of an uptrend or resistance zone. It’s characterized by:
A small body near the candle's low,
A long upper wick, and
Little or no lower wick.
This pattern suggests that buyers pushed price higher but lost control by the close, hinting at potential bearish momentum ahead.
✅ Indicator Features:
🔴 Accurately detects Shooting Star candles in real-time
🔺 Plots a red triangle above every valid signal candle
🖼️ Optional background highlight for visual clarity
🕵️♂️ Strict ratio-based detection using:
Wick-to-body comparisons
Upper wick dominance
Optional bearish candle confirmation
⚙️ Detection Logic (Rules Used):
Upper wick > 60% of total candle range
Body < 20% of total candle
Lower wick < 15% of candle range
Bearish candle (optional but included for accuracy)
These rules ensure high-quality signals that filter out false positives.
📌 Best Use Cases:
Spotting trend reversals at swing highs
Confirming entries near resistance zones
Enhancing price action or supply/demand strategies
Works on: Crypto, Forex, Stocks, Commodities
🧠 Trading Tip:
Pair this detector with volume confirmation, resistance zones, or bearish divergence for higher-probability entries.
📉 Clean, minimal, and non-repainting — designed for traders who value accuracy over noise.
Created with ❤️ by Cryptovarthagam
Follow for more real-time price action tools!
3-Min Buy/Sell Signal from 15-Min Linear RegressionShows Buy below the 3-min candle when all bullish conditions match.
Shows Sell above the 3-min candle when all bearish conditions match.
Fully customizable (EMA lengths, proximity %, and angle threshold).

Estratégia Elite Traders CriptoCRYPTO PROFITABLE AI Script (Pro Version 1.3) Completely free version with entry signals for buying and selling. Premium version under development. For more information, send a message.

Indicator Buy Sell by Daraviththis indicator make for help trader about signal buy sell and trend line

Multi MA 10 Lines PRO (Custom Label + ATR Cross)Headline
Multi MA 10 Lines PRO — Custom Label & ATR Cross
All-in-One Professional Moving Average Toolkit for Serious Traders.
Description
Multi MA 10 Lines PRO (Custom Label + ATR Cross)
This indicator gives you the ultimate flexibility for trend analysis and market momentum:
Up to 10 fully-customizable Moving Averages: Select from EMA, SMA, WMA, HMA, VWMA, or RMA, set independent timeframes, colors, and styles for each line.
Pro Custom MA Label: Display value and % distance from current price at the end of each MA. Adjust label size, color, content, and visibility.
ATR Crossover Signal: Instantly visualize every crossover between MA1 & MA2 with a vivid ATR bar and a label showing “Cross: ” right at the event. Fine-tune ATR period, signal color, and label style.
Streamlined & Professional Visualization: Designed for advanced users needing clarity in complex setups — minimal chart clutter, powerful signal display, and maximum configurability.
Whether you’re a trend follower, scalper, or swing trader — this toolkit is made to adapt to your strategy and charting workflow.
Tip: Use the MA1 & MA2 cross/ATR as dynamic trade trigger, and combine the custom MA labels for multi-timeframe confluence!

Cumulative Volume Delta (CVD) [Simulated] CVD with VWAP
VWAP comparison
See when price diverges from VWAP
✅ CVD crossover alerts
Get notified when smart money diverges
✅ Moving Average of CVD
Smooth noisy volume data
✅ Visual signal labels
Arrows on chart to spot traps


VWAP + Vol Labels AlertThis script displays real-time VWAP (Volume Weighted Average Price), current 1-minute volume, and the 20-bar volume average for BTC/GBP. It also emits these values in structured JSON format via the alert() function, enabling easy integration with automation systems like GPT-based bots, Discord alerts, or trading webhooks.


Scalping RSI 1 Min con TP/SL y SalidasActualizacion de Scalping de temporalidad de 1min -Julio- 05-31-25

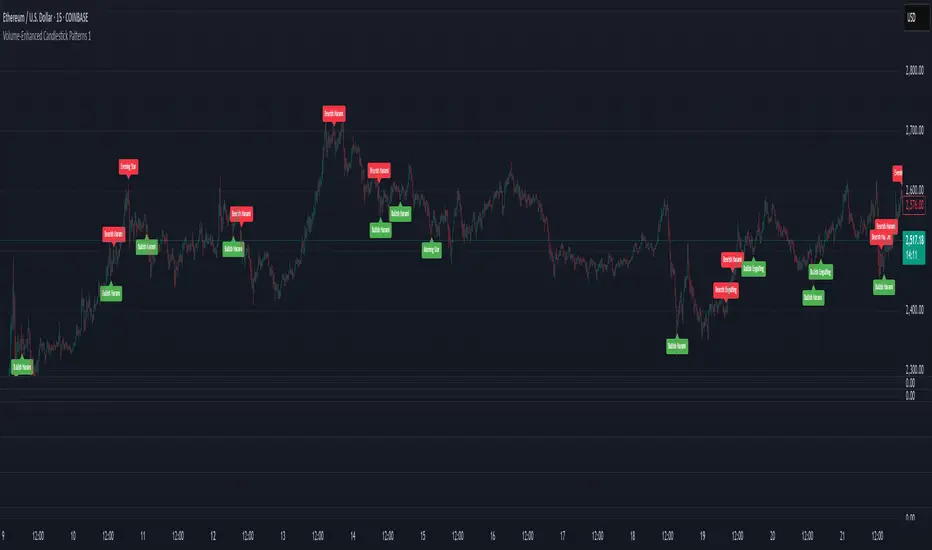
Volume-Enhanced Candlestick Patterns 1
Overview
Scans for four major candlestick reversal patterns:
Harami
Engulfing
Morning/Evening Star
Piercing Line/Dark Cloud Cover
Underlying logic assumes that, at a turning point, the dominant side (bulls or bears) often delivers a “final” push—either a last surge of buying or selling—before the reversal truly takes hold.
Pattern Toggles
Each individual pattern can be turned on or off in the inputs.
Enable only the patterns you want to monitor to reduce chart clutter and speed up performance.
Volume Filter Toggle
On: Requires volume-based exhaustion or climax to confirm each pattern.
Off: Relies purely on price-action candlestick logic (no volume checks).
Grouped Labels & Confluence
When one or more patterns trigger on the same bar close, a single label is drawn:
Grouping multiple confirmed patterns on one bar increases confluence and signal strength.
Climax Volume × Multiplier
Adjusting this input affects signal frequency and conviction:
Higher multiplier → fewer signals but with stronger volume confirmation
Lower multiplier → more signals, each with a looser volume requirement
Alerts
Built-in alert condition for each individual pattern (bullish/bearish Harami, Engulfing, Star, Piercing, Dark Cloud Cover), so you can receive real-time notifications whenever a confirmation occurs.
Follow for Weekly Scripts
If you find this helpful, please hit Follow and 🚀button —I release a new scripts every week.
Disclaimer
Not Financial Advice. This script is for educational and research purposes only.
Use as Part of a Larger System. It should not be used in isolation; combine it with your own risk management rules, additional indicators, and broader market analysis.
No Guarantees. Candlestick patterns and volume filters can improve signal quality, but they do not guarantee profitable trades. Always perform your own due diligence before entering any position.