Market Mafia Sniper Strategy - XOTWODThe Market Mafia Sniper is a professional-grade, multi-timeframe precision trading system designed for scalping, intraday, swing, and position trading across any Forex, Crypto, Indices, and Metals market.
🚀 Core Features:
Entry Bias Detection: Trades only in the direction of major trend bias using EMA 200 and VWAP confluence.
Advanced Confirmation: Confirms entries with MACD crossovers and RSI momentum filtering.
Multi-Timeframe Power: Simultaneously scans 15 minutes, 1 hour, 4 hours, and Daily timeframes for sniper signals.
Dynamic Take Profit: Adjusts Risk:Reward dynamically based on timeframe-specific ATR measurements.
Indicators and strategies

Accurate Swing Trading System - Strategy//@version=5
strategy("Accurate Swing Trading System - Strategy", overlay=true)
// Inputs
no = input.int(3, title="Swing")
Barcolor = input.bool(true, title="Barcolor")
Bgcolor = input.bool(false, title="Bgcolor")
// Logic
res = ta.highest(high, no)
sup = ta.lowest(low, no)
avd = close > res ? 1 : close < sup ? -1 : 0
avn = ta.valuewhen(avd != 0, avd, 0)
tsl = avn == 1 ? sup : res
Buy = ta.crossover(close, tsl)
Sell = ta.crossunder(close, tsl)
// Plotting
plotshape(Buy, title="BUY", style=shape.labelup, location=location.belowbar, color=color.green, text="BUY", textcolor=color.black)
plotshape(Sell, title="SELL", style=shape.labeldown, location=location.abovebar, color=color.red, text="SELL", textcolor=color.black)
colr = close >= tsl ? color.green : close <= tsl ? color.red : na
plot(tsl, color=colr, linewidth=3, title="TSL")
barcolor(Barcolor ? colr : na)
bgcolor(Bgcolor ? colr : na)
// Alerts
alertcondition(Buy, title="Buy Signal", message="Buy")
alertcondition(Sell, title="Sell Signal", message="Sell")
// Strategy Orders
if Buy
strategy.entry("Buy", strategy.long)
if Sell
strategy.close("Buy")

Rawstocks 15 Minute ModelRawstocks 15-Minute Model
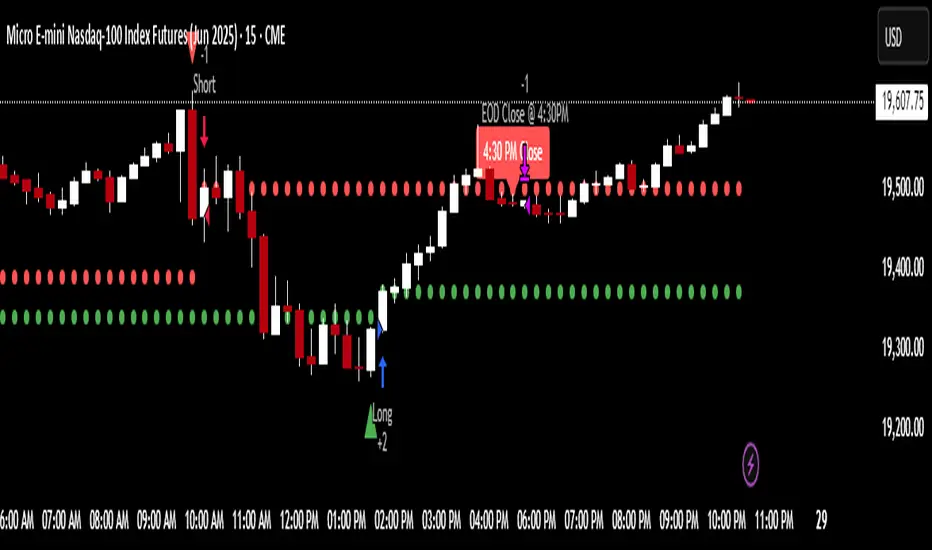
The Rawstocks 15-Minute Model is a precision intraday trading strategy designed for the US stock market (9:30 AM - 4:00 PM ET), optimized for the 15-minute timeframe. It combines institutional order flow concepts with Fibonacci retracements to identify high-probability reversal setups while enforcing strict risk management and session-based rules.
Key Features
Time-Based Execution
Trading Hours: 9:30 AM - 4:00 PM ET (no new entries after 4:00 PM)
Force Close: All positions auto-exit at 4:30 PM ET (prevents overnight risk)
Entry Logic
Order Block + Fib Confluence:
Identifies institutional order blocks (previous swing highs/lows)
Requires price pullback to 61.8% or 79% Fibonacci level
Liquidity Confirmation:
Waits for stop runs (liquidity sweeps) before reversal entries
Exit Rules
Stop Loss: 1x ATR (14) from entry
Take Profit: 2:1 Risk-Reward (adjustable)
Visual Signals
Green Triangle: Valid long setup (pullback to bullish OB + Fib)
Red Triangle: Valid short setup (pullback to bearish OB + Fib)
Blue/Purple Background: Highlights active trading vs. close period
How It Works
Identify the Setup
Wait for a strong impulse move (break of structure)
Mark the order block (institutional zone)
Confirm Pullback
Price must retrace to 61.8% or 79% Fib level
Must occur within trading hours (9:30 AM - 4:00 PM)
Enter on Confirmation
Long: Break of pullback candle high (stop below recent swing low)
Short: Break of pullback candle low (stop above recent swing high)
Manage the Trade
Trail stop or exit at 2R (risk-to-reward)
All positions close at 4:30 PM sharp
15-Min ORB Strategy )15 min orb with trailing orders. could use some refinement to mitigate drawdown. better if you recalculate after each bar. i made this for NQ

Williams R Zone Scalper v1.0[BullByte]Originality & Usefulness
Unlike standard Williams R cross-over scripts, this strategy layers five dynamic filters—moving-average trend, Supertrend, Choppiness Index, Bollinger Band Width, and volume validation —and presents a real-time dashboard with equity, PnL, filter status, and key indicator values. No other public Pine script combines these elements with toggleable filters and a custom dashboard. In backtests (BTC/USD (Binance), 5 min, 24 Mar 2025 → 28 Apr 2025), adding these filters turned a –2.09 % standalone Williams R into a +5.05 % net winner while cutting maximum drawdown in half.
---
What This Script Does
- Monitors Williams R (length 14) for overbought/oversold reversals.
- Applies up to five dynamic filters to confirm trend strength and volatility direction:
- Moving average (SMA/EMA/WMA/HMA)
- Supertrend line
- Choppiness Index (CI)
- Bollinger Band Width (BBW)
- Volume vs. its 50-period MA
- Plots blue arrows for Long entries (R crosses above –80 + all filters green) and red arrows for Short entries (R crosses below –20 + all filters green).
- Optionally sets dynamic ATR-based stop-loss (1.5×ATR) and take-profit (2×ATR).
- Shows a dashboard box with current position, equity, PnL, filter status, and real-time Williams R / MA/volume values.
---
Backtest Summary (BTC/USD(Binance), 5 min, 24 Mar 2025 → 28 Apr 2025)
• Total P&L : +50.70 USD (+5.05 %)
• Max Drawdown : 31.93 USD (3.11 %)
• Total Trades : 198
• Win Rate : 55.05 % (109/89)
• Profit Factor : 1.288
• Commission : 0.01 % per trade
• Slippage : 0 ticks
Even in choppy March–April, this multi-filter approach nets +5 % with a robust risk profile, compared to –2.09 % and higher drawdown for Williams R alone.
---
Williams R Alone vs. Multi-Filter Version
• Total P&L :
– Williams R alone → –20.83 USD (–2.09 %)
– Multi-Filter → +50.70 USD (+5.05 %)
• Max Drawdown :
– Williams R alone → 62.13 USD (6.00 %)
– Multi-Filter → 31.93 USD (3.11 %)
• Total Trades : 543 vs. 198
• Win Rate : 60.22 % vs. 55.05 %
• Profit Factor : 0.943 vs. 1.288
---
Inputs & What They Control
- wrLen (14): Williams R look-back
- maType (EMA): Trend filter type (SMA, EMA, WMA, HMA)
- maLen (20): Moving-average period
- useChop (true): Toggle Choppiness Index filter
- ciLen (12): CI look-back length
- chopThr (38.2): CI threshold (below = trending)
- useVol (true): Toggle volume-above-average filter
- volMaLen (50): Volume MA period
- useBBW (false): Toggle Bollinger Band Width filter
- bbwMaLen (50): BBW MA period
- useST (false): Toggle Supertrend filter
- stAtrLen (10): Supertrend ATR length
- stFactor (3.0): Supertrend multiplier
- useSL (false): Toggle ATR-based SL/TP
- atrLen (14): ATR period for SL/TP
- slMult (1.5): SL = slMult × ATR
- tpMult (2.0): TP = tpMult × ATR
---
How to Read the Chart
- Blue arrow (Long): Williams R crosses above –80 + all enabled filters green
- Red arrow (Short) : Williams R crosses below –20 + all filters green
- Dashboard box:
- Top : position and equity
- Next : cumulative PnL in USD & %
- Middle : green/white dots for each filter (green=passing, white=disabled)
- Bottom : Williams R, MA, and volume current values
---
Usage Tips
- Add the script : Indicators → My Scripts → Williams R Zone Scalper v1.0 → Add to BTC/USD chart on 5 min.
- Defaults : Optimized for BTC/USD.
- Forex majors : Raise `chopThr` to ~42.
- Stocks/high-beta : Enable `useBBW`.
- Enable SL/TP : Toggle `useSL`; stop-loss = 1.5×ATR, take-profit = 2×ATR apply automatically.
---
Common Questions
- * Why not trade every Williams R reversal?*
Raw Williams R whipsaws in sideways markets. Choppiness and volume filters reduce false entries.
- *Can I use on 1 min or 15 min?*
Yes—adjust ATR length or thresholds accordingly. Defaults target 5 min scalping.
- *What if all filters are on?*
Fewer arrows, higher-quality signals. Expect ~10 % boost in average win size.
---
Disclaimer & License
Trading carries risk of loss. Use this script “as is” under the Mozilla Public License 2.0 (mozilla.org). Always backtest, paper-trade, and adjust risk settings to your own profile.
---
Credits & References
- Pine Script v6, using TradingView’s built-in `ta.supertrend()`.
- TradingView House Rules: www.tradingview.com
Goodluck!
BullByte

Dskyz (DAFE) Quantum Sentiment Flux - Beginners Dskyz (DAFE) Quantum Sentiment Flux - Beginners:
Welcome to the Dskyz (DAFE) Quantum Sentiment Flux - Beginners , a strategy and concept that’s your ultimate wingman for trading futures like MNQ, NQ, MES, and ES. This gem combines lightning-fast momentum signals, market sentiment smarts, and bulletproof risk management into a system so intuitive, even newbies can trade like pros. With clean DAFE visuals, preset modes for every vibe, and a revamped dashboard that’s basically a market GPS, this strategy makes futures trading feel like a high-octane sci-fi mission.
Built on the Dskyz (DAFE) legacy of Aurora Divergence, the Quantum Sentiment Flux is designed to empower beginners while giving seasoned traders a lean, sentiment-driven edge. It uses fast/slow EMA crossovers for entries, filters trades with VIX, SPX trends, and sector breadth, and keeps your account safe with adaptive stops and cooldowns. Tuned for more action with faster signals and a slick bottom-left dashboard, this updated version is ready to light up your charts and outsmart institutional traps. Let’s dive into why this strat’s a must-have and break down its brilliance.
Why Traders Need This Strategy
Futures markets are a wild ride—fast moves, volatility spikes (like the April 28, 2025 NQ 1k-point drop), and institutional games that can wreck unprepared traders. Beginners often get lost in complex systems or burned by impulsive trades. The Quantum Sentiment Flux is the antidote, offering:
Dead-Simple Setup: Preset modes (Aggressive, Balanced, Conservative) auto-tune signals, risk, and sizing, so you can trade without a quant degree.
Sentiment Superpower: VIX filter, SPX trend, and sector breadth visuals keep you aligned with market health, dodging chop and riding trends.
Ironclad Safety: Tighter ATR-based stops, 2:1 take-profits, and preset cooldowns protect your capital, even in chaotic sessions.
Next-Level Visuals: Green/red entry triangles, vibrant EMAs, a sector breadth background, and a beefed-up dashboard make signals and context pop.
DAFE Swagger: The clean aesthetics, sleek dashboard—ties it to Dskyz’s elite brand, making your charts a work of art.
Traders need this because it’s a plug-and-play system that blends beginner-friendly simplicity with pro-level market awareness. Whether you’re just starting or scalping 5min MNQ, this strat’s your key to trading with confidence and style.
Strategy Components
1. Core Signal Logic (High-Speed Momentum)
The strategy’s engine is a momentum-based system using fast and slow Exponential Moving Averages (EMAs), now tuned for faster, more frequent trades.
How It Works:
Fast/Slow EMAs: Fast EMA (Aggressive: 5, Balanced: 7, Conservative: 9 bars) and slow EMA (12/14/18 bars) track short-term vs. longer-term momentum.
Crossover Signals:
Buy: Fast EMA crosses above slow EMA, and trend_dir = 1 (fast EMA > slow EMA + ATR * strength threshold).
Sell: Fast EMA crosses below slow EMA, and trend_dir = -1 (fast EMA < slow EMA - ATR * strength threshold).
Strength Filter: ma_strength = fast EMA - slow EMA must exceed an ATR-scaled threshold (Aggressive: 0.15, Balanced: 0.18, Conservative: 0.25) for robust signals.
Trend Direction: trend_dir confirms momentum, filtering out weak crossovers in choppy markets.
Evolution:
Faster EMAs (down from 7–10/21–50) catch short-term trends, perfect for active futures markets.
Lower strength thresholds (0.15–0.25 vs. 0.3–0.5) make signals more sensitive, boosting trade frequency without sacrificing quality.
Preset tuning ensures beginners get optimized settings, while pros can tweak via mode selection.
2. Market Sentiment Filters
The strategy leans hard into market sentiment with a VIX filter, SPX trend analysis, and sector breadth visuals, keeping trades aligned with the big picture.
VIX Filter:
Logic: Blocks long entries if VIX > threshold (default: 20, can_long = vix_close < vix_limit). Shorts are always allowed (can_short = true).
Impact: Prevents longs during high-fear markets (e.g., VIX spikes in crashes), while allowing shorts to capitalize on downturns.
SPX Trend Filter:
Logic: Compares S&P 500 (SPX) close to its SMA (Aggressive: 5, Balanced: 8, Conservative: 12 bars). spx_trend = 1 (UP) if close > SMA, -1 (DOWN) if < SMA, 0 (FLAT) if neutral.
Impact: Provides dashboard context, encouraging trades that align with market direction (e.g., longs in UP trend).
Sector Breadth (Visual):
Logic: Tracks 10 sector ETFs (XLK, XLF, XLE, etc.) vs. their SMAs (same lengths as SPX). Each sector scores +1 (bullish), -1 (bearish), or 0 (neutral), summed as breadth (-10 to +10).
Display: Green background if breadth > 4, red if breadth < -4, else neutral. Dashboard shows sector trends (↑/↓/-).
Impact: Faster SMA lengths make breadth more responsive, reflecting sector rotations (e.g., tech surging, energy lagging).
Why It’s Brilliant:
- VIX filter adds pro-level volatility awareness, saving beginners from panic-driven losses.
- SPX and sector breadth give a 360° view of market health, boosting signal confidence (e.g., green BG + buy signal = high-probability trade).
- Shorter SMAs make sentiment visuals react faster, perfect for 5min charts.
3. Risk Management
The risk controls are a fortress, now tighter and more dynamic to support frequent trading while keeping accounts safe.
Preset-Based Risk:
Aggressive: Fast EMAs (5/12), tight stops (1.1x ATR), 1-bar cooldown. High trade frequency, higher risk.
Balanced: EMAs (7/14), 1.2x ATR stops, 1-bar cooldown. Versatile for most traders.
Conservative: EMAs (9/18), 1.3x ATR stops, 2-bar cooldown. Safer, fewer trades.
Impact: Auto-scales risk to match style, making it foolproof for beginners.
Adaptive Stops and Take-Profits:
Logic: Stops = entry ± ATR * atr_mult (1.1–1.3x, down from 1.2–2.0x). Take-profits = entry ± ATR * take_mult (2x stop distance, 2:1 reward/risk). Longs: stop below entry, TP above; shorts: vice versa.
Impact: Tighter stops increase trade turnover while maintaining solid risk/reward, adapting to volatility.
Trade Cooldown:
Logic: Preset-driven (Aggressive/Balanced: 1 bar, Conservative: 2 bars vs. old user-input 2). Ensures bar_index - last_trade_bar >= cooldown.
Impact: Faster cooldowns (especially Aggressive/Balanced) allow more trades, balanced by VIX and strength filters.
Contract Sizing:
Logic: User sets contracts (default: 1, max: 10), no preset cap (unlike old 7/5/3 suggestion).
Impact: Flexible but risks over-leverage; beginners should stick to low contracts.
Built To Be Reliable and Consistent:
- Tighter stops and faster cooldowns make it a high-octane system without blowing up accounts.
- Preset-driven risk removes guesswork, letting newbies trade confidently.
- 2:1 TPs ensure profitable trades outweigh losses, even in volatile sessions like April 27, 2025 ES slippage.
4. Trade Entry and Exit Logic
The entry/exit rules are simple yet razor-sharp, now with VIX filtering and faster signals:
Entry Conditions:
Long Entry: buy_signal (fast EMA crosses above slow EMA, trend_dir = 1), no position (strategy.position_size = 0), cooldown passed (can_trade), and VIX < 20 (can_long). Enters with user-defined contracts.
Short Entry: sell_signal (fast EMA crosses below slow EMA, trend_dir = -1), no position, cooldown passed, can_short (always true).
Logic: Tracks last_entry_bar for visuals, last_trade_bar for cooldowns.
Exit Conditions:
Stop-Loss/Take-Profit: ATR-based stops (1.1–1.3x) and TPs (2x stop distance). Longs exit if price hits stop (below) or TP (above); shorts vice versa.
No Other Exits: Keeps it straightforward, relying on stops/TPs.
5. DAFE Visuals
The visuals are pure DAFE magic, blending clean function with informative metrics utilized by professionals, now enhanced by faster signals and a responsive breadth background:
EMA Plots:
Display: Fast EMA (blue, 2px), slow EMA (orange, 2px), using faster lengths (5–9/12–18).
Purpose: Highlights momentum shifts, with crossovers signaling entries.
Sector Breadth Background:
Display: Green (90% transparent) if breadth > 4, red (90%) if breadth < -4, else neutral.
Purpose: Faster breadth_sma_len (5–12 vs. 10–50) reflects sector shifts in real-time, reinforcing signal strength.
- Visuals are intuitive, turning complex signals into clear buy/sell cues.
- Faster breadth background reacts to market rotations (e.g., tech vs. energy), giving a pro-level edge.
6. Sector Breadth Dashboard
The new bottom-left dashboard is a game-changer, a 3x16 table (black/gray theme) that’s your market command center:
Metrics:
VIX: Current VIX (red if > 20, gray if not).
SPX: Trend as “UP” (green), “DOWN” (red), or “FLAT” (gray).
Trade Longs: “OK” (green) if VIX < 20, “BLOCK” (red) if not.
Sector Breadth: 10 sectors (Tech, Financial, etc.) with trend arrows (↑ green, ↓ red, - gray).
Placeholder Row: Empty for future metrics (e.g., ATR, breadth score).
Purpose: Consolidates regime, volatility, market trend, and sector data, making decisions a breeze.
- VIX and SPX metrics add context, helping beginners avoid bad trades (e.g., no longs if “BLOCK”).
Sector arrows show market health at a glance, like a cheat code for sentiment.
Key Features
Beginner-Ready: Preset modes and clear visuals make futures trading a breeze.
Sentiment-Driven: VIX filter, SPX trend, and sector breadth keep you in sync with the market.
High-Frequency: Faster EMAs, tighter stops, and short cooldowns boost trade volume.
Safe and Smart: Adaptive stops/TPs and cooldowns protect capital while maximizing wins.
Visual Mastery: DAFE’s clean flair, EMAs, dashboard—makes trading fun and clear.
Backtestable: Lean code and fixed qty ensure accurate historical testing.
How to Use
Add to Chart: Load on a 5min MNQ/ES chart in TradingView.
Pick Preset: Aggressive (scalping), Balanced (versatile), or Conservative (safe). Balanced is default.
Set Contracts: Default 1, max 10. Stick low for safety.
Check Dashboard: Bottom-left shows preset, VIX, SPX, and sectors. “OK” + green breadth = strong buy.
Backtest: Run in strategy tester to compare modes.
Live Trade: Connect to Tradovate or similar. Watch for slippage (e.g., April 27, 2025 ES issues).
Replay Test: Try April 28, 2025 NQ drop to see VIX filter and stops in action.
Why It’s Brilliant
The Dskyz (DAFE) Quantum Sentiment Flux - Beginners is a masterpiece of simplicity and power. It takes pro-level tools—momentum, VIX, sector breadth—and wraps them in a system anyone can run. Faster signals and tighter stops make it a trading machine, while the VIX filter and dashboard keep you ahead of market chaos. The DAFE visuals and bottom-left command center turn your chart into a futuristic cockpit, guiding you through every trade. For beginners, it’s a safe entry to futures; for pros, it’s a scalping beast with sentiment smarts. This strat doesn’t just trade—it transforms how you see the market.
Final Notes
This is more than a strategy—it’s your launchpad to mastering futures with Dskyz (DAFE) flair. The Quantum Sentiment Flux blends accessibility, speed, and market savvy to help you outsmart the game. Load it, watch those triangles glow, and let’s make the markets your canvas!
Official Statement from Pine Script Team
(see TradingView help docs and forums):
"This warning may appear when you call functions such as ta.sma inside a request.security in a loop. There is no runtime impact. If you need to loop through a dynamic list of tickers, this cannot be avoided in the present version... Values will still be correct. Ignore this warning in such contexts."
(This publishing will most likely be taken down do to some miscellaneous rule about properly displaying charting symbols, or whatever. Once I've identified what part of the publishing they want to pick on, I'll adjust and repost.)
Use it with discipline. Use it with clarity. Trade smarter.
**I will continue to release incredible strategies and indicators until I turn this into a brand or until someone offers me a contract.
Created by Dskyz, powered by DAFE Trading Systems. Trade fast, trade bold.

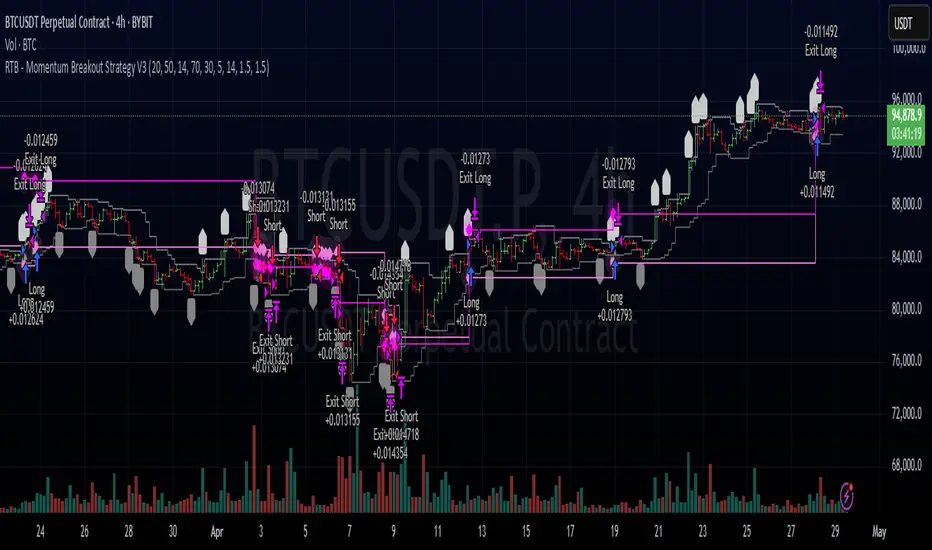
RTB - Momentum Breakout Strategy V3
📈 RTB - Momentum Breakout Strategy V3 is a directional breakout strategy based on momentum. It combines exponential moving averages (EMAs), RSI, and recent support/resistance levels to detect breakout entries with trend confirmation. The system includes dynamic risk management using ATR-based stop-loss and trailing stop levels. Webhook alerts are supported for external automated trading integrations.
🔎 The strategy was backtested using default parameters on BTCUSDT Futures (Bybit) with 4-hour timeframe and a 0.05% commission per trade.
⚠️ This script is for educational purposes only and does not constitute financial advice. Always do your own research before trading.
EMA Crossover Strategy with AlertsEMA Crossover Strategy with Alerts
Overview
The EMA Crossover Strategy is a popular trend-following trading strategy that utilizes two Exponential Moving Averages (EMAs) to identify potential buy and sell signals. This strategy is designed to help traders capture significant market trends by generating alerts when a crossover or crossunder occurs between the short-term and long-term EMAs.
Strategy Details
Short EMA Length: 9 periods
Long EMA Length: 21 periods
How It Works
Calculation of EMAs:
The strategy calculates two EMAs: a short-term EMA (9 periods) and a long-term EMA (21 periods).
Crossover and Crossunder Conditions:
Crossover Condition: A buy signal is generated when the short-term EMA crosses above the long-term EMA.
Crossunder Condition: A sell signal is generated when the short-term EMA crosses below the long-term EMA.
Buy and Sell Signals:
Buy Signal: Plotted below the bar with a green label when the crossover condition is met.
Sell Signal: Plotted above the bar with a red label when the crossunder condition is met.
Alerts:
Alerts are set up to notify traders when a buy or sell signal is generated:
Buy Alert: Triggered when the short-term EMA crosses above the long-term EMA.
Sell Alert: Triggered when the short-term EMA crosses below the long-term EMA.
Strategy Execution:
Buy Entry: The strategy enters a long position when the buy condition is met.
Sell Entry: The strategy enters a short position when the sell condition is met.
Benefits
Trend Identification: Helps traders identify and follow strong market trends.
Clear Signals: Provides clear buy and sell signals based on EMA crossovers.
Alerts: Keeps traders informed with real-time alerts for buy and sell signals.
Usage
This strategy is suitable for various markets and timeframes. Traders can customize the EMA lengths to fit their specific trading style and market conditions.


Breakout Trend Follower with MACD v2This is a breakout trend following strategy that uses MACD and ADX to help optimize. I like to use this against SOL on the 1D chart It is yield about 2200% profit from the inital start date on Coinbase Would love feedback

Advanced MACD Strategy (EURUSD 5min)This is an advanced MACD-based trading strategy designed specifically for the EURUSD forex pair on the 5-minute timeframe. It combines traditional MACD crossovers with powerful trend, momentum, volume, and volatility filters to increase trade quality and reduce false signals.
Key Features:
MACD Cross + Histogram Confirmation:
Entries occur only when MACD line crosses the Signal line with supporting momentum from the MACD histogram.
200 EMA Trend Filter:
Trades are allowed only in the direction of the dominant market trend (above EMA for longs, below EMA for shorts).
Volume Filter:
Ensures entries only happen when volume is above its 20-period average, helping avoid illiquid market conditions.
ATR-Based Dynamic Risk Management:
Stop-loss set at 1× ATR from entry price.
Take-profit set at 2× ATR from entry price.
Emergency exits are triggered after 4 hours if neither TP nor SL is hit.
Trading Hours Filter:
Trades are only allowed between 01:00 and 22:00 UTC to avoid low-liquidity periods.
Fully Adjustable Inputs:
All key parameters (MACD settings, EMA length, volume lookback, ATR multipliers, session hours) can be optimized for individual preferences.
Best Use:
Ideal for active traders who prefer high-frequency trading styles.
Designed for automated execution and easy integration with external bots (such as PineConnector ).
Works best during London and New York trading sessions due to higher liquidity.
Disclaimer:
Past performance does not guarantee future results. Always backtest and forward-test on demo accounts before trading live capital. Trading forex involves substantial risk.

3-Day Breakout Strategy with Trend Change Exit//@version=5
strategy("3-Day Breakout Strategy with Trend Change Exit", overlay=true, default_qty_type=strategy.percent_of_equity, default_qty_value=100)
// === Calculate 3-day high/low (excluding current bar) ===
high3 = ta.highest(high , 3)
low3 = ta.lowest(low , 3)
// === Entry conditions ===
longEntry = close > high3
shortEntry = close < low3
// === Track position state ===
isLong = strategy.position_size > 0
isShort = strategy.position_size < 0
wasLong = nz(strategy.position_size > 0)
wasShort = nz(strategy.position_size < 0)
// === Exit conditions ===
// Exit on trend reversal (new signal)
longExit = shortEntry // Exit long position when a short signal occurs
shortExit = longEntry // Exit short position when a long signal occurs
// === Execute entries ===
buySignal = longEntry and not isLong and not isShort
sellSignal = shortEntry and not isLong and not isShort
if (buySignal)
strategy.entry("Long", strategy.long)
if (sellSignal)
strategy.entry("Short", strategy.short)
// === Execute exits on opposite signal (trend change) ===
if (isLong and longExit)
strategy.close("Long")
if (isShort and shortExit)
strategy.close("Short")
// === Exit markers (on actual exit bar only) ===
exitLongSignal = wasLong and not isLong
exitShortSignal = wasShort and not isShort
// === Plot entry signals only on the entry bar ===
plotshape(buySignal, title="Buy Signal", location=location.belowbar, color=color.green, style=shape.labelup, text="BUY")
plotshape(sellSignal, title="Sell Signal", location=location.abovebar, color=color.red, style=shape.labeldown, text="SELL")
// === Plot exit signals only on the exit bar ===
plotshape(exitLongSignal, title="Exit Long", location=location.abovebar, color=color.orange, style=shape.labeldown, text="EXIT")
plotshape(exitShortSignal, title="Exit Short", location=location.belowbar, color=color.orange, style=shape.labelup, text="EXIT")

IMPOSSIBLE IS INMy Curiosity about all the trading Strategies and mindset came to an end. It has cost me a lot more than money to reach to this point, but with no regrets I present you the unbeatable🚩 inevitable dream strategy that could create unbelievable a
& catastrophic changes in your whole lifetime. This has cost me far more than any material value. A taste of lost luck and merely only my passion for my trading journey. I never stopped. Thank you.
And remember one thing age is just a number. I made this being a 23 year old Guy, whose was just dreaming along Situations that were totally depressing but life has its own ways
Try these setting on one hour time frame=
🎴BB Length 27
🎴BB StdDev 1.2
🎴Basis MA Type@ SMMA (…)
🎴Source: close
🎴Offset: 3
🕦Start Date: 2018-01-01🏁05:30
🕦End Date: 2069-12-31🏁23:59
🎴ATR Length🚩10
🎴ATR Multiplier for Trailing Stop🚩1.7
🤝Properties-
🎴Initial capital- 100000
🎴Base currency USD💵
👉🏻Order size: 25% of equity
👉🏻Pyramiding: 1
🎴 COST SIMULATION:
👉🏻Commission: 0.05
🎴MARGIN:
👉🏻Margin for long positions: 25%
👉🏻Margin for short positions: 25%
🎴RECALCULATE:
👉🏻 After order is filled:✅
👉🏻On every tick:✅
🎴FILL ORDERS:
👉🏻On bar close:✅
👉🏻 Using standard OHLC✅

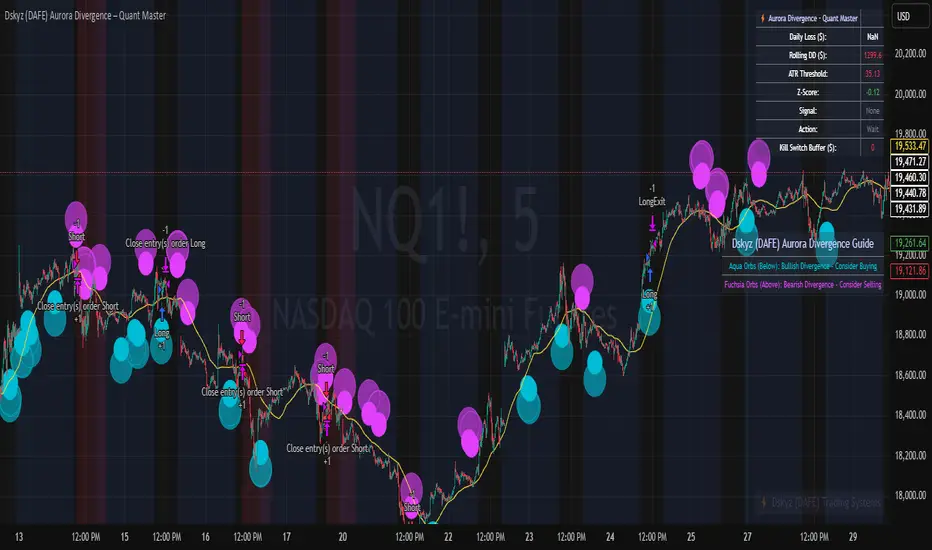
Dskyz (DAFE) Aurora Divergence – Quant Master Dskyz (DAFE) Aurora Divergence – Quant Master
Introducing the Dskyz (DAFE) Aurora Divergence – Quant Master , a strategy that’s your secret weapon for mastering futures markets like MNQ, NQ, MES, and ES. Born from the legendary Aurora Divergence indicator, this fully automated system transforms raw divergence signals into a quant-grade trading machine, blending precision, risk management, and cyberpunk DAFE visuals that make your charts glow like a neon skyline. Crafted with care and driven by community passion, this strategy stands out in a sea of generic scripts, offering traders a unique edge to outsmart institutional traps and navigate volatile markets.
The Aurora Divergence indicator was a cult favorite for spotting price-OBV divergences with its aqua and fuchsia orbs, but traders craved a system to act on those signals with discipline and automation. This strategy delivers, layering advanced filters (z-score, ATR, multi-timeframe, session), dynamic risk controls (kill switches, adaptive stops/TPs), and a real-time dashboard to turn insights into profits. Whether you’re a newbie dipping into futures or a pro hunting reversals, this strat’s got your back with a beginner guide, alerts, and visuals that make trading feel like a sci-fi mission. Let’s dive into every detail and see why this original DAFE creation is a must-have.
Why Traders Need This Strategy
Futures markets are a battlefield—fast-paced, volatile, and riddled with institutional games that can wipe out undisciplined traders. From the April 28, 2025 NQ 1k-point drop to sneaky ES slippage, the stakes are high. Meanwhile, platforms are flooded with unoriginal, low-effort scripts that promise the moon but deliver noise. The Aurora Divergence – Quant Master rises above, offering:
Unmatched Originality: A bespoke system built from the ground up, with custom divergence logic, DAFE visuals, and quant filters that set it apart from copycat clutter.
Automation with Precision: Executes trades on divergence signals, eliminating emotional slip-ups and ensuring consistency, even in chaotic sessions.
Quant-Grade Filters: Z-score, ATR, multi-timeframe, and session checks filter out noise, targeting high-probability reversals.
Robust Risk Management: Daily loss and rolling drawdown kill switches, plus ATR-based stops/TPs, protect your capital like a fortress.
Stunning DAFE Visuals: Aqua/fuchsia orbs, aurora bands, and a glowing dashboard make signals intuitive and charts a work of art.
Community-Driven: Evolved from trader feedback, this strat’s a labor of love, not a recycled knockoff.
Traders need this because it’s a complete, original system that blends accessibility, sophistication, and style. It’s your edge to trade smarter, not harder, in a market full of traps and imitators.
1. Divergence Detection (Core Signal Logic)
The strategy’s core is its ability to detect bullish and bearish divergences between price and On-Balance Volume (OBV), pinpointing reversals with surgical accuracy.
How It Works:
Price Slope: Uses linear regression over a lookback (default: 9 bars) to measure price momentum (priceSlope).
OBV Slope: OBV tracks volume flow (+volume if price rises, -volume if falls), with its slope calculated similarly (obvSlope).
Bullish Divergence: Price slope negative (falling), OBV slope positive (rising), and price above 50-bar SMA (trend_ma).
Bearish Divergence: Price slope positive (rising), OBV slope negative (falling), and price below 50-bar SMA.
Smoothing: Requires two consecutive divergence bars (bullDiv2, bearDiv2) to confirm signals, reducing false positives.
Strength: Divergence intensity (divStrength = |priceSlope * obvSlope| * sensitivity) is normalized (0–1, divStrengthNorm) for visuals.
Why It’s Brilliant:
- Divergences catch hidden momentum shifts, often exploited by institutions, giving you an edge on reversals.
- The 50-bar SMA filter aligns signals with the broader trend, avoiding choppy markets.
- Adjustable lookback (min: 3) and sensitivity (default: 1.0) let you tune for different instruments or timeframes.
2. Filters for Precision
Four advanced filters ensure signals are high-probability and market-aligned, cutting through the noise of volatile futures.
Z-Score Filter:
Logic: Calculates z-score ((close - SMA) / stdev) over a lookback (default: 50 bars). Blocks entries if |z-score| > threshold (default: 1.5) unless disabled (useZFilter = false).
Impact: Avoids trades during extreme price moves (e.g., blow-off tops), keeping you in statistically safe zones.
ATR Percentile Volatility Filter:
Logic: Tracks 14-bar ATR in a 100-bar window (default). Requires current ATR > 80th percentile (percATR) to trade (tradeOk).
Impact: Ensures sufficient volatility for meaningful moves, filtering out low-volume chop.
Multi-Timeframe (HTF) Trend Filter:
Logic: Uses a 50-bar SMA on a higher timeframe (default: 60min). Longs require price > HTF MA (bullTrendOK), shorts < HTF MA (bearTrendOK).
Impact: Aligns trades with the bigger trend, reducing counter-trend losses.
US Session Filter:
Logic: Restricts trading to 9:30am–4:00pm ET (default: enabled, useSession = true) using America/New_York timezone.
Impact: Focuses on high-liquidity hours, avoiding overnight spreads and erratic moves.
Evolution:
- These filters create a robust signal pipeline, ensuring trades are timed for optimal conditions.
- Customizable inputs (e.g., zThreshold, atrPercentile) let traders adapt to their style without compromising quality.
3. Risk Management
The strategy’s risk controls are a masterclass in balancing aggression and safety, protecting capital in volatile markets.
Daily Loss Kill Switch:
Logic: Tracks daily loss (dayStartEquity - strategy.equity). Halts trading if loss ≥ $300 (default) and enabled (killSwitch = true, killSwitchActive).
Impact: Caps daily downside, crucial during events like April 27, 2025 ES slippage.
Rolling Drawdown Kill Switch:
Logic: Monitors drawdown (rollingPeak - strategy.equity) over 100 bars (default). Stops trading if > $1000 (rollingKill).
Impact: Prevents prolonged losing streaks, preserving capital for better setups.
Dynamic Stop-Loss and Take-Profit:
Logic: Stops = entry ± ATR * multiplier (default: 1.0x, stopDist). TPs = entry ± ATR * 1.5x (profitDist). Longs: stop below, TP above; shorts: vice versa.
Impact: Adapts to volatility, keeping stops tight but realistic, with TPs targeting 1.5:1 reward/risk.
Max Bars in Trade:
Logic: Closes trades after 8 bars (default) if not already exited.
Impact: Frees capital from stagnant trades, maintaining efficiency.
Kill Switch Buffer Dashboard:
Logic: Shows smallest buffer ($300 - daily loss or $1000 - rolling DD). Displays 0 (red) if kill switch active, else buffer (green).
Impact: Real-time risk visibility, letting traders adjust dynamically.
Why It’s Brilliant:
- Kill switches and ATR-based exits create a safety net, rare in generic scripts.
- Customizable risk inputs (maxDailyLoss, dynamicStopMult) suit different account sizes.
- Buffer metric empowers disciplined trading, a DAFE signature.
4. Trade Entry and Exit Logic
The entry/exit rules are precise, filtered, and adaptive, ensuring trades are deliberate and profitable.
Entry Conditions:
Long Entry: bullDiv2, cooldown passed (canSignal), ATR filter passed (tradeOk), in US session (inSession), no kill switches (not killSwitchActive, not rollingKill), z-score OK (zOk), HTF trend bullish (bullTrendOK), no existing long (lastDirection != 1, position_size <= 0). Closes shorts first.
Short Entry: Same, but for bearDiv2, bearTrendOK, no long (lastDirection != -1, position_size >= 0). Closes longs first.
Adaptive Cooldown: Default 2 bars (cooldownBars). Doubles (up to 10) after a losing trade, resets after wins (dynamicCooldown).
Exit Conditions:
Stop-Loss/Take-Profit: Set per trade (ATR-based). Exits on stop/TP hits.
Other Exits: Closes if maxBarsInTrade reached, ATR filter fails, or kill switch activates.
Position Management: Ensures no conflicting positions, closing opposites before new entries.
Built To Be Reliable and Consistent:
- Multi-filtered entries minimize false signals, a stark contrast to basic scripts.
- Adaptive cooldown prevents overtrading, especially after losses.
- Clean position handling ensures smooth execution, even in fast markets.
5. DAFE Visuals
The visuals are a DAFE hallmark, blending function with clean flair to make signals intuitive and charts stunning.
Aurora Bands:
Display: Bands around price during divergences (bullish: below low, bearish: above high), sized by ATR * bandwidth (default: 0.5).
Colors: Aqua (bullish), fuchsia (bearish), with transparency tied to divStrengthNorm.
Purpose: Highlights divergence zones with a glowing, futuristic vibe.
Divergence Orbs:
Display: Large/small circles (aqua below for bullish, fuchsia above for bearish) when bullDiv2/bearDiv2 and canSignal. Labels show strength (0–1).
Purpose: Pinpoints entries with eye-catching clarity.
Gradient Background:
Display: Green (bullish), red (bearish), or gray (neutral), 90–95% transparent.
Purpose: Sets the market mood without clutter.
Strategy Plots:
- Stop/TP Lines: Red (stops), green (TPs) for active trades.
- HTF MA: Yellow line for trend context.
- Z-Score: Blue step-line (if enabled).
- Kill Switch Warning: Red background flash when active.
What Makes This Next-Level?:
- Visuals make complex signals (divergences, filters) instantly clear, even for beginners.
- DAFE’s unique aesthetic (orbs, bands) sets it apart from generic scripts, reinforcing originality.
- Functional plots (stops, TPs) enhance trade management.
6. Metrics Dashboard
The top-right dashboard (2x8 table) is your command center, delivering real-time insights.
Metrics:
Daily Loss ($): Current loss vs. day’s start, red if > $300.
Rolling DD ($): Drawdown vs. 100-bar peak, red if > $1000.
ATR Threshold: Current percATR, green if ATR exceeds, red if not.
Z-Score: Current value, green if within threshold, red if not.
Signal: “Bullish Div” (aqua), “Bearish Div” (fuchsia), or “None” (gray).
Action: “Consider Buying”/“Consider Selling” (signal color) or “Wait” (gray).
Kill Switch Buffer ($): Smallest buffer to kill switch, green if > 0, red if 0.
Why This Is Important?:
- Consolidates critical data, making decisions effortless.
- Color-coded metrics guide beginners (e.g., green action = go).
- Buffer metric adds transparency, rare in off-the-shelf scripts.
7. Beginner Guide
Beginner Guide: Middle-right table (shown once on chart load), explains aqua orbs (bullish, buy) and fuchsia orbs (bearish, sell).
Key Features:
Futures-Optimized: Tailored for MNQ, NQ, MES, ES with point-value adjustments.
Highly Customizable: Inputs for lookback, sensitivity, filters, and risk settings.
Real-Time Insights: Dashboard and visuals update every bar.
Backtest-Ready: Fixed qty and tick calc for accurate historical testing.
User-Friendly: Guide, visuals, and dashboard make it accessible yet powerful.
Original Design: DAFE’s unique logic and visuals stand out from generic scripts.
How to Use
Add to Chart: Load on a 5min MNQ/ES chart in TradingView.
Configure Inputs: Adjust instrument, filters, or risk (defaults optimized for MNQ).
Monitor Dashboard: Watch signals, actions, and risk metrics (top-right).
Backtest: Run in strategy tester to evaluate performance.
Live Trade: Connect to a broker (e.g., Tradovate) for automation. Watch for slippage (e.g., April 27, 2025 ES issues).
Replay Test: Use bar replay (e.g., April 28, 2025 NQ drop) to test volatility handling.
Disclaimer
Trading futures involves significant risk of loss and is not suitable for all investors. Past performance is not indicative of future results. Backtest results may not reflect live trading due to slippage, fees, or market conditions. Use this strategy at your own risk, and consult a financial advisor before trading. Dskyz (DAFE) Trading Systems is not responsible for any losses incurred.
Backtesting:
Frame: 2023-09-20 - 2025-04-29
Fee Typical Range (per side, per contract)
CME Exchange $1.14 – $1.20
Clearing $0.10 – $0.30
NFA Regulatory $0.02
Firm/Broker Commis. $0.25 – $0.80 (retail prop)
TOTAL $1.60 – $2.30 per side
Round Turn: (enter+exit) = $3.20 – $4.60 per contract
Final Notes
The Dskyz (DAFE) Aurora Divergence – Quant Master isn’t just a strategy—it’s a movement. Crafted with originality and driven by community passion, it rises above the flood of generic scripts to deliver a system that’s as powerful as it is beautiful. With its quant-grade logic, DAFE visuals, and robust risk controls, it empowers traders to tackle futures with confidence and style. Join the DAFE crew, light up your charts, and let’s outsmart the markets together!
(This publishing will most likely be taken down do to some miscellaneous rule about properly displaying charting symbols, or whatever. Once I've identified what part of the publishing they want to pick on, I'll adjust and repost.)
Use it with discipline. Use it with clarity. Trade smarter.
**I will continue to release incredible strategies and indicators until I turn this into a brand or until someone offers me a contract.
Created by Dskyz, powered by DAFE Trading Systems. Trade fast, trade bold.
SuperTrade ST1 StrategyThis strategy leverages the Supertrend indicator to identify trend direction and capture key entry and exit points in the market. By utilizing ATR (Average True Range) for dynamic stop-loss and take-profit levels, this script adapts to varying market conditions for improved risk management.
Key Features
Supertrend Indicator: Defines the trend direction and generates buy/sell signals based on trend reversal points.
ATR-based Exits: Take Profit and Stop Loss are dynamically calculated using ATR multipliers to accommodate market volatility.
Customizable Inputs: Fine-tune the ATR Length, Supertrend Factor, and ATR multipliers for take-profit and stop-loss according to your strategy preferences.
Visual Indicators: Buy and Sell signals are clearly marked with labels on the chart, and the Supertrend line is color-coded for easy trend identification.
Background Trend Highlighting: The chart background changes color based on the prevailing trend to make it easier to follow the market direction.
This strategy is perfect for traders looking to ride trends while managing risk with smart, automated exits.

ZLSMACE StrategyZLSMACE Strategy
This is a trend-following strategy that combines:
-Zero-Lag LSMA (ZLSMA): A smoothed, low-lag moving average used to confirm trend direction.
-Chandelier Exit (CE): A volatility-based trailing stop used to detect reversals and shift trade direction.
🟢 Entry Conditions:
Long: CE direction turns bullish and price is above ZLSMA
Short: CE direction turns bearish and price is below ZLSMA
The strategy exits any opposite position before opening a new one, ensuring clean direction switching.
🕒 Best Timeframe
Optimized for 15-minute charts (15m)
Good balance between signal speed and trend filtering

working stratthis bot enters on an inverted fair value gap being formed while the 20 trama is crossed, with a take profit at the 200T, and a SL at the local lows or highs, and only entering when the 200T is relatively flat

RSI SR OB Breakouts Strategy PRO (coffeshopcrypto)This was originally an indicator that I took from coffeshopcrypto, all credit to them. I simply turned it into a strategy. Only additions are TP/SL Levels based off of ticks and an optional EMA Filter
Original Script:

Nexus Trade BotThe Nexus Trade Bot is a sophisticated TradingView Pine Script™ v6 strategy designed for automated trading across forex, futures, stocks, and crypto. It combines trend analysis (using ROC and SMA), Squeeze Momentum, and EMA signals to identify high-probability trade entries and exits. Key features include customizable higher timeframe (HTF) trend confirmation (default 30-min), ATR-based trailing or fixed stop-loss, and robust session management with UTC-based trading hours. JSON alerts integrate seamlessly with webhooks for external apps, providing detailed trade and session data. Ideal for traders seeking a reliable, adaptable automation tool. Defaults and data are tested only for MNQ1! on the 5M timeframe.

SuperTrade Ichimoku Cloud StrategyUnlike SuperTrade's Super Trend the Ichimoku Cloud Strategy is a trend-following system derived from the Ichimoku Kinko Hyo indicator. It helps identify market direction, momentum, and potential support/resistance zones. This strategy uses key components of the Ichimoku Cloud to determine bullish or bearish trends and executes trades accordingly.
🔍 Key Components Used
Conversion Line (Tenkan-sen) – short-term average (9-period Donchian midpoint by default)
Base Line (Kijun-sen) – medium-term average (26-period Donchian midpoint)
Leading Span A (Senkou Span A) – average of Conversion Line and Base Line, plotted forward by 26 periods.
Leading Span B (Senkou Span B) – 52-period Donchian midpoint, plotted forward by 26 periods.
Lagging Span (Chikou Span) – current close price, plotted backward by 26 periods (for visual reference only in this version).
The cloud (Kumo) is the area between Leading Span A and B, representing trend direction and potential support/resistance.
📈 Entry Rules (Buy Condition)
A long trade is entered when:
LeadLine1 > LeadLine2 → This implies a bullish cloud.
Close > LeadLine1 and Close > LeadLine2 → The price is trading above the cloud, confirming upward momentum.
This combination indicates a strong bullish trend, so the strategy enters a long position.
📉 Exit Rules (Sell Condition / Close Position)
The long trade is closed when:
LeadLine1 < LeadLine2 → This implies a bearish cloud.
Close < LeadLine1 and Close < LeadLine2 → The price has fallen below the cloud, signaling trend weakness or reversal.
This confirms a bearish trend, prompting the strategy to exit the long position.
✅ Must-Have Elements in This Strategy
Entry Logic – based on price position relative to the cloud and cloud direction.
Exit Logic – closes the position when price shifts to a bearish trend.
Overlay Enabled – plotted over price for visual confirmation of signals.
Dynamic Parameters – inputs for conversion/base/cloud lengths and displacement.
Visualization – plots all Ichimoku components including cloud fill for clarity.
No Shorting Logic Yet – this version only handles long trades; shorting can be added optionally.
No Stop-Loss or Take-Profit – trades are closed purely based on Ichimoku trend reversal.

EMA Trend Trading Strategy - FullTrend Identification:
Uptrend when price > EMA150 on H4
Downtrend when price < EMA150 on H4
Entry Conditions:
For BUY: EMA36 > EMA54/89/150 + price tests an EMA + bullish candlestick pattern
For SELL: EMA36 < EMA54/89/150 + price tests an EMA + bearish candlestick pattern
Exit Conditions:
Close position when price crosses EMA150 on M15
Volume spike detection (colored purple)
Risk Management:
Stop loss at 1.5x ATR
Take profit at 3x ATR (risk-reward 1:2)
Visual Indicators:
EMAs plotted with different colors
Buy/sell signals marked with triangles
Trend direction indicator
Win rate display

QQE MOD + Bollinger Band Strategy (Full Version)Bonus Tip:
• Use it on 1H timeframe for best results.
• Settings: BB Length 20, Multiplier 2.2, RSI 21, 200 EMA filter ON (as you showed earlier — perfect!)

DCA Strategy TesterBacktest DCA method. Choose start and end date, monthly amount and see graph, buys orders and stats.

EMA Trend Trading Strategy - FullTrend Identification:
Uptrend when price > EMA150 on H4
Downtrend when price < EMA150 on H4
Entry Conditions:
For BUY: EMA36 > EMA54/89/150 + price tests an EMA + bullish candlestick pattern
For SELL: EMA36 < EMA54/89/150 + price tests an EMA + bearish candlestick pattern
Exit Conditions:
Close position when price crosses EMA150 on M15
Volume spike detection (colored purple)
Risk Management:
Stop loss at 1.5x ATR
Take profit at 3x ATR (risk-reward 1:2)
Visual Indicators:
EMAs plotted with different colors
Buy/sell signals marked with triangles
Trend direction indicator
Win rate display
