BollingerBands MTF | AlchimistOfCrypto🌌 Bollinger Bands – Unveiling Market Volatility Fields 🌌
"The Bollinger Bands, reimagined through quantum mechanics principles, visualizes the probabilistic distribution of price movements within a multi-dimensional volatility field. This indicator employs principles from wave function mathematics where standard deviation creates probabilistic boundaries, similar to electron cloud models in quantum physics. Our implementation features algorithmically enhanced visualization derived from extensive mathematical modeling, creating a dynamic representation of volatility compression and expansion cycles with adaptive glow effects that highlight the critical moments where volatility phase transitions occur."
📊 Professional Trading Application
The Bollinger Bands Quantum transcends traditional volatility measurement with a sophisticated gradient illumination system that reveals the underlying structure of market volatility fields. Scientifically calibrated for multiple timeframes and featuring eight distinct visual themes, it enables traders to perceive volatility contractions and expansions with unprecedented clarity.
⚙️ Indicator Configuration
- Volatility Field Parameters 📏
Python-optimized settings for specific market conditions:
- Period: 20 (default) - The quantum time window for volatility calculation
- StdDev Multiplier: 2.0 - The probabilistic boundary coefficient
- MA Type: SMA/EMA/VWMA/WMA/RMA - The quantum field smoothing algorithm
- Visual Theming 🎨
Eight scientifically designed visual palettes optimized for volatility pattern recognition:
- Neon (default): High-contrast green/red scheme enhancing volatility transition visibility
- Cyan-Magenta: Vibrant palette for maximum volatility boundary distinction
- Yellow-Purple: Complementary colors for enhanced compression/expansion detection
- Specialized themes (Green-Red, Forest Green, Blue Ocean, Orange-Red, Grayscale): Each calibrated for different market environments
- Opacity Control 🔍
- Variable transparency system (0-100) allowing seamless integration with price action
- Adaptive glow effect that intensifies during volatility phase transitions
- Quantum field visualization that reveals the probabilistic nature of price movements
🚀 How to Use
1. Select Visualization Parameters ⏰: Adjust period and standard deviation to match market conditions
2. Choose MA Type 🎚️: Select the appropriate smoothing algorithm for your trading strategy
3. Select Visual Theme 🌈: Choose a color scheme that enhances your personal pattern recognition
4. Adjust Opacity 🔎: Fine-tune visualization intensity to complement your chart analysis
5. Identify Volatility Phases ✅: Monitor band width to detect compression (pre-breakout) and expansion (trend)
6. Trade with Precision 🛡️: Enter during band contraction for breakouts, or trade mean reversion using band boundaries
7. Manage Risk Dynamically 🔐: Use band width as volatility-based position sizing parameter
Indicators and strategies

Sharpe & Sortino Ratio PROSharpe & Sortino Ratio PRO offers an advanced and more precise way to calculate and visualize the Sharpe and Sortino Ratios for financial assets on TradingView. Its main goal is to provide a scientifically accurate method for assessing the risk-adjusted performance of assets, both in the short and long term. Unlike TradingView’s built-in metrics, this script correctly handles periodic returns, uses optional logarithmic returns, properly annualizes both returns and volatility, and adjusts for the risk-free rate — all critical factors for truly meaningful Sharpe and Sortino calculations.
Users can customize the rolling analysis window (e.g., 252 periods for one year on daily data) and the long-term smoothing period (e.g., 1260 periods for five years). There’s also an option to select between linear and logarithmic returns and to manually input a risk-free rate if real-time data from FRED (the 3-Month T-Bill Rate via FRED:DGS3MO) is unavailable. Based on the chart’s timeframe (daily, weekly, or monthly), the script automatically adjusts the risk-free rate to a per-period basis.
The Sharpe Ratio is calculated by first determining the asset’s excess returns (returns after subtracting the risk-free return per period), then computing the average and standard deviation of those excess returns over the specified window, and finally annualizing these figures separately — in line with best scientific practices (Sharpe, 1994). The Sortino Ratio follows a similar approach but only considers negative returns, focusing specifically on downside risk (Sortino & Van der Meer, 1991).
To enhance readability, the script visualizes the ratios using a color gradient: strong negative values are shown in red, neutral values in yellow, and strong positive values in green. Additionally, the long-term averages for both Sharpe and Sortino are plotted with steady colors (teal and orange, respectively), making it easier to spot enduring performance trends.
Why calculating Sharpe and Sortino Ratios manually on TradingView is necessary?
While TradingView provides basic Sharpe and Sortino Ratios, they come with significant methodological flaws that can lead to misleading conclusions about an asset’s true risk-adjusted performance.
First, TradingView often computes volatility based on the standard deviation of price levels rather than returns (TradingView, 2023). This method is problematic because it causes the volatility measure to be directly dependent on the asset’s absolute price. For instance, a stock priced at $1,000 will naturally show larger absolute daily price moves than a $10 stock, even if their percentage changes are similar. This artificially inflates the measured standard deviation and, as a result, depresses the calculated Sharpe Ratio.
Second, TradingView frequently neglects to adjust for the risk-free rate. By treating all returns as risky returns, the computed Sharpe Ratio may significantly underestimate risk-adjusted performance, especially when interest rates are high (Sharpe, 1994).
Third, and perhaps most critically, TradingView doesn’t properly annualize the mean excess return and the standard deviation separately. In correct financial math, the mean excess return should be multiplied by the number of periods per year, while the standard deviation should be multiplied by the square root of the number of periods per year (Cont, 2001; Fabozzi et al., 2007). Incorrect annualization skews the Sharpe and Sortino Ratios and can lead to under- or overestimating investment risk.
These flaws lead to three major issues:
• Overstated volatility for high-priced assets.
• Incorrect scaling between returns and risk.
• Sharpe Ratios that are systematically biased downward, especially in high-price or high-interest environments.
How to properly calculate Sharpe and Sortino Ratios in Pine Script?
To get accurate results, the Sharpe and Sortino Ratios must be calculated using the correct methodology:
1. Use returns, not price levels, to calculate volatility. Ideally, use logarithmic returns for better mathematical properties like time additivity (Cont, 2001).
2. Adjust returns by subtracting the risk-free rate on a per-period basis to obtain true excess returns.
3. Annualize separately:
• Multiply the mean excess return by the number of periods per year (e.g., 252 for daily data).
• Multiply the standard deviation by the square root of the number of periods per year.
4. Finally, divide the annualized mean excess return by the annualized standard deviation to calculate the Sharpe Ratio.
The Sortino Ratio follows the same structure but uses downside deviations instead of standard deviations.
By following this scientifically sound method, you ensure that your Sharpe and Sortino Ratios truly reflect the asset’s real-world risk and return characteristics.
References
• Cont, R. (2001). Empirical properties of asset returns: stylized facts and statistical issues. Quantitative Finance, 1(2), pp. 223–236.
• Fabozzi, F.J., Gupta, F. and Markowitz, H.M. (2007). The Legacy of Modern Portfolio Theory. Journal of Investing, 16(3), pp. 7–22.
• Sharpe, W.F. (1994). The Sharpe Ratio. Journal of Portfolio Management, 21(1), pp. 49–58.
• Sortino, F.A. and Van der Meer, R. (1991). Downside Risk: Capturing What’s at Stake in Investment Situations. Journal of Portfolio Management, 17(4), pp. 27–31.
• TradingView (2023). Help Center - Understanding Sharpe and Sortino Ratios. Available at: www.tradingview.com (Accessed: 25 April 2025).


Pi Cycle | AlchimistOfCrypto Pi Cycle Top Indicator - A Powerful Market Phase Detector
Developed by AlchimistOfCrypto
🧪 The Pi Cycle uses mathematical harmony to identify Bitcoin market cycle tops
with remarkable precision. Just as elements react at specific temperatures,
Bitcoin price behaves predictably when these two moving averages converge! 🧬
⚗️ The formula measures when the 111-day SMA crosses below the 350-day SMA × 2,
creating a perfect alchemical reaction that has successfully identified the
major cycle tops in 2013, 2017, and 2021.
🔬 Like the Golden Ratio in nature, this indicator reveals the hidden
mathematical structure within Bitcoin's chaotic price movements.
🧮 When the reaction occurs, prepare for molecular breakdown! 🔥


Day Trading NR4/NR7 + 2BarNR/3BarNR + ID + MomentumDay Trading Version: The High-Precision Momentum Setup
The Day Trading Version of this strategy is designed for traders who need quick, high-probability setups that work in real-time throughout the trading day. It’s a dynamic approach that blends classic price compression patterns with crucial intraday filters like VWAP and MACD, ensuring you’re only executing trades when everything lines up for success.
Price Compression: Focuses on NR4, NR7, and Inside Day patterns, offering clear signals when stocks are in tight ranges—ideal for a breakout or breakdown. These setups identify periods of compression that often precede explosive moves.
Trend Alignment: Price must be above the 20 EMA, with the 10 EMA above the 20 EMA, confirming a trend that's worthy of entering. These filters keep you on the right side of the market, ensuring you’re trading in the direction of momentum.
VWAP Filter: The price must be above VWAP for long trades, keeping you in sync with intraday institutional flow. This ensures you're aligning with the market’s overall bias.
MACD Confirmation: The fast MACD line needs to be at least 5% above or below the slow line, ensuring that the trade has sufficient momentum. For long trades, the MACD must be positive, confirming upward strength.
This strategy is built for momentum-focused traders who thrive on fast action and want to capture intraday volatility. Perfect for day traders who need to identify reliable setups on the fly, with clear rules and filters that make entering and exiting positions easier than ever.

Relative Volume CandlesVisualizes candlesticks with transparency based on volume relative to a moving average. Higher-than-average volume makes candles more opaque, while lower volume increases transparency—helping you spot significant price movements at a glance!
Features:
Customizable up/down candle colors (default: green/red)
Adjustable lookback period for volume averaging (default: 21)
Fine-tune transparency with base transparency (default: 80) and scale (default: 2.0)
Overlay directly on your chart for seamless analysis

Swing Trading NR4/NR7 + 2BarNR/3BarNR + Inside Day + TrendSwing Trading Version: The Ultimate Momentum Setup
The Swing Trading Version of this strategy is tailored for traders looking to capture multi-day price movements in high-momentum stocks. It’s a carefully crafted approach combining classic patterns like NR4, NR7, and Inside Day with powerful trend filters to find the best opportunities for significant gains.
Price Compression: Identifies stocks in periods of consolidation using the NR4 and NR7 patterns, along with 2-Bar and 3-Bar Narrow Ranges—key indicators of potential volatility and breakout.
Trend Confirmation: The strategy ensures trades align with the broader trend by confirming that price is above the 20 EMA and that the 10 EMA is above the 20 EMA. This guarantees that you’re trading in the direction of strength.
Inside Day Filter: The Inside Day pattern is only triggered when the candlestick is within 1 ATR from the 10 EMA (or 20 EMA if below), ensuring you're not chasing a trade too far from a support level.
Clean, Powerful Signals: With a clear focus on momentum and price compression, you'll only get actionable signals backed by multiple layers of confirmation, including volatility and price structure.
This setup is perfect for traders seeking to ride out trends and capture sizeable moves, with an emphasis on simplicity and precision. Ideal for those who prefer to hold trades for multiple days while still maintaining control over their entries and exits.

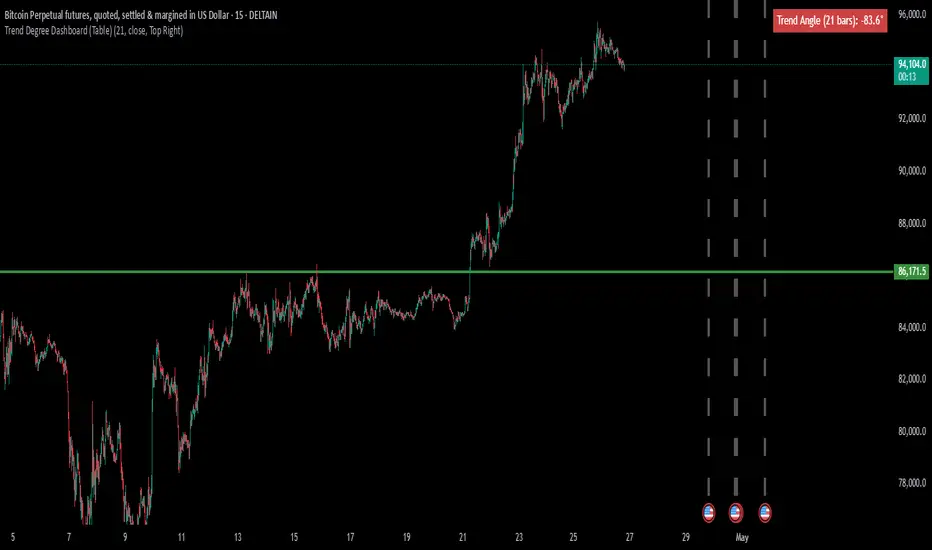
Trend Degree Dashboard (Table)📈 Trend Degree Dashboard (Table) — v1.0
This indicator calculates and displays the trend angle (in degrees) based on the linear regression of the selected source (default: close) over a user-defined lookback period (default: 21 bars).
The trend angle gives a quick visual reference of the current market slope — positive (uptrend) or negative (downtrend).
A dashboard table shows the trend angle directly on the chart, with a background color:
🟩 Green background for positive angles (uptrend)
🟥 Red background for negative angles (downtrend)
🔧 Features:
Customizable Lookback Period: Set the number of candles to consider for trend calculation.
Source Selection: Apply the analysis to close, open, high, low, or any other price series.
Dashboard Positioning: Choose where the dashboard appears (Top Left, Top Right, Bottom Left, Bottom Right).
Clean Table Design: Minimalistic and easy-to-read dashboard with automatic background color highlighting based on trend direction.
⚙️ How It Works:
It uses Linear Regression to measure the slope between two consecutive points.
Converts the slope into degrees using the arctangent function (atan) for a geometric interpretation of trend strength and direction.
Updates the dashboard table live with the latest angle value.
✅ Script Highlights:
Non-repainting: Once a bar closes, its value is fixed.
Efficient performance: Lightweight table visualization with no heavy calculations.
Clear trading signals: Positive angles suggest bullish momentum, negative angles suggest bearish momentum.
⚠️ Disclaimer:
This script is a technical analysis tool designed to assist in decision-making but does not guarantee results.
Please use it alongside other tools and practice proper risk management. Always test any indicator on demo accounts before applying it to live trading.
EMA golden cross strategy by Anuj Guptait just shows the golden crossovers. golden cross overs/unders are highly probable price points

Swing Trading NR4/NR7 + 2BarNR/3BarNR + Trend📜 Description:
NR4, NR7, 2-Bar NR, and 3-Bar NR Compression Scanner (Swing Trading Version)
This script spots serious price compressions (NR4, NR7, 2-Bar NR, 3-Bar NR) on the daily chart, with simple but ruthless trend confirmation.
It's leaner. It's cleaner. It's built for those who don’t like getting caught with their pants down in messy sideways markets.
The scanner conditions are:
NR4 and NR7 patterns: Today's daily range must be the narrowest compared to the last 4 or 7 days.
2-Bar and 3-Bar Narrow Ranges: The narrowest two-day or three-day ranges relative to the previous 20 sets.
Trend filter:
Closing price must be above the 20 EMA.
The 10 EMA must be above the 20 EMA.
Visuals:
Background highlights whenever a compression setup forms.
Shape markers above or below the bars to mark the opportunity.
📈 Why Use This?
Some have said swing trading is like sipping fine wine — slow, measured, deliberate.
I won’t say they’re wrong.
But there’s also the part where you grab the bottle, smash it over the head of bad setups, and only drink the good stuff.
This scanner lets you find daily compressions inside healthy trends.
The kind of coils that can explode in your favour — and not the fake-outs that empty your account while you cry into your keyboard.
🛠️ Built for Traders Who:
Trade on daily candles, not minute charts.
Want high-quality entries without second-guessing.
Understand that real breakouts come from contraction, not chaos.
Like their setups clean, focused, and simple enough to stick to under pressure.

NR4/NR7 + 2BarNR/3BarNR + Trend + Refined MACD + VWAP📜 Description:
NR4, NR7, 2-Bar NR, and 3-Bar NR Compression Scanner with Trend & Momentum Filters
This script identifies extreme price compressions (NR4, NR7, 2-Bar NR, 3-Bar NR) combined with strict trend and momentum conditions for higher-probability setups.
It’s not just about spotting contraction — it’s about ensuring the right environment for expansion.
The scanner conditions are:
NR4 and NR7 patterns: Today's range must be the narrowest compared to the last 4 or 7 days.
2-Bar and 3-Bar Narrow Ranges: The narrowest two or three day ranges compared to the last 20 sets of two/three days.
Trend filter:
Price must be above the 20 EMA.
The 10 EMA must be above the 20 EMA.
MACD proximity filter:
The MACD fast line must either be above the slow line or within 5% range below the slow line.
VWAP filter:
Price must be trading above VWAP.
Visuals:
Background colours highlight detected compression patterns aligned with trend.
Shape markers above or below bars for quick visual confirmation.
📈 Why Use This?
Some have said that trading is a waiting game. I won't say they're wrong.
This scanner doesn't just throw every tight-range day at you. It finds the coils in context — trending, gaining momentum, ready to spring.
If you chase trades like a fool in a brothel, you'll get taken for a ride.
If you wait for the right compression, at the right moment, with the right backing...
Well, let's just say, you might just start looking like you actually know what you're doing.
🛠️ Built for Traders Who:
Prefer strong trends over messy ranges.
Want systematic setups, not random guessing.
Like stacking probabilities rather than praying to the trading gods.
Enjoy catching breakouts when everyone else is still scratching their heads.


Weekday Colors with Time Highlighting by NabojeetThis script is a Pine Script (version 6) indicator called "Weekday Colors with Time Highlighting" designed for TradingView charts. It has several key functions:
1. **Weekday Color Coding**:
- Assigns different background colors to each trading day (Monday through Friday)
- Allows users to customize the color for each day
- Includes toggles to enable/disable colors for specific days
2. **Time Range Highlighting**:
- Highlights a specific time period (e.g., 18:15-18:30) on every trading day
- Uses a custom color that can be adjusted by the user
- The time range is specified in HHMM-HHMM format
3. **High/Low Line Drawing**:
- Automatically identifies the highest high and lowest low points within the specified time range
- Draws horizontal lines at these levels when the time period ends
- Lines extend forward in time to serve as support/resistance references
- Users can customize the line color, width, and style (solid, dotted, or dashed)
The script is organized into logical sections with input parameters grouped by function (Weekday Colors, Weekday Display, Time Highlighting, and Horizontal Lines). Each section's inputs are customizable through the indicator settings panel.
This indicator would be particularly useful for traders who:
- Want visual distinction between different trading days
- Focus on specific time periods each day (like market opens, closes, or specific sessions)
- Use intraday support/resistance levels from key time periods
- Want to quickly identify session highs and lows
The implementation resets tracking variables at the beginning of each new time range and draws the lines once the time period ends, ensuring accurate high/low marking for each day's specified time window.
Author - Nabojeet

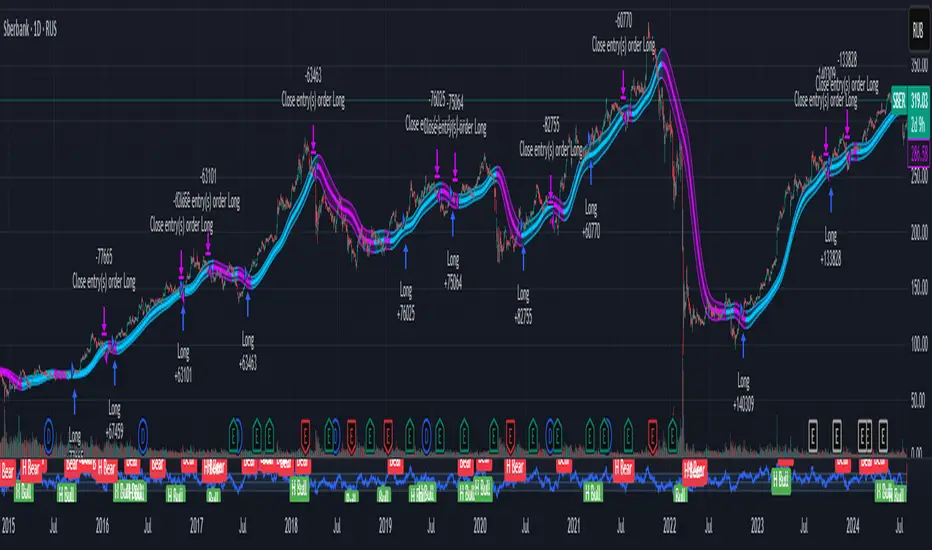
Gaussian Channel StrategyGaussian Channel Strategy — User Guide
1. Concept
This strategy builds trades around the Gaussian Channel. Based on Pine Script v4 indicator originally published by Donovan Wall. With rework to v6 Pine Script and adding entry and exit functions.
The channel consists of three dynamic lines:
Line Formula Purpose
Filter (middle) N-pole Gaussian filter applied to price Market "equilibrium"
High Band Filter + (Filtered TR × mult) Dynamic upper envelope
Low Band Filter − (Filtered TR × mult) Dynamic lower envelope
A position is opened when price crosses a user-selected line in a user-selected direction.
When the smoothed True Range (Filtered TR) becomes negative, the raw bands can flip (High drops below Low).
The strategy automatically reorders them so the upper band is always above the lower band.
Visual colors still flip, but signals stay correct.
2. Entry Logic
Choose a signal line for longs and/or shorts: Filter, Upper band, or Lower band.
Choose a cross direction (Cross Up or Cross Down).
A signal remains valid for Lookback bars after the actual cross, as long as price is still on the required side of the line.
When the opposite signal appears, the current position is closed or reversed depending on Reverse on opposite.
3. Parameters
Group Setting Meaning
Source & Filter Source Price series used (close, hlc3, etc.)
Poles (N) Number of Gaussian filter poles (1-9). More poles ⇒ smoother but laggier
Sampling Period Main period length of the channel
Filtered TR Multiplier Width of the bands in fractions of smoothed True Range
Reduced Lag Mode Adds a lag-compensation term (faster but noisier)
Fast Response Mode Blends 1-pole & N-pole outputs for quicker turns
Signals Long → signal line / Short → signal line Which line generates signals
Long when price / Short when price Direction of the cross
Lookback bars for late entry Bars after the cross that still allow an entry
Trading Enable LONG/SHORT-side trades Turn each side on/off
On opposite signal: reverse True: reverse -- False: flat
Misc Start trading date Ignores signals before this timestamp (back-test focus)
4. Quick Start
Add the strategy to a chart. Default: hlc3, N = 4, Period = 144.
Select your signal lines & directions.
Example: trend trading – Long: Filter + Cross Up, Short: Filter + Cross Down.
Disable either side if you want long-only or short-only.
Tune Lookback (e.g. 3) to catch gaps and strong impulses.
Run Strategy Tester, optimise period / multiplier / stops (add strategy.exit blocks if needed).
When satisfied, connect alerts via TradingView webhooks or use the builtin broker panel.
5. Notes
Commission & slippage are not preset – adjust them in Properties → Commission & Slippage.
Works on any market and timeframe, but you should retune Sampling Period and Multiplier for each symbol.
No stop-loss / take-profit is included by default – feel free to add with strategy.exit.
Start trading date lets you back-test only recent history (e.g. last two years).
6. Disclaimer
This script is for educational purposes only and does not constitute investment advice.
Use entirely at your own risk. Back-test thoroughly and apply sound risk management before trading real capital.
Real Relative Strength vs SPY (Clean Visual)This indicator plots Real Relative Strength/Weakness (RS/RW) of any stock relative to SPY, normalised by ATR. Designed to aid trading aligned to RDT philosophy.
Designed for intraday and swing traders to quickly identify stocks showing true institutional strength or weakness compared to the market.
Uses a clean, color-coded center-line display for fast reading of live RS/RW performance.
It automatically syncs to whatever timeframe you’re trading (5min, 15min, 1hr)
Default comparison ticker is SPY (you can easily swap if needed later)
Length = 12 by default → (rolling 1-hour window on M5 chart)
Clean green/red visual breakout = immediately obvious relative strength or weakness!
How to use
Strong Green move above zero ➔ RS developing ➔ Long bias
Strong Red move below zero ➔ RW developing ➔ Short bias
Choppy around zero ➔ No clear edge ➔ maybe avoid that stock

Quarterly Fundamentals Table by GauravThis Pine Script v3 overlay paints a compact, six‐column table in the top‐right of your chart that begins with your stock’s market capitalization and sector/industry, then lays out quarterly fundamentals—Sales, Sales QoQ%, PAT, PAT QoQ% and OPM%—across the most recent four fiscal quarters (dynamically labeled by month and year). It pulls data via request.financial(), formats large numbers into lakhs/crores, calculates quarter‐over‐quarter growth, and sizes text for clarity, giving swing traders an at‐a‐glance view of key fundamental trends alongside price action.

Session Times + Strenght M7This Script Aims to Define Session Times, and Rank those. It can help to adjust your Strategy to Higher Volatility, if you choose to use the Session Volatility and Strenght Index from 1-10. Your timezone on Trading View should be NY. You can customize the Following in Settings: Weight of Volatility & Narrative Regarding the ranking + Transparency of the Lines. SP:SPX FX:EURUSD OANDA:EURUSD CAPITALCOM:USDJPY AMEX:SPY NASDAQ:QQQ TVC:DXY CAPITALCOM:USDJPY CME_MINI:NQ1! OANDA:XAUUSD FX:GBPUSD

DSEMA 三价趋势(中轨虚线)SMA trend indicator, using two colors to distinguish between long and short trends, indicators, simple, new as the market and average indicator enthusiasts can focus on reference;
Indicators using DSEMA averages, take the value of “high, close, low” three prices to form a trading indicator; anti-single appear false signals, wrong decision-making

Crypto EMA TableCrypto EMA Trend Scanner
A powerful tool for crypto traders to quickly identify trend strength across multiple timeframes
This indicator helps you spot potential trading opportunities by analyzing the EMA (Exponential Moving Average) alignment across four different timeframes. It displays a clean, color-coded table showing which cryptocurrencies are in a strong uptrend.
Key Features:
Multi-Timeframe Analysis: Simultaneously scan 3-minute, 15-minute, 1-hour, and 4-hour charts
Clear Visual Signals: Green cells indicate bullish EMA alignment (EMA 20 > EMA 50 > EMA 200)
Customizable Symbols: Track up to 3 different cryptocurrencies of your choice
Exchange Selection: Compatible with major exchanges (Bybit, Binance, Coinbase, Kraken, KuCoin, FTX)
Flexible Positioning: Place the table anywhere on your chart
How to Use:
Add the indicator to your chart
Select your preferred cryptocurrencies in the settings
Position the table where you want it
Look for green cells indicating EMA lineup.
Use this information to identify potential entry points or confirm your trading bias

Scalping Supertrend + Stochastic RSIThe Scalping Supertrend + Stochastic RSI Indicator is designed for short-term trading and scalping on lower timeframes. It combines the Supertrend indicator to identify trend direction with the Stochastic RSI to pinpoint overbought/oversold conditions for precise entry and exit signals. The indicator generates buy and sell signals when the Stochastic RSI crosses predefined levels (oversold/overbought) while aligned with the Supertrend’s trend direction.

Heila's Advanced Buy/Sell Signal (Upgraded) - 100MA TouchI made it for myself, and it wouldn't be easy to lose if you just follow the signals.. but it's rather hard to see them.

Tradicators Pulse™ [v1]Tradicators Pulse™ Strategy: “AI Pulse Reversal”
Goal:
Catch reversals and trends using a smooth MA with adaptive bands and a confidence oscillator.
Step-by-Step: How to Use
① Set the Context
Timeframes: 5min, 15min, 1H (start with 15min)
Watch:
MA line color (blue = bullish, fuchsia = bearish)
Pulse Bands (upper = overbought, lower = oversold)
Yellow Oscillator for trend strength
Step-by-Step: Mean Reversion (Bounce Trade)
Wait for price to breach a band
Candle closes outside upper band (overbought) or lower band (oversold)
Check Pulse Oscillator
It must curve up (long) or down (short)
Entry Trigger
Enter on next candle that closes back inside the bands
Stop Loss
Few pips outside band edge
Take Profit
TP1 = MA line (gray-blue/fuchsia)
TP2 = Opposite band
Step-by-Step: Trend Entry (Momentum Follow)
Wait for MA color flip
Blue = Uptrend → only long setups
Fuchsia = Downtrend → only short setups
Entry Trigger
Price pulls back near MA
Oscillator still supports trend direction
Enter on bounce off MA
Stop Loss
Few pips below/above MA or last swing low/high
Take Profit
TP1 = Band in direction of trend
TP2 = Use trailing SL or R:R 1:2
Avoid Trading When:
MA is flat (no trend)
Bands are too tight or choppy
Oscillator gives conflicting signal
