Open Range Breakout (ORB) with Alerts
📘 Open Range Breakout (ORB) Indicator – by thechartsalgo™
🧠 What It Does:
This indicator helps traders identify breakout opportunities from t he initial price range of the trading day — typically the first 15 or 30 minutes after the market opens.
It tracks the high and low of a user-defined time window (e.g. 9:30–9:45) and plots these levels on the chart. Once the session range is set, it detects breakouts when price moves above the range high (bullish breakout) or below the range low (bearish breakout).
⚙️ Key Features:
✅ Custom Time Window
Define your own start and end time for the range (e.g., 09:30–09:45).
✅ Breakout Signals
Arrows show up when price breaks above or below the range after it has formed.
✅ Color Customization
Choose your own colors for range lines and background zone.
✅ Background Highlight
Optional shaded fill between high/low makes the range visually clear.
✅ Only Show Today's Range
Option to hide previous day levels to keep your chart clean.
✅ Alerts
Built-in alerts notify you when a breakout occurs — long or short.
📈 How to Use It:
Set the start and end time to match your market’s open range (commonly first 15, 30, or 60 minutes).
Wait for the range to lock in (highlighted area on chart).
Trade the breakout direction once price moves above or below the range.
Optionally, use it in combination with volume or price action confirmation.
🔔 Alerts (Optional Setup):
ORB Breakout Up → triggers when price closes above the high
ORB Breakout Down → triggers when price closes below the low
📌 Who Is It For?
Day traders looking to catch early momentum
Scalpers using session-based price action
Strategy developers who use the opening range as a key concept.
⚠️ Disclaimer:
This indicator is for educational and informational purposes only. It is not financial advice, and no guarantees are made regarding its accuracy or effectiveness.
All trading involves risk. You are solely responsible for your own trading decisions. Always do your own research and consult with a licensed financial advisor before making any investment decisions.
By using this script, you agree that thechartsalgo™, its developers, and affiliates are not liable for any losses or damages resulting from the use of this tool.
Indicators and strategies

TZSesThe script visually highlights major forex trading sessions (London, New York, Tokyo) and a "true day" separator on the chart background to help traders identify the most active market hours and daily boundaries.

WT 4H + 1D Oscillator + Cross Dots + Alert TrianglesThis indicator will help on trigger buy and sell alerts when you get confluence signals in 1D Momentum above or below +-30 (adjustable) and 4H momentum waves crossing (meaning overbought / oversold). Excellent for catching early swing breakout trades.

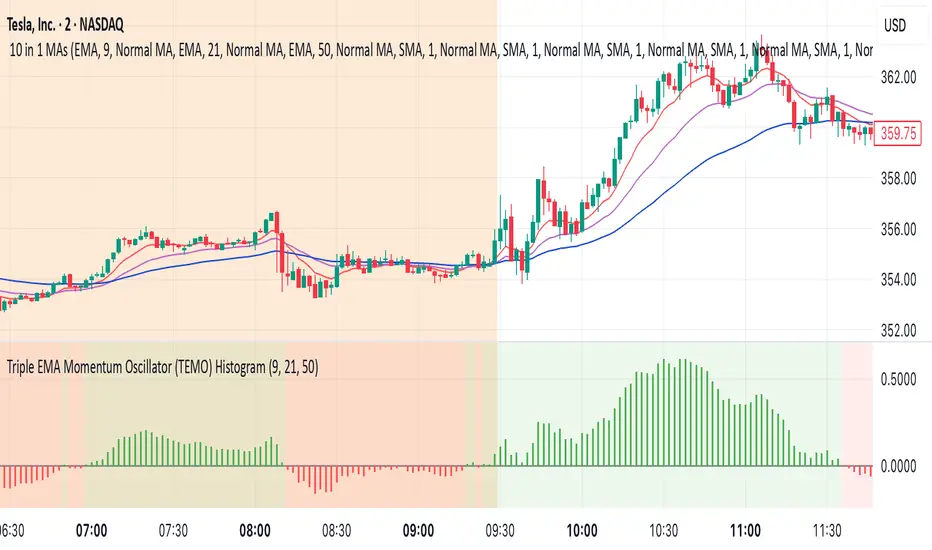
Triple EMA Momentum Oscillator (TEMO) HistogramThis Pine Script code replicates the Python indicator you provided, calculating the Triple EMA Momentum Oscillator (TEMO) and generating signals based on its value and momentum.
Explanation of the Code:
User Inputs:
Allows you to adjust the periods for the short, mid, and long EMAs.
Calculate EMAs:
Computes the Exponential Moving Averages for the specified periods.
Calculate EMA Spreads (Distances):
Finds the differences between the EMAs to understand the spread between them.
Calculate Spread Velocities:
Determines the change in spreads from the previous period, indicating momentum.
Composite Strength Score:
Weighted calculation of the spreads normalized by the EMA values.
Velocity Accelerator:
Weighted calculation of the velocities normalized by the EMA values.
Final TEMO Oscillator:
Combines the spread strength and velocity accelerator to create the TEMO.
Generate Signals:
Signals are generated when TEMO is positive and increasing (buy), or negative and decreasing (sell).
Plotting:
Zero Line: Helps visualize when TEMO crosses from positive to negative.
TEMO Oscillator: Plotted with green for positive values and red for negative values.
Signals: Displayed as a histogram to indicate buy (1) and sell (-1) signals.
Usage:
Buy Signal: When TEMO is above zero and increasing.
Sell Signal: When TEMO is below zero and decreasing.
Note: This oscillator helps identify momentum changes based on EMAs of different periods. It's useful for detecting trends and potential reversal points in the market.

AKC Strategy with MACD + RSI + ATR Filters [FAILED]This strategy is built around a mean-reversion concept using Higher Timeframe (HTF) Keltner Channels overlaid on a 5-minute chart.
Entry Conditions:
• Long when price pierces the lower HTF band
• Short when price pierces the upper HTF band
• Confirmed by:
• MACD histogram direction
• RSI above 50 (for longs) / below 50 (for shorts)
• ATR must be above its 20-bar average (filters low-volatility chop)
Exit Conditions:
• Stop-loss: 1%
• Take-profit: 2% (fixed R:R of 1:2)
Customization:
• Timeframe input for Keltner calculation (default: 4H)
• Adjustable filter thresholds and SL/TP levels
Backtest Result (In-Sample: Feb–Apr 2023):
• Total Trades: 138
• Win Rate: ~27%
• Profit Factor: ~0.85
• Still underperforming overall but built as a modular base for refinement.

Timeframe % TrakcerPulls historical closes from nine higher-timeframe look-backs (1 H, 12 H, 1 D, 7 D, 14 D, 1 M, 3 M, 6 M, 1 Y, 3 Y) with request.security().
2. Calculates the percent change between each look-back close and the current price:
(close − close₍look-back₎) / close₍look-back₎ × 100
3. Renders a two-column table in the chart’s top-right corner.
• Left column = timeframe label
• Right column = % move, rounded to two decimals
4. Heat-codes the cells — green if the asset is up, red if it’s down — so you can spot momentum (or pain) instantly.
5. Stays lightweight by updating only on the last bar; no excess runtimes.

X OROverview
Designed to plot hourly opening ranges (ORs) on an intraday chart. It primarily serves as a trading tool for assessing market direction and potential trading opportunities by analyzing price action relative to key OHLC (Open, High, Low, Close) levels within each hourly range.
The code provided is for each hour sessions from 2:00 AM to 3:00 PM for a complete session-based framework. In addition there is the RTH open range
Purpose
The core purpose of this indicator is to:
✅ Define each hourly range (based on the session’s opening bar) by recording the high and low of that range.
✅ Extend this range into the following bars for visual reference — serving as dynamic support and resistance zones.
✅ Monitor price action relative to each hourly OR, helping traders evaluate market direction and structure trades using concepts like:
Breakouts above/below the OR high/low.
Rejections or consolidations within the OR.
Continuation or reversal signals tied to each OR.
Key Features
The script marks the first bar of the session as the OR session start.
During this bar, it initializes:
Opening price
Session high
Session low
These levels form the initial range.
🔹 Dynamic Range Tracking
Throughout the one-minute OR session:
The highest and lowest prices are updated in real time, capturing intra-hour volatility.
A visual background box is drawn to highlight the OR range on the chart.
🔹 Range Extension
The script defines an extended session period after the initial OR (e.g., 2:00 AM-2:45 AM for the 2:00 AM session).
During this extension period:
The box persists on the chart, providing a contextual zone that traders can use as a dynamic support/resistance area.
🔹 Visual Representation
Transparent colored boxes highlight each session’s OR visually on the chart.
These boxes help traders easily identify whether price is trading:
Inside the OR
Breaking above the high (potential bullish continuation)
Breaking below the low (potential bearish continuation)
Application in Trading
🔍 Trading the Opening Range Breakout
Traders often use the OR high and low as breakout triggers. For example:
A price break above the OR high may signal bullish momentum.
A break below the OR low may signal bearish momentum.
⚖️ Support and Resistance
Even if breakouts fail, the OR can act as a pivot zone — offering areas for:
Stop placements
Target levels
Entry confirmations for fade trades or mean reversion strategies.
🕒 Session Awareness
By defining each hour’s OR individually (from 2:00 AM to 3:00 PM), traders can:
Analyze price behavior within each session.
Recognize when liquidity or volatility increases (e.g. around overlapping sessions like London open or New York open).
Summary
This Pine Script indicator provides a powerful framework for visualizing and trading hourly opening ranges. It enhances intraday analysis by:
Structuring price action within hourly boxes.
Highlighting key price levels relative to OHLC concepts.
Helping traders make more informed decisions by assessing price behavior around these critical ranges.

Not-So-Average True Range (nsATR)Not-So-Average True Range (nsATR)
*By Sherlock_MacGyver*
---
Long Story Short
The nsATR is a complete overhaul of traditional ATR analysis. It was designed to solve the fundamental issues with standard ATR, such as lag, lack of contextual awareness, and equal treatment of all volatility events.
Key innovations include:
* A smarter ATR that reacts dynamically when price movement exceeds normal expectations.
* Envelope zones that distinguish between moderate and extreme volatility conditions.
* A long-term ATR baseline that adds historical context to current readings.
* A compression detection system that flags when the market is coiled and ready to break out.
This indicator is designed for traders who want to see volatility the way it actually behaves — contextually, asymmetrically, and with predictive power.
---
What Is This Thing?
Standard ATR (Average True Range) has limitations:
* It smooths too slowly (using Wilder's RMA), which delays detection of meaningful moves.
* It lacks context — no way to know if current volatility is high or low relative to history.
* It treats all volatility equally, regardless of scale or significance.
nsATR** was built from scratch to overcome these weaknesses by applying:
* Amplification of large True Range spikes.
* Visual envelope zones for detecting volatility regimes.
* A long-term context line to anchor current readings.
* Multi-factor compression analysis to anticipate breakouts.
---
Core Features
1. Breach Detection with Amplification
When True Range exceeds a user-defined threshold (e.g., ATR × 1.2), it is amplified using a power function to reflect nonlinear volatility. This amplified value is then smoothed and cascades into future ATR values, affecting the indicator beyond a single bar.
2. Direction Tagging
Volatility spikes are tagged as upward or downward based on basic price momentum (close vs previous close). This provides visual context for how volatility is behaving in real-time.
3. Envelope Zones
Two adaptive envelopes highlight the current volatility regime:
* Stage 1: Moderate volatility (default: ATR × 1.5)
* Stage 2: Extreme volatility (default: ATR × 2.0)
Breaching these zones signals meaningful expansion in volatility.
4. Long-Term Context Baseline
A 200-period simple moving average of the classic ATR establishes whether current readings are above or below long-term volatility expectations.
5. Multi-Signal Compression Detection
Flags potential breakout conditions when:
* ATR is below its long-term baseline
* Price Bollinger Bands are compressed
* RSI Bollinger Bands are also compressed
All three signals must align to plot a "Volatility Confluence Dot" — an early warning of potential expansion.
---
Chart Outputs
In the Indicator Pane:
* Breach Amplified ATR (Orange line)
* Classic ATR baseline (White line)
* Long-Term context baseline (Cyan line)
* Stage 1 and Stage 2 Envelopes (Purple and Yellow lines)
On the Price Chart:
* Triangles for breach direction (green/red)
* Diamonds for compression zones
* Optional background coloring for visual clarity
---
Alerts
Built-in alert conditions:
1. ATR breach detected
2. Stage 1 envelope breached
3. Stage 2 envelope breached
4. Compression zone detected
---
Customization
All components are modular. Traders can adjust:
* Display toggles for each visual layer
* Colors and line widths
* Breach threshold and amplification power
* Envelope sensitivity
* Compression sensitivity and lookback windows
Some options are disabled by default to reduce clutter but can be turned on for more aggressive signal detection.
---
Real-Time Behavior (Non-Repainting Clarification)
The indicator updates in real time on the current bar as new data comes in. This is expected behavior for live trading tools. Once a bar closes, values do not change. In other words, the indicator *does not repaint history* — but the current bar can update dynamically until it closes.
---
Use Cases
* Day traders: Use compression zones to anticipate volatility surges.
* Swing traders: Use envelope breaches for regime awareness.
* System developers: Replace standard ATR in your logic for better responsiveness.
* Risk managers: Use directional volatility signals to better model exposure.
---
About the Developer
Sherlock_MacGyver develops original trading systems that question default assumptions and solve real trader problems.

Daily S&P BreadthS&P breadth
measures stock percentages against their moving averages
5, 20, 50, 200

Grid TLong V1The “Grid TLong V1” strategy is based on the classic Grid strategy, but in the mode of buying and selling in favor of the trend and only on Long. This allows to take advantage of large uptrend movements to maximize profits in bull markets. For this reason, excessively sideways or bearish markets may not be very conducive to this strategy.
Like our Grid strategies in favor of the trend, you can enter and exit with the balance with controlled risk, as the distance between each grid functions as a natural and adaptable stop loss and take profit. What differentiates it from bidirectional strategies is that Short uses a minimum amount of follow-through, so that the percentage distance between the grids is maintained.
In this version of the script the entries and exits can be chosen at market or limit , and are based on the profit or loss of the current position, not on the percentage change in price.
The user may also notice that the strategy setup is risk-controlled, because it risks 5% on each trade, has a fairly standard commission and modest initial capital, all in order to protect the strategy user from unrealistic results.
As with all strategies, it is strongly recommended to optimize the parameters for the strategy to be effective for each asset and for each time frame.

Clean XRP/USDT Alert & MarkerClean XRP/USDT Alert & Marker is a precision trading tool designed for futures traders. It highlights high-probability entry zones using visual markers and real-time alerts for both short and long breakouts.
🔍 Features:
Visual markers for short entry and long breakout
Real-time alerts at key levels (configurable)
Ideal for 1H and 4H strategies
Clean layout optimized for fast decision-making
Built for leverage-based futures trading
Use this script to improve timing, reduce noise, and trade XRP/USDT with clearer setups and better risk management.

♒Hurst Cycle Channel Oscillator v4.0 by IRUNTV
Hurst Cycle Channel Oscillator v4.0 by IRUNTV W/ Advanced Divergence
Short Title: HCCO_v4_IRUNTV
📜 Script Description
//Disclaimer//
* What could be considered a clone of Hurst Cycle Channel Oscillator v1.0 by Cryptorhythms with arguably some improvements, since the original was locked i opted to creating my own version with much more flexibility in mind. I also used the original Hurst Cycle Channels by Lazybear as foundation for some of my primary logic and intentionally made it visually identical to the already popular Cryptorhythms version.
// End Disclaimer //
Unlock deeper market insights with the Hurst Cycle Channel Oscillator v4.0 by IRUNTV , a sophisticated oscillator meticulously designed to visualize cyclical price movements and pinpoint potential turning points through an advanced divergence detection engine. This indicator is rooted in the foundational principles of J.M. Hurst's cycle theory, offering a nuanced view of market dynamics by illustrating how current price interacts with dynamic, Hurst-style cycle channels.
At its core, the Hurst Cycle Channel Oscillator v4.0 transforms complex cycle analysis into an intuitive oscillator format. It aims to go beyond simple overbought or oversold conditions, highlighting the inherent rhythm of the market. This can empower you to anticipate shifts in momentum and identify higher-probability trading setups with greater confidence.
This v4.0 features a significantly enhanced divergence engine capable of identifying both Regular and Hidden bullish/bearish divergences with improved accuracy and extensive user customization.
📊 What It Displays & How It Works
Main Oscillator (-F - White Line): This is your primary plot. It represents the normalized position of the selected Source price (default: close) within a dynamically calculated medium-term Hurst-style channel.
Values typically range from 0 (price at channel bottom) to 1 (price at channel top).
Values above 1.0 suggest price has broken robustly above the medium-term channel (potentially overbought or indicating strong bullish momentum).
Values below 0.0 suggest price has broken robustly below the medium-term channel (potentially oversold or indicating strong bearish momentum).
Signal Line (H F - Yellow Line): This line represents the normalized position of the short-term cycle's median within the same medium-term Hurst-style channel. It acts as a dynamic signal line, providing context to the Main Oscillator's movements.
Secondary Oscillator (L F - Aqua Line): Offers a longer-term or smoothed perspective, by default an EMA of the H F Signal Line. Its calculation method and length are configurable.
Dynamic Channels (Internal Calculation): The oscillator values are derived from channels constructed using Running Moving Averages (RMA) of price and Average True Range (ATR) for dynamic width. These calculations incorporate Hurst's concepts of half-span cycle lengths and forward displacement, aiming for a more adaptive and responsive market analysis.
Key Visual Cues:
Divergence Markers (R / H): Clearly marked on the oscillator.
R ( Regular Divergence ): Signals potential trend exhaustion and upcoming reversals.
Bullish (Green R): Price forms Lower Lows (LL) while the Main Oscillator (-F) forms Higher Lows (HL).
Bearish (Red R): Price forms Higher Highs (HH) while the Main Oscillator (-F) forms Lower Highs (LH).
H ( Hidden Divergence ): Signals potential trend continuations, often appearing during corrections.
Bullish (Green H): Price forms Higher Lows (HL) while the Main Oscillator (-F) forms Lower Lows (LL).
Bearish (Red H): Price forms Lower Highs (LH) while the Main Oscillator (-F) forms Higher Highs (HH).
Divergence Lines: Lines are automatically drawn on the oscillator connecting the two pivot points that form a confirmed divergence, providing clear visual confirmation of the pattern. A configurable maximum number of lines are displayed to maintain chart clarity.
Background Shading: The oscillator pane's background is dynamically colored to offer an at-a-glance indication of prevailing market sentiment or conditions:
Green Zones: Typically indicate bullish conditions or oscillator strength (e.g., above the mid-level or signal line).
Red Zones: Typically indicate bearish conditions or oscillator weakness.
(The script includes logic for granular shading based on user-configurable overbought/oversold warning levels and the 0.5 mid-level).
Reference Levels: Horizontal lines are plotted at 0.0, 0.5, and 1.0, along with user-configurable "Warning Levels" (defaulting to 0.2 and 0.8) to help define critical zones of interest and potential price reactions.
💡 How to Use It - Potential Strategies
The Hurst Cycle Channel Oscillator v4.0 is a versatile tool. Here are some ways it can be incorporated into your trading analysis:
Divergence Trading (Primary Use):
Regular Divergences (R): Identify these as leading indicators that an existing trend might be losing momentum and could be approaching a reversal. Always seek confirmation from other technical analysis tools or price action.
Hidden Divergences (H): These often occur during pullbacks or consolidations within an established trend, potentially signaling an opportune moment to enter in the direction of the primary trend.
Oscillator / Signal Line Crosses:
When the Main Oscillator (-F) crosses above the Signal Line (H F): Potential bullish signal or strengthening momentum.
When the Main Oscillator (-F) crosses below the Signal Line (H F): Potential bearish signal or weakening momentum.
Overbought / Oversold (OB/OS) Conditions:
Extreme Levels: osc_F > 1.0 (extreme overbought) or osc_F < 0.0 (extreme oversold) can highlight unsustainable price extensions, often preceding periods of consolidation or potential reversals.
Warning Levels: Utilize the configurable levels (e.g., 0.8 and 0.2 by default) as earlier indications of potential overbought or oversold conditions, allowing for proactive adjustments.
Mid-Level (0.5) Dynamics:
osc_F crossing above 0.5 can suggest a shift towards a more bullish market bias.
osc_F crossing below 0.5 can suggest a shift towards a more bearish market bias. The 0.5 level often acts as a dynamic support/resistance within the oscillator's range.
Trend Confirmation & Strength: The color of the background shading can serve as a quick visual guide to the dominant short-term market sentiment as interpreted by the oscillator's position and behavior.
⚙️ Key Features & Customization (by IRUNTV)
Adjustable Cycle Parameters: Fully customize the Short Term Cycle Length, Medium Term Cycle Length, and their respective Multipliers to tailor the indicator's responsiveness to different assets, volatility, and timeframes.
Customizable Source: Select your preferred input source (close, hl2, hlc3, etc.) for the core calculations.
Comprehensive Plot Customization: Toggle the visibility and personalize the colors and line styles for all major plotted elements (oscillators, signal lines, divergence markers) through an intuitive "Plot Visibility & Style" settings group.
Advanced Divergence Engine Settings:
Div Pivot Left/Right Lookback: Fine-tune the sensitivity of pivot point detection for divergences.
Max Bars Between Div Pivots: Define the maximum historical window for identifying valid divergence formations.
Max Stored Pivots for Divs: Optimize performance by managing the memory used for storing historical pivot data, while still enabling detection of relevant long-term divergences.
Max Div Lines to Show: Maintain chart clarity by controlling the number of concurrently displayed divergence lines.
Built-in Alerts: Stay informed with comprehensive, configurable alerts for:
Main Oscillator / Signal Line crosses.
All four identified types of Divergences (Regular Bullish/Bearish, Hidden Bullish/Bearish).
Oscillator crossing into user-defined Overbought/Oversold warning levels.
Oscillator breaching the extreme 0.0 or 1.0 channel boundaries.
⚠️ Disclaimer
The "Hurst Cycle Channel Oscillator v4.0 by IRUNTV" is provided for educational and informational purposes only and does not constitute financial advice or a recommendation to buy or sell any asset. Trading and investing in financial markets involve substantial risk of loss. Past performance is not indicative of future results. All users should conduct their own thorough research, backtesting, and due diligence before making any trading or investment decisions. Use this tool responsibly and as part of a comprehensive trading strategy. IRUNTV assumes no liability for any trading or investment decisions made based on this indicator.

Fibonacci PivotsCreates Golden Zones based off the Pivots Standard with Daily Timeframe
-updated version with selectable TF

Previous Highs & Lows (Customizable)Previous Highs & Lows (Customizable)
This Pine Script indicator displays horizontal lines and labels for high, low, and midpoint levels across multiple timeframes. The indicator plots levels from the following periods:
Today's session high, low, and midpoint
Yesterday's high, low, and midpoint
Current week's high, low, and midpoint
Last week's high, low, and midpoint
Last month's high, low, and midpoint
Last quarter's high, low, and midpoint
Last year's high, low, and midpoint
Features
Individual Controls: Each timeframe has separate toggles for showing/hiding high/low levels and midpoint levels.
Custom Colors: Independent color selection for lines and labels for each timeframe group.
Display Options:
Adjustable line width (1-5 pixels)
Variable label text size (tiny, small, normal, large, huge)
Configurable label offset positioning
Organization: Settings are grouped by timeframe in a logical sequence from most recent (today) to least recent (last year).
Display Logic: Lines span the current trading day only. Labels are positioned to the right of the price action. The indicator automatically removes previous drawings to prevent chart clutter.


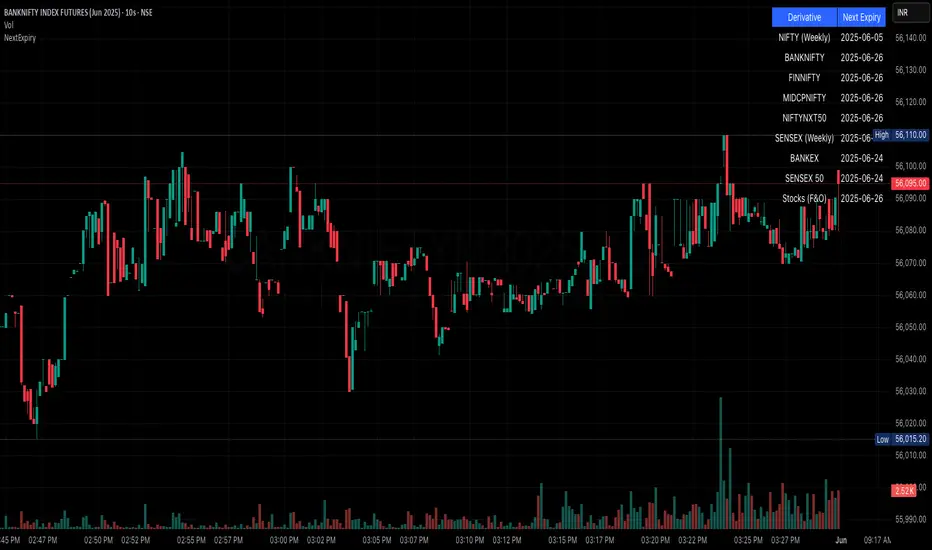
NSE/BSE Derivative - Next Expiry Date With HolidaysNSE & BSE Expiry Tracker with Holiday Adjustments
This Pine Script is a TradingView indicator that helps traders monitor upcoming expiry dates for major Indian derivative contracts. It dynamically adjusts these expiry dates based on weekends and holidays, and highlights any expiry that falls on the current day.
⸻
Key Features
1. Tracks Expiry Dates for Major Contracts
The script calculates and displays the next expiry dates for the following instruments:
• NIFTY (weekly expiry every Thursday)
• BANKNIFTY, FINNIFTY, MIDCPNIFTY, NIFTYNXT50 (monthly expiry on the last Thursday of the month)
• SENSEX (weekly expiry every Tuesday)
• BANKEX and SENSEX 50 (monthly expiry on the last Tuesday of the month)
• Stocks in the F&O segment (monthly expiry on the last Thursday)
2. Holiday Awareness
Users can input a list of holiday dates in the format YYYY-MM-DD,YYYY-MM-DD,.... If any calculated expiry falls on one of these holidays or a weekend, the script automatically adjusts the expiry to the previous working day (Monday to Friday).
3. Customization Options
The user can:
• Choose the position of the expiry table on the chart (e.g. top right, bottom left).
• Select the font size for the expiry table.
• Enable or disable the table entirely (if implemented as an input toggle).
4. Visual Expiry Highlighting
If today is an expiry day for any instrument, the script highlights that instrument in the display. This makes it easy to spot significant expiry days, which are often associated with increased volatility and trading volume.
⸻
How It Works
• The script calculates the next expiry for each index using built-in date/time functions.
• For weekly expiries, it finds the next occurrence of the designated weekday.
• For monthly expiries, it finds the last Thursday or Tuesday of the month.
• Each expiry date is passed through a check to adjust for holidays or weekends.
• If today matches the adjusted expiry date, that row is visually emphasized.
⸻
Use Case
This script is ideal for traders who want a quick glance at which instruments are expiring soon — especially those managing options, futures, or expiry-based strategies.
Session High/Low: Asia & LondonIndicator to automatically mark the lower low and the higher high of the Asian and London sessions.


Scalping EMA Crossover (EMA 9 / EMA 21 + EMA 200)scalping ema crossover u can change ema
ema 9
ema 21
ema 200


EMA Hierarchy Alternating Alert MarkersThis script allows you to set EMA 5, 13 & 26 in a single indicator.
It allows you to set an alert when PCO or NCO happens where 5>13>26 (PCO) or 5<13<26 (NCO).
It has been designed in such a way that the alert will only be sounded on the first PCO or NCO.
Once a PCO has happened then the next PCO alert will only come after the NCO has happened.
This feature helps you to avoid getting multiple alerts specially if you are using a lower timeframe.
Scripts: Equities, F&O, Commodity, Crypto, Currency
Time Frame: All
By TrustingOwl83470

Support Resistance + Trendlines StrategyCheck out this YouTube video for a detailed tutorial on how to start this trading rally.
Смотрите на ютубе подробное видео как запустить эту торговую стратегию.

5-Minute Scalping Botkrozz indicator working on all time frames . take profit and stop lose on chart.
