Indicators and strategies

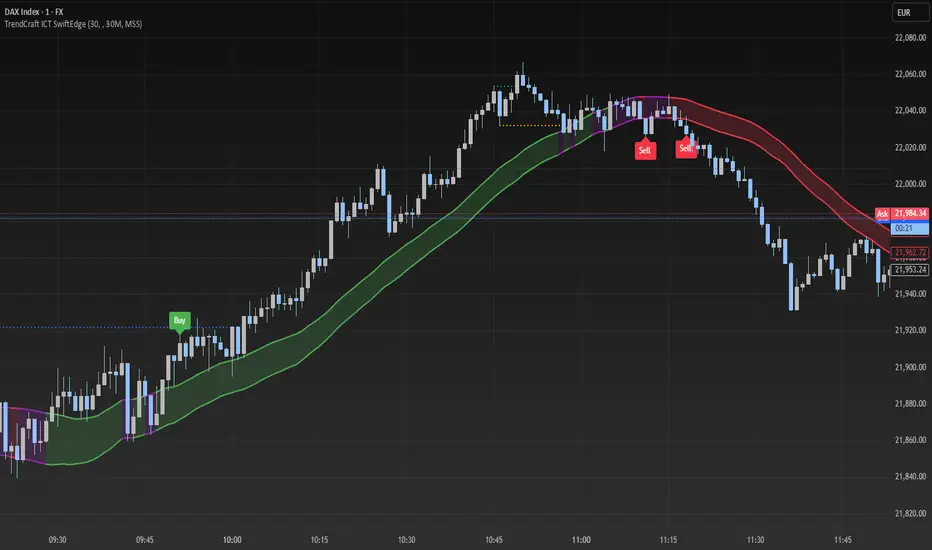
TrendCraft ICT SwiftEdge// The TrendCraft ICT SwiftEdge is a trend-following indicator that combines Simple Moving Averages (SMAs) with Inner Circle Trader (ICT) concepts, specifically Break of Structure (BOS) and Market Structure Shift (MSS), to generate precise buy and sell signals. This unique mashup leverages the strengths of trend confirmation through SMAs and market structure analysis via ICT to help traders identify high-probability trend entries. The indicator is designed to be intuitive, customizable, and suitable for traders of all levels seeking to align with market trends on various timeframes.
//
// ### What It Does
// The indicator plots two SMAs based on the high and low prices of candles to define the trend direction. It colors the SMAs and fills the area between them to visually indicate whether the price is in a bullish (above both SMAs), bearish (below both SMAs), or neutral (between SMAs) state. Simultaneously, it identifies BOS and MSS levels on a user-defined higher timeframe to confirm trend continuation or reversal points. Buy and sell signals are generated when the price closes above/below the latest BOS or MSS level (based on user preference) while also being correctly positioned relative to the SMAs, ensuring alignment with the trend.
//
// ### Why Combine SMAs and ICT?
// SMAs provide a reliable way to gauge trend direction by smoothing price data, but they can lag or generate false signals in choppy markets. ICT's BOS and MSS concepts address this by focusing on key market structure breaks, offering context for significant price movements. By requiring price to close beyond a BOS or MSS level and align with the SMA-defined trend, the TrendCraft ICT SwiftEdge filters out noise and enhances signal reliability. This combination creates a robust system that balances trend-following simplicity with structural market insights, making it ideal for trend traders.
//
// ### How to Use
// 1. **SMA Length**: Adjust the `SMA Length` (default: 20) to control the sensitivity of the SMAs. Shorter lengths react faster to price changes, while longer lengths provide smoother trends.
// 2. **Structure Timeframe**: Set the `Structure Timeframe` to a higher timeframe (e.g., "1H" on a 15M chart) to calculate BOS and MSS levels. This ensures structural signals are based on significant market moves.
// 3. **Chart Timeframe**: Select the `Chart Timeframe` to optimize pivot point calculations for your current chart (e.g., "30M" for a 30-minute chart).
// 4. **Signal Type**: Choose between "BOS" (default) for signals based on trend continuation breaks or "MSS" for signals based on potential reversal points (breakers).
// 5. **Display Options**: Enable/disable `Show Continuation (BOS)` and `Show Breaker (MSS)` to toggle the visibility of BOS and MSS lines. Customize their colors for better chart clarity.
//
// ### Signals
// - **Buy Signal**: Appears when the close price crosses above the latest BOS or MSS level (based on Signal Type) and is above both SMAs, indicating a bullish trend entry. Marked with a green "Buy" label.
// - **Sell Signal**: Appears when the close price crosses below the latest BOS or MSS level (based on Signal Type) and is below both SMAs, indicating a bearish trend entry. Marked with a red "Sell" label.
//
// ### Originality
// The TrendCraft ICT SwiftEdge stands out by integrating the trend-following reliability of SMAs with the structural precision of ICT's BOS and MSS. Unlike standalone SMA or ICT indicators, this script requires both trend alignment and structural confirmation, reducing false signals. The user-selectable Signal Type (BOS or MSS) adds versatility, allowing traders to adapt the indicator to trend-following or counter-trend strategies. Its dynamic timeframe adjustments and visual clarity make it a unique tool for traders seeking to capture trend entries with confidence.
//
// ### Notes
// - Ensure the `Structure Timeframe` is higher than your chart timeframe to avoid calculation issues.
// - Signals are generated only when the trend state changes to avoid redundant signals in the same trend direction.
// - Past performance is not indicative of future results. Always combine this indicator with other analysis and risk management techniques.
Candle Range Theory (Sweep & Inside Body)CRT a simple version for H4 time frame just for checking purpose

SMI_GEOCustom Stochastic Momentum Index (SMI) indicator, suitable for scalping/automatic alerts. Parameters:

EMA TrendEMA Trend is a simple yet effective technical analysis tool that plots three Exponential Moving Averages (EMAs) — Fast, Medium, and Slow — on the price chart to help identify trend direction and strength.
The Fast EMA (default: 10) and Medium EMA (default: 30) are used together to define short- to medium-term trend shifts. When the Fast EMA crosses above the Medium EMA, the indicator fills the area between them with a green color to highlight bullish momentum. Conversely, when the Fast EMA falls below the Medium EMA, the fill turns orange to indicate bearish pressure. The color fill provides a quick visual cue for potential trend changes or continuation.
The Slow EMA (default: 100) serves as a longer-term trend baseline, helping traders align their strategy with the broader market direction.

Average Daily Price Movement (14 Days)Computes the daily high-low range
Averages it over 14 candles
Displays a label on the most recent candle with the average range in text

HTF 4-Candle ViewerFractal Model for TTrades and Kane. This indicator allows you to see the previous 3 candles on a HTF aswell as the current one forming.

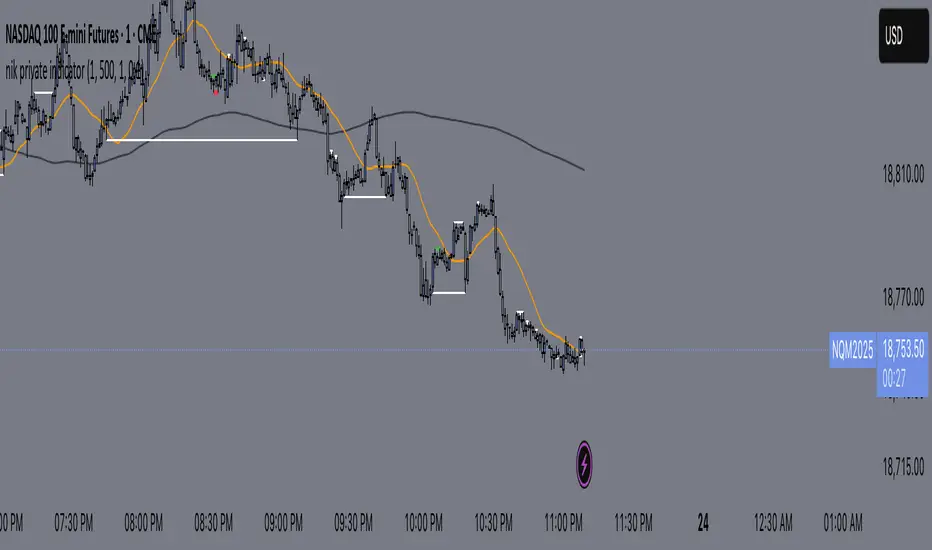
nik private indicatorlol eqx go brrr, this indicator helps mark out equal highs and lows, while alerting you, allowing for you to trade without watching the charts all session.
EMA Technical Analysis with Reversal ZonesKey Features:
1. EMA Analysis:
• Plots multiple EMAs: 5, 9, 13, 21, 50.
• Highlights bullish/bearish crossovers:
• EMA 5/13 crossover
• EMA 9/21 crossover
• Crossovers are marked with colored circles on the chart.
2. VWAP (Volume-Weighted Average Price):
• Custom color changes based on price relation:
• Green if above
• Red if below
3. MACD:
• Customizable MACD settings.
• Evaluates both signal line crossover and MACD > 0 condition.
• Displayed in the table for quick trend strength checks.
4. PSAR (Parabolic SAR):
• Plotted as dots with color change based on price relation.
5. RSI & Bollinger Bands:
• RSI helps gauge momentum.
• Bollinger Bands mark overbought/oversold extremes.
• Close proximity to upper/lower bands is highlighted with custom logic.
6. ADX (Trend Strength):
• Assesses whether the market is trending strongly.
• Indicates bullish or bearish strength with arrows or dots in the table.
7. SPX/VIX Market Sentiment Integration:
• Uses SPX (S&P 500) and VIX data for additional context.
• Custom coloring for fear/greed scenarios.
8. Dynamic Status Table:
• Located at a user-defined screen position.
• Displays real-time conditions for all indicators.
• Uses colored dots/arrows for quick scanning.
9. Reversal Zones:
• Uses Bollinger Bands + RSI to define:
• Oversold (Red Background)
• Overbought (Green Background) zones
10. Confirmation Zones:
• Combines EMA and MACD crossovers for:
• Bullish confirmation (Green Background)
• Bearish confirmation (Red Background)
11. Alerts:
• Built-in alerts for:
• EMA crossovers
• Deep overbought/oversold
• Confirmation signals


M2SL/DXY vs CryptoJust a test.With this indicator, we will be able to predict the trends of economic cycles and cash flow within the market.


AlphaTrend++AlphaTrend++
An advanced, fully customizable fork of Kivanc Ozbilgic’s AlphaTrend. This version enhances signal accuracy and chart clarity with:
• Original AlphaTrend signal logic including signal frequency filtering (barssince-based)
• Optional raw (unfiltered) signal mode for more frequent entries
• Dynamic stop loss tick labels based on AlphaTrend levels and user-defined tick size
• Optional time window filter for intraday signal control
• Clean dual-layer trend cloud with color-coded momentum direction
Ideal for discretionary or system traders looking to combine visual structure with robust signal logic.

Niveles decimalesCREATOR: SANTIAGO CANO
this indicator marks decimals in 10s on a graph for easier reading in assets such as indices or raw materials

Umair SuperchartThis indicator combines traditional pivot point analysis with volume surge detection to provide comprehensive trading signals. Here are its key features:
Main Components:
1. Daily Pivot Points (PP, R1-R3, S1-S3)
- Automatically calculates and displays pivot levels
- Color-coded lines (Red for Resistance, Blue for Pivot, Green for Support)
- Movable information box showing all levels
- Works across all timeframes
2. Volume Surge Detection
- Monitors volume increases above 20-period average
- Shows small triangles for immediate volume surges
• Green triangle below bar for bullish volume
• Red triangle above bar for bearish volume
3. Strong Buy/Sell Signals
- Tracks sustained volume surges (default 10 minutes)
- Displays blinking "STRONG BUY!" or "STRONG SELL!" messages
- Provides alerts for sustained momentum
Customizable Features:
- Adjustable volume surge threshold
- Customizable sustained period duration
- Movable pivot level display box
- Adjustable line widths and colors
- Flexible position settings
Alerts:
- Price breaks above R1/below S1
- Immediate volume surges
- Sustained bullish/bearish volume movements
Perfect for:
- Day traders monitoring volume-price relationship
- Swing traders using pivot points for support/resistance
- Technical analysts requiring multiple confirmation signals

Triad Macro Gauge__________________________________________________________________________________
Introduction
__________________________________________________________________________________
The Triad Macro Gauge (TMG) is designed to provide traders with a comprehensive view of the macroeconomic environment impacting financial markets. By synthesizing three critical market signals— VIX (volatility) , Credit Spreads (credit risk) , and the Stocks/Bonds Ratio (SPY/TLT) —this indicator offers a probabilistic assessment of market sentiment, helping traders identify bullish or bearish macro conditions.
Holistic Macro Analysis: Combines three distinct macroeconomic indicators for multi-dimensional insights.
Customization & Flexibility: Adjust weights, thresholds, lookback periods, and visualization styles.
Visual Clarity: Dynamic table, color-coded plots, and anomaly markers for quick interpretation.
Fully Consistent Scores: Identical values across all timeframes (4H, daily, weekly).
Actionable Signals: Clear bull/bear thresholds and volatility spike detection.
Optimized for timeframes ranging from 4 hour to 1 week , the TMG equips swing traders and long-term investors with a robust tool to navigate macroeconomic trends.
__________________________________________________________________________________
Key Indicators
__________________________________________________________________________________
VIX (CBOE:VIX): Measures market volatility (negatively weighted for bearish signals).
Credit Spreads (FRED:BAMLH0A0HYM2EY): Tracks high-yield bond spreads (negatively weighted).
Stocks/Bonds Ratio (SPY/TLT): Evaluates equity sentiment relative to treasuries (positively weighted).
__________________________________________________________________________________
Originality and Purpose
__________________________________________________________________________________
The TMG stands out by combining VIX, Credit Spreads, and SPY/TLT into a single, cohesive indicator. Its unique strength lies in its fully consistent scores across all timeframes, a critical feature for multi-timeframe analysis.
Purpose: To empower traders with a clear, actionable tool to:
Assess macro conditions
Spot market extremes
Anticipate reversals
__________________________________________________________________________________
How It Works
__________________________________________________________________________________
VIX Z-Score: Measures volatility deviations (inverted for bearish signals).
Credit Z-Score: Tracks credit spread deviations (inverted for bearish signals).
Ratio Z-Score: Assesses SPY/TLT strength (positively weighted for bullish signals).
TMG Score: Weighted composite of z-scores (bullish > +0.30, bearish < -0.30).
Anomaly Detection: Identifies extreme volatility spikes (z-score > 3.0).
All calculations are performed using daily data, ensuring that scores remain consistent across all chart timeframes.
__________________________________________________________________________________
Visualization & Interpretation
__________________________________________________________________________________
The script visualizes data through:
A dynamic table displaying TMG Score , VIX Z, Credit Z, Ratio Z, and Anomaly status, with color gradients (green for positive, red for negative, gray for neutral/N/A).
A plotted TMG Score in Area, Histogram, or Line mode , with adaptive opacity for clarity.
Bull/Bear thresholds as horizontal lines (+0.30/-0.30) to signal market conditions.
Anomaly markers (orange circles) for volatility spikes.
Crossover signals (triangles) for bull/bear threshold crossings.
The table provides an immediate snapshot of macro conditions, while the plot offers a visual trend analysis. All values are consistent across timeframes, simplifying multi-timeframe analysis.
__________________________________________________________________________________
Script Parameters
__________________________________________________________________________________
Extensive customization options:
Symbol Selection: Customize VIX, Credit Spreads, SPY, TLT symbols
Core Parameters: Adjust lookback periods, weights, smoothing
Anomaly Detection: Enable/disable with custom thresholds
Visual Style: Choose display modes and colors
__________________________________________________________________________________
Conclusion
__________________________________________________________________________________
The Triad Macro Gauge by Ox_kali is a cutting-edge tool for analyzing macroeconomic trends. By integrating VIX, Credit Spreads, and SPY/TLT, TMG provides traders with a clear, consistent, and actionable gauge of market sentiment.
Recommended for: Swing traders and long-term investors seeking to navigate macro-driven markets.
__________________________________________________________________________________
Credit & Inspiration
__________________________________________________________________________________
Special thanks to Caleb Franzen for his pioneering work on macroeconomic indicator blends – his research directly inspired the core framework of this tool.
__________________________________________________________________________________
Notes & Disclaimer
__________________________________________________________________________________
This is the initial public release (v2.5.9). Future updates may include additional features based on user feedback.
Please note that the Triad Macro Gauge is not a guarantee of future market performance and should be used with proper risk management. Past performance is not indicative of future results.

Pullback 61% + EMA + Pivot Auto + FiltrosBuscador de entrada en base a retrocesos, con filtrador de EMA al 50

higher timeframe candle rangecreates a range around the selected timeframe in minutes (other than D/W/M)
use wherever deemed strong

Mongoose Capital: FlowWave + Conviction Strip🟩 Indicator Name
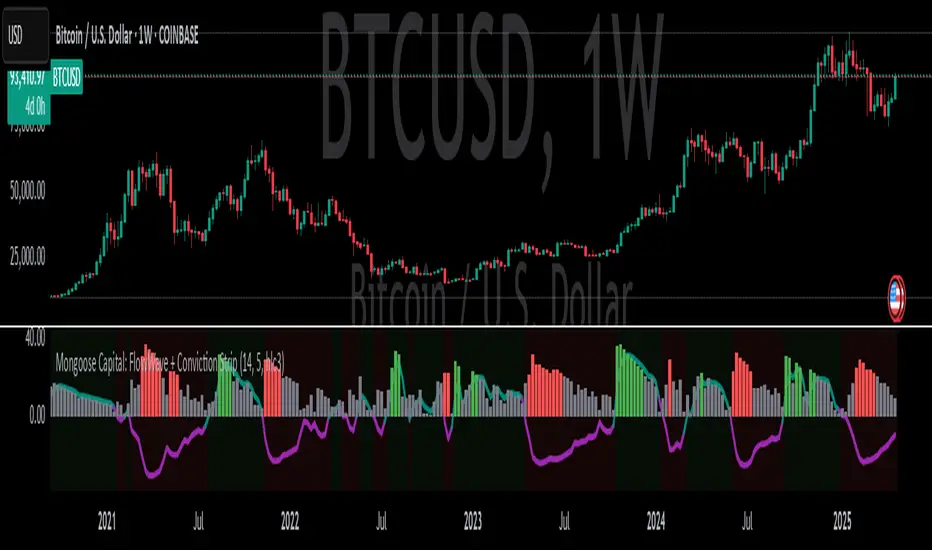
Mongoose Capital: FlowWave + Conviction Strip
📜 Short Description
Smoothed Money Flow Oscillator with conviction scoring columns to assess flow strength.
🧠 Description (Long Form)
The Mongoose Capital: FlowWave + Conviction Strip is a refined visualization of money flow dynamics designed to identify shifts in volume pressure and trend strength.
This dual-panel indicator includes:
• FlowWave Line — A smoothed momentum curve built from normalized money flow data, filtered through dual EMAs. Green (positive) and purple (negative) segments help traders quickly assess bias shifts.
• Conviction Score Columns — A histogram below the zero line shows strength of flow deltas (momentum of volume pressure). Green/red bars appear when strength exceeds a critical threshold, while gray bars indicate low conviction.
• Background Zone Coloring — Optional dark red/green gradient to enhance visibility of positive/negative phases.
✅ Designed for traders who value clarity and minimal noise
✅ Pairs well with macro trend filters or breakout strategies
✅ Built and published by Mongoose Capital
🔧 Default Settings
Money Flow Length: 14
Signal Cooldown: 5 bars
Source: HLC3
EMA Wave Filter: 3
Strength Threshold: 20
🧪 Suggested Use
Confirm entries/exits in trend continuation setups
Identify divergences between price and money flow
Filter low-conviction trades using the histogram's gray zone
Spot early accumulation or distribution through wave crossovers
📢 Author
Published by: TheRealMongoose
Powered by: Mongoose Capital
Feel free to tag us in your setups.

EMA (25, 50, 100)Three EMA (25, 50, 100) with three color (red, orange and yellow) with tre different line widht.

Ultimate Scalping Dashboard (w/ Entry/Exit)Entry Recommendation: When all conditions align (momentum, trend, volume, etc.)
Exit Recommendation:
Exit Long when bullish conditions weaken
Exit Short when bearish conditions weaken
These will appear in a new column in your dashboard: ENTRY/EXIT
Signal: Whether the market setup is Long, Short, or Neutral
Entry/Exit: When to Enter Long/Short, or when to Exit

Simple Momentum IndicatorThis helps you see if price is gaining bullish or bearish strength.
HOW TO USE:
A line above 0 = bullish momentum (price is rising)
A line below 0 = bearish momentum (price is falling)
A flat line around 0 = neutral , range-bound price
Color: green (bullish) or red (bearish)
Optional background color to match momentum direction
SITUATIONS OF:
1. Confirm Reversals
If you get a rejection john wick + engulfing candle,
Check if momentum is flipping at the same time
If yes = stronger reversal confirmation
2. Avoid Range Traps
If momentum is flat around 0, avoid trades — it’s not trending
Wait until momentum clearly breaks above/below 0
Best Timeframes to Use
5m / 15m = for scalping and fast intraday moves
1H / 4H = for cleaner, swing-trade confirmation
Works great when the market is volatile, like:
London / New York session
Breakout after consolidation
-Chris (973) 37733023
