UltraAlgoguy Shortband [CuriousB]This is a customized Moving Average Ribbons indicator. The moving average bands for Super/UltraGuppy specs for Scott's Zone Traders UltraAlgoguy (courtesy of Anthony (whom we affectionately know as: Algoguy) for helping me update the specs and showed me how to use it!) are Fast Band ema 10-120 by 2s and Slow Band ema 150-300 by 2s.
I was forced to break the indicator into 3 parts since I am unable to include so many plots in a single indicator script...so load #1 longband, #2 shortband then 3# oscillator in order to get the layers z-axis aligned for front to back visuals.
The Oscillator shows: distance between the average of the bands as the oscillator line, size of the gap between the bands as the histogram, compression of the bands as dots colored the same as the bands and orange for both compressing simultaneously, trend direction signal on rotation of the trend/slow band and buy and sell signals when the gap is open after crossover and trend is in the same direction.
Original code from: QuantVue GMMA Toolkit then modified for UltraGuppy specifications.
Indicators and strategies

Golden Swing Strategy - Signal/Entry/SL/Target🔍 Golden Swing Strategy – Visual Indicator
This indicator combines momentum, trend direction, and volatility filters into a unified signal framework designed for swing trading. It generates buy/sell signals only when multiple conditions align, providing high-confluence trade setups with dynamic risk management.
________________________________________
🚀 Strategy Logic:
This tool uses a confluence of technical indicators to validate trade entries:
• RSI (20): Measures market momentum. Long signals require RSI > 50; short signals require RSI < 50.
• Stochastic (55,34,21): Identifies overbought/oversold turning points for timing.
• Bollinger Band Midline (20,2): Provides a volatility-based context filter.
• Supertrend (10,2): Determines trend direction and serves as dynamic support/resistance.
• ATR (5): Powers risk management features including Stop Loss (SL), Target, and Entry Band calculations.
________________________________________
✅ Signal Conditions:
• Buy Signal: RSI > 50 + Stoch %K crosses above %D + Price pulls back below Supertrend + Supertrend below BB midline
• Sell Signal: RSI < 50 + Stoch %K crosses below %D + Price pulls back above Supertrend + Supertrend above BB midline
________________________________________
🎯 Risk Management & Position Sizing:
• Entry Band: Supertrend ± 0.5 × ATR (shaded zone, optional)
• Stop Loss: Supertrend ± 1.1 × ATR (based on previous candle)
• Target: Supertrend ± 2.2 × ATR
• Position Size: Automatically calculated based on max loss input
________________________________________
⚙️ User Controls:
• All parameters (RSI length, ATR period, SL/TP multipliers, etc.) are fully adjustable
• Toggle each visual element independently:
o Buy/Sell signal markers
o Supertrend plot
o Entry band shading
o SL/TP levels
o Price labels
o Position size label
• Adjust how many recent bars show signals to keep charts clean
________________________________________
🧠 What Makes This Unique?
While RSI, Stochastics, Supertrend, and ATR are standard tools, this indicator does not simply mash them together. It applies them in a layered logic to:
• Validate trades only when momentum, volatility, and structure align
• Automate visual risk-reward mapping and position sizing
• Provide traders with interpretable, real-time confluence signals with clean visuals
The system is modular, transparent, and optimized for clarity, making it ideal for swing traders who want to reduce noise and make decisions based on multiple confirmations.

UltraAlgoguy Longband [CuriousB]This is a customized Moving Average Ribbons indicator. The moving average bands for Super/UltraGuppy specs for Scott's Zone Traders UltraAlgoguy (courtesy of Anthony (whom we affectionately know as: Algoguy) for helping me update the specs and showed me how to use it!) are Fast Band ema 10-120 by 2s and Slow Band ema 150-300 by 2s.
I was forced to break the indicator into 3 parts since I am unable to include so many plots in a single indicator script...so load #1 longband, #2 shortband then 3# oscillator in order to get the layers z-axis aligned for front to back visuals.
The Oscillator shows: distance between the average of the bands as the oscillator line, size of the gap between the bands as the histogram, compression of the bands as dots colored the same as the bands and orange for both compressing simultaneously, trend direction signal on rotation of the trend/slow band and buy and sell signals when the gap is open after crossover and trend is in the same direction.
Original code from: QuantVue GMMA Toolkit then modified for UltraGuppy specifications.

Indexed MACD Oscillator🔵 Indexed MACD Oscillator — A Fresh Perspective on Momentum
This script transforms the traditional MACD histogram into a normalized oscillator scaled between 0 and 100, offering a unique and intuitive view of momentum.
📌 How it works:
Calculates the standard MACD histogram (12, 26, 9).
Normalizes the histogram over the last 100 bars to fit a fixed 0–100 range.
This allows for easier visual comparisons of MACD strength across different timeframes or assets.
✅ Key Benefits:
Detects relative momentum strength without being skewed by absolute price changes.
Useful for spotting divergence, overbought/oversold regions, or enhanced signal clarity.
Cleaner display for multi-chart setups or cross-asset analysis.
🛠️ Customization Ideas:
Combine with RSI, trend filters, or volume for confirmation.
Add colored zones to highlight potential reversal areas.

EMA CCI SSL BUY SELL Signal [THANHCONG]EMA CCI SSL BUY SELL Signal
Introduction:
The EMA CCI SSL BUY SELL Signal indicator is a comprehensive technical analysis tool designed to help traders identify trends and optimal entry and exit points with clarity and reliability. By combining reputable indicators such as EMA, CCI, SSL Channel, and RSI, this indicator generates buy and sell signals based on multiple validated factors, helping to filter noise and increase accuracy.
Key Features:
Utilizes multi-timeframe SSL channel with both automatic and manual mode options, suitable for various trading strategies.
Includes an RSI filter to minimize false signals in overbought or oversold regions.
Detects volume spikes to confirm the strength of the current trend.
Integrates CCI divergence and reversal candle patterns (Hammer, Shooting Star) to enhance signal precision in spotting potential reversals.
Displays clear buy/sell signals directly on the chart and provides a live performance table showing percentage changes.
Supports linear regression channel drawing to help users easily recognize trend direction and price volatility.
Recommended Usage:
Optimal Timeframes: Best used on 5-minute, 15-minute, 1-hour, 4-hour, 12-hour, and daily (D) timeframes. Avoid using on other timeframes to maintain signal reliability.
Signal Confirmation: Combine indicator signals with SSL channel direction and regression channel slope to improve confidence.
Combined Indicators: For enhanced effectiveness and noise reduction, it is recommended to use this indicator alongside the MCDX+RSI+SMA indicator. This combined approach provides a more comprehensive market view and supports better trading decisions.
Alerts: Users can set buy/sell alerts on TradingView to receive timely notifications when signals occur.
Important Notes:
This indicator is provided as a technical analysis aid and is not financial advice or a guarantee of profit.
Indicator performance may vary depending on market conditions and the traded asset.
Users should combine multiple tools and practice proper risk management when making trading decisions.
Thank You:
Thank you for using this indicator! If you find it useful, please consider leaving positive feedback and sharing it to help build a professional, transparent, and sustainable trading community.
Disclaimer:
The author and TradingView are not responsible for any losses resulting from the use of this indicator. Please trade responsibly and carefully consider your decisions.
Wishing you successful and safe trading!
#EMA #CCI #SSLChannel #RSI #TradingView #BuySellSignals #TechnicalAnalysis #TrendFollowing #VolumeSpike #CandlePatterns #TradingTools #Forex #Stocks #Crypto #Thanhcong

HTF Candle Breakout Fibonacci LevelsThis indicator automatically plots Fibonacci retracement levels on a lower timeframe (LTF) after detecting a breakout candle on a selected higher timeframe (HTF).
🔍 How It Works
When a candle on your selected HTF closes beyond the high or low of the previous candle, the indicator automatically draws Fibonacci levels on the LTF.
These levels remain visible until the next HTF candle is formed — allowing you to trade retracements with contextual precision.
⸻
⚙️ Customization Options
From the indicator settings, you can modify:
• The HTF candle timeframe (default is 1D)
• Fibonacci levels and colors
• Enable or disable “Show Only the Latest Levels” — ideal for live trading to keep the chart clean and focused.
⸻
🟪 HTF Candles Preview
After applying the indicator, you’ll see 3 vertical bars on the right edge of your LTF chart. These represent a live preview of the last three HTF candles and update in real-time.
If you prefer a cleaner chart, disable this feature via the “Show HTF Candles” toggle in the settings.
⸻
Feel free to reach out if you have any questions.

Strategy Builder With IndicatorsThis strategy script is designed for traders who enjoy building systems using multiple indicators.
Please note: This script does not include any built-in indicators. Instead, it works by referencing the plot outputs of the indicators you’ve already added to your chart.
For example, if you add a MACD and an ATR indicator to your chart, you can assign their plot values as inputs in the settings panel of this strategy.
• MACD as a trigger
• ATR as a filter
How Filters Work
Filters check whether certain conditions are met before a trade can be opened. For instance, if you set a filter like ATR > 30, then no trade will be executed unless that condition is true — even if the trigger fires.
All filters are linked, meaning every active filter must be satisfied for a trade to occur.
How Triggers Work
Triggers are what actually fire a trade signal — such as a moving average crossover or RSI breaking above a specific level. Unlike filters, triggers are independent. Only one active trigger needs to be true for the trade to execute.
Thanks to its modular structure, this strategy can be used with any indicator of your choice.
⸻
Risk Management Features
In the settings, you’ll find flexible options for:
• Stop Loss (SL)
• Trailing Stop Loss (TSL)
• Multi Take-Profit (TP)
These features enhance trade safety and let you tailor your risk management.
SL types available:
• Tick-based SL
• Percent-based SL
• ATR-based SL
Once you select your preferred SL type, you can fine-tune its distance using the offset field.
Trailing SL allows your stop to follow price as it moves in your favor — helping to lock in profits.
Multi-TP lets you take profits at two different levels, helping you secure gains while leaving room for extended moves.
Breakeven option is also available to automatically move your SL to entry after reaching a profit threshold.
⸻
How to Build a Solid Strategy
Let’s break down a good setup into three key components:
1. Trend Filter
Avoid trading against the trend — that’s like swimming against the current.
Use a filter like:
• Supertrend
• Momentum indicators
• Candlestick bias, etc.
Example: In this case, I used Supertrend and filtered for trades only if the price is above the uptrend line.
2. Trigger Condition
Once we confirm the trend is on our side, we need a trigger to execute at the right moment. This can be:
• RSI cross
• Candlestick patterns
• Trendline breaks
• Moving average crossovers, etc.
Example: I used RSI crossing above 50 as the entry trigger.
3. Risk Management
Even in the right trend at the right time — anything can happen. That’s why you should always define Stop Loss and Take Profit levels.
⸻
And there you have it! Your strategy is ready to backtest, refine, and deploy with alerts for live trading.
Questions or suggestions? Feel free to reach out

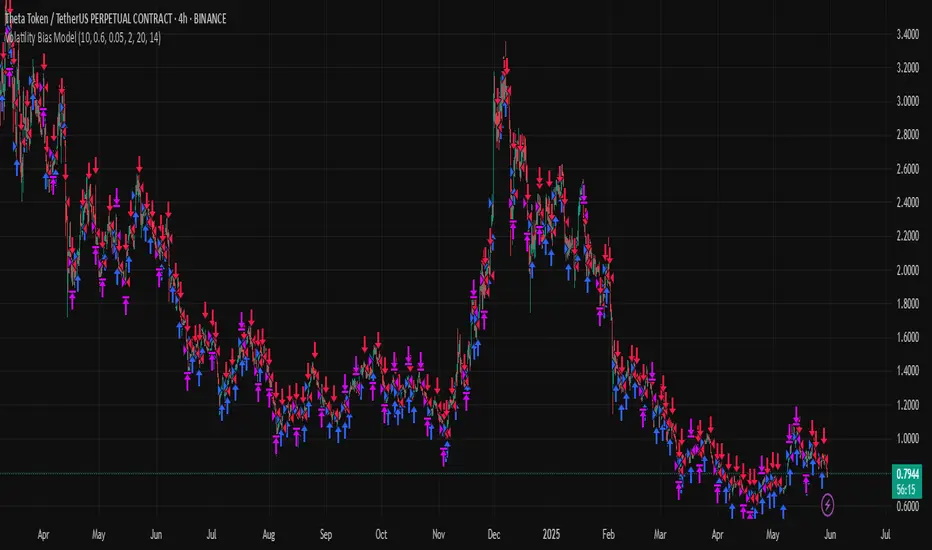
Volatility Bias ModelVolatility Bias Model
Overview
Volatility Bias Model is a purely mathematical, non-indicator-based trading system that detects directional probability shifts during high volatility market phases. Rather than relying on classic tools like RSI or moving averages, this strategy uses raw price behavior and clustering logic to determine potential breakout direction based on recent market bias.
How It Works
Over a defined lookback window (default 10 bars), the strategy counts how many candles closed in the same direction (i.e., bullish or bearish).
Simultaneously, it calculates the price range during that window.
If volatility is above a minimum threshold and a clear directional bias is detected (e.g., >60% of closes are bullish), a trade is opened in the direction of that bias.
This approach assumes that when high volatility is coupled with directional closing consistency, the market is probabilistically more likely to continue in that direction.
ATR-based stop-loss and take-profit levels are applied, and trades auto-exit after 20 bars if targets are not hit.
Key Features
- 100% non-indicator-based logic
- Statistically-driven directional bias detection
- Works across all timeframes (1H, 4H, 1D)
- ATR-based risk management
- No pyramiding, slippage and commissions included
- Compatible with real-world backtesting conditions
Realism & Assumptions
To make this strategy more aligned with actual trading environments, it includes 0.05% commission per trade and a 1-point slippage on every entry and exit.
Additionally, position sizing is set at 10% of a $10,000 starting capital, and no pyramiding is allowed.
These assumptions help avoid unrealistic backtest results and make the performance metrics more representative of live conditions.
Parameter Explanation
Bias Window (10 bars): Number of past candles used to evaluate directional closings
Bias Threshold (0.60): Required ratio of same-direction candles to consider a bias valid
Minimum Range (1.5%): Ensures the market is volatile enough to avoid noise
ATR Length (14): Used to dynamically define stop-loss and target zones
Risk-Reward Ratio (2.0): Take-profit is set at twice the stop-loss distance
Max Holding Bars (20): Trades are closed automatically after 20 bars to prevent stagnation
Originality Note
Unlike common strategies based on oscillators or moving averages, this script is built on pure statistical inference. It models the market as a probabilistic process and identifies directional intent based on historical closing behavior, filtered by volatility. This makes it a non-linear, adaptive model grounded in real-world price structure — not traditional technical indicators.
Disclaimer
This strategy is for educational and experimental purposes only. It does not constitute financial advice. Always perform your own analysis and test thoroughly before applying with real capital.
Custom Call/Put with TP Levels//@version=5
indicator("Custom Call/Put with TP Levels", overlay=true)
// إعدادات المستخدم
call_level = input.float(5958.26, "CALL Level", step=0.1)
put_level = input.float(5939.50, "PUT Level", step=0.1)
tp_above = input.float(5977.02, "TP1 Above", step=0.1)
tp_above_2 = input.float(5995.78, "TP2 Above", step=0.1)
tp_above_3 = input.float(6014.54, "TP3 Above", step=0.1)
tp_above_4 = input.float(6033.3, "TP4 Above", step=0.1)
tp_above_5 = input.float(6052.06, "TP5 Above", step=0.1)
tp_below = input.float(5920.74, "TP1 Below", step=0.1)
tp_below_2 = input.float(5901.98, "TP2 Below", step=0.1)
tp_below_3 = input.float(5883.22, "TP3 Below", step=0.1)
tp_below_4 = input.float(5864.46, "TP4 Below", step=0.1)
tp_below_5 = input.float(5845.7, "TP5 Below", step=0.1)
tp_below_6 = input.float(5826.94, "TP6 Below", step=0.1)
// رسم الخطوط مرة واحدة فقط عند بداية المؤشر
if bar_index == 1
// خطوط CALL و PUT
line.new(bar_index, call_level, bar_index + 1, call_level, color=color.green, width=2, extend=extend.right)
line.new(bar_index, put_level, bar_index + 1, put_level, color=color.red, width=2, extend=extend.right)
// خطوط TP فوق السعر
line.new(bar_index, tp_above, bar_index + 1, tp_above, color=color.maroon, style=line.style_dotted, extend=extend.right)
line.new(bar_index, tp_above_2, bar_index + 1, tp_above_2, color=color.maroon, style=line.style_dotted, extend=extend.right)
line.new(bar_index, tp_above_3, bar_index + 1, tp_above_3, color=color.maroon, style=line.style_dotted, extend=extend.right)
line.new(bar_index, tp_above_4, bar_index + 1, tp_above_4, color=color.maroon, style=line.style_dotted, extend=extend.right)
line.new(bar_index, tp_above_5, bar_index + 1, tp_above_5, color=color.maroon, style=line.style_dotted, extend=extend.right)
// خطوط TP تحت السعر
line.new(bar_index, tp_below, bar_index + 1, tp_below, color=color.orange, style=line.style_dotted, extend=extend.right)
line.new(bar_index, tp_below_2, bar_index + 1, tp_below_2, color=color.orange, style=line.style_dotted, extend=extend.right)
line.new(bar_index, tp_below_3, bar_index + 1, tp_below_3, color=color.orange, style=line.style_dotted, extend=extend.right)
line.new(bar_index, tp_below_4, bar_index + 1, tp_below_4, color=color.orange, style=line.style_dotted, extend=extend.right)
line.new(bar_index, tp_below_5, bar_index + 1, tp_below_5, color=color.orange, style=line.style_dotted, extend=extend.right)
line.new(bar_index, tp_below_6, bar_index + 1, tp_below_6, color=color.orange, style=line.style_dotted, extend=extend.right)

Grok's Ultimate Bitcoin PredictorGork IA BTC indicator best for 1/4h, it uses best known strategies for BTC specific asset

Ferrari Bot - Alerts + TP/SL LabelsAI assisted indicator created by myself with ChatGPT - 4's help
🚀 Ferrari Bot - Smart 4H Trading Signal System
Description:
Ferrari Bot is a precision-engineered crypto trading indicator designed to identify high-probability long and short setups on the 4-hour chart. It uses a multi-layered confluence strategy to filter trades with clarity, discipline, and edge.
This indicator is built for traders who value:
✅ Clear visual trade signals
✅ Strong risk/reward logic (3:1 & 5:1)
✅ Built-in market structure + momentum filters
✅ Manual trading alerts that actually work
Core Logic Includes:
📈 Trend filtering with the 200 EMA
🔍 RSI momentum checks (zone-based or crossover)
⚡ Flexible MACD confirmation for breakout momentum
📊 ATR-based volatility filter
🕯️ Price action + candle strength validation
🧪 Configurable filtering modes (None, Moderate, Strict)
🎯 Visual TP/SL plots and labeled targets
Alerts & Labels:
🔔 Long & Short signal alerts
🏷️ Automatic TP/SL labels for manual execution
📉 Stop-loss levels calculated via ATR
📈 Target levels shown for both 3:1 and 5:1 R:R
*** i noticed it tends to be stopped out at least once rather often due to it's SL being rather tight and then the deviation occurs. i recommend looking for the deviation move then entering the trade - not financial advice; please use at your own risk!
//@version=6
//AI assisted multi-confluence 4HR swing trade indicator
indicator("Ferrari Bot - Alerts + TP/SL Labels", overlay=true)
// === USER INPUTS ===
timeframe = input.timeframe("240", "Strategy Timeframe")
atrMultiplier = input.float(1.2, title="ATR Multiplier for Stop-Loss (Tighter)", minval=0.5)
rsiSource = input.source(close, "RSI Source")
rsiPeriod = input.int(14, "RSI Period")
emaPeriod = input.int(200, "EMA Period")
macdShort = input.int(12, "MACD Fast")
macdLong = input.int(26, "MACD Slow")
macdSignal = input.int(9, "MACD Signal")
filterMode = input.string("Moderate", title="Filter Mode", options= )
volumeWindow = filterMode == "Strict" ? 20 : filterMode == "Moderate" ? 15 : 1
atrThreshold = filterMode == "Strict" ? 0.01 : filterMode == "Moderate" ? 0.003 : 0.0
priceActionFilterEnabled = input.bool(true, title="Enable Price Action Filter")
candleBodyStrengthFilter = input.bool(true, title="Enable Candle Body Strength Filter")
rsiCrossoverFilter = input.bool(true, title="Use RSI Crossover Entry")
macdFlexibleConfirm = input.bool(true, title="MACD Flexible Confirmation (Last 2 Bars)")
// === INDICATORS ===
ema = ta.ema(close, emaPeriod)
rsi = ta.rsi(rsiSource, rsiPeriod)
= ta.macd(close, macdShort, macdLong, macdSignal)
atr = ta.atr(14)
volumeMA = ta.sma(volume, volumeWindow)
// === TREND CONDITIONS ===
uptrend = close > ema
downtrend = close < ema
// === RSI ENTRY CONDITIONS ===
rsiLongCrossover = ta.crossover(rsi, 45)
rsiShortCrossover = ta.crossunder(rsi, 55)
rsiLongZone = rsi < 50
rsiShortZone = rsi > 50
// === MACD FLEXIBLE CONDITIONS ===
macdBullish = histLine > 0 and histLine < 0
macdBearish = histLine < 0 and histLine > 0
macdBullishConfirm = macdBullish or (histLine > 0 and histLine > 0)
macdBearishConfirm = macdBearish or (histLine < 0 and histLine < 0)
// === FILTER CONDITIONS ===
volCondition = filterMode == "None" or volume > volumeMA
atrCondition = filterMode == "None" or (atr / close) > atrThreshold
insideBar = high <= high and low >= low
priceActionValid = not priceActionFilterEnabled or not insideBar or volume > volumeMA
body = math.abs(close - open)
candleRange = high - low
strongBody = body > (candleRange * 0.5)
candleStrengthValid = not candleBodyStrengthFilter or strongBody
// === ENTRY CONDITIONS ===
longCondition = uptrend and
(rsiCrossoverFilter ? rsiLongCrossover : rsiLongZone) and
(macdFlexibleConfirm ? macdBullishConfirm : macdBullish) and
volCondition and atrCondition and priceActionValid and candleStrengthValid
shortCondition = downtrend and
(rsiCrossoverFilter ? rsiShortCrossover : rsiShortZone) and
(macdFlexibleConfirm ? macdBearishConfirm : macdBearish) and
volCondition and atrCondition and priceActionValid and candleStrengthValid
// === ALERTS ===
alertcondition(longCondition, title="Long Signal", message="🚀 Long Setup Confirmed on {{ticker}} @ {{close}} (4H). SL and TP levels plotted.")
alertcondition(shortCondition, title="Short Signal", message="📉 Short Setup Confirmed on {{ticker}} @ {{close}} (4H). SL and TP levels plotted.")
// === PERSISTENT TP/SL STORAGE ===
var float longSL = na
var float longTP3 = na
var float longTP5 = na
var float shortSL = na
var float shortTP3 = na
var float shortTP5 = na
if (longCondition)
longSL := close - atr * atrMultiplier
longTP3 := close + (close - longSL) * 3
longTP5 := close + (close - longSL) * 5
if (shortCondition)
shortSL := close + atr * atrMultiplier
shortTP3 := close - (shortSL - close) * 3
shortTP5 := close - (shortSL - close) * 5
// === PLOTTING PERSISTENT LEVELS ===
plot(longSL, title="Long SL", color=color.red, linewidth=1, style=plot.style_linebr)
plot(longTP3, title="Long TP 3:1", color=color.green, linewidth=1, style=plot.style_linebr)
plot(longTP5, title="Long TP 5:1", color=color.green, linewidth=2, style=plot.style_linebr)
plot(shortSL, title="Short SL", color=color.red, linewidth=1, style=plot.style_linebr)
plot(shortTP3, title="Short TP 3:1", color=color.green, linewidth=1, style=plot.style_linebr)
plot(shortTP5, title="Short TP 5:1", color=color.green, linewidth=2, style=plot.style_linebr)
// === TP/SL LABELS ===
if (longCondition)
label.new(bar_index, longSL, text="Long SL", style=label.style_label_down, color=color.red, textcolor=color.white)
label.new(bar_index, longTP3, text="TP 3:1", style=label.style_label_up, color=color.green, textcolor=color.white)
label.new(bar_index, longTP5, text="TP 5:1", style=label.style_label_up, color=color.green, textcolor=color.white)
if (shortCondition)
label.new(bar_index, shortSL, text="Short SL", style=label.style_label_up, color=color.red, textcolor=color.white)
label.new(bar_index, shortTP3, text="TP 3:1", style=label.style_label_down, color=color.green, textcolor=color.white)
label.new(bar_index, shortTP5, text="TP 5:1", style=label.style_label_down, color=color.green, textcolor=color.white)
// === PLOT SIGNALS ===
plotshape(longCondition, title="Long Entry", location=location.belowbar, color=color.green, style=shape.triangleup, size=size.small)
plotshape(shortCondition, title="Short Entry", location=location.abovebar, color=color.red, style=shape.triangledown, size=size.small)

Levels Of Interest ✨------------------------------------------------------------------------------------
LEVELS OF INTEREST ✨ (LOI)
TRADING INDICATOR GUIDE
------------------------------------------------------------------------------------
Table of Contents:
1. Indicator Overview & Core Functionality
2. VWAP Foundation & Historical Context
3. Multi-Timeframe VWAP Analysis
4. Moving Average Integration System
5. Trend Direction Signal Detection
6. Visual Design & Display Features
7. Custom Level Integration
8. Repaint Protection Technology
9. Practical Trading Applications
10. Setup & Configuration Recommendations
------------------------------------------------------------------------------------
1. INDICATOR OVERVIEW & CORE FUNCTIONALITY
------------------------------------------------------------------------------------
The LOI indicator combines multiple VWAP calculations with moving averages across different timeframes. It's designed to show where institutional money is flowing and help identify key support and resistance levels that actually matter in today's markets.
Primary Functions:
- Multi-timeframe VWAP analysis (Daily, Weekly, Monthly, Yearly)
- Advanced moving average integration (EMA, SMA, HMA)
- Real-time trend direction detection
- Institutional flow analysis
- Dynamic support/resistance identification
Target Users: Day traders, swing traders, position traders, and institutional analysts seeking comprehensive market structure analysis.
------------------------------------------------------------------------------------
2. VWAP FOUNDATION & HISTORICAL CONTEXT
------------------------------------------------------------------------------------
Historical Development: VWAP started in the 1980s when big institutional traders needed a way to measure if they were getting good fills on their massive orders. Unlike regular price averages, VWAP weighs each price by the volume traded at that level. This makes it incredibly useful because it shows you where most of the real money changed hands.
Mathematical Foundation: The basic math is simple: you take each price, multiply it by the volume at that price, add them all up, then divide by total volume. What you get is the true "average" price that reflects actual trading activity, not just random price movements.
Formula: VWAP = Σ(Price × Volume) / Σ(Volume)
Where typical price = (High + Low + Close) / 3
Institutional Behavior Patterns:
- When price trades above VWAP, institutions often look to sell
- When it's below, they're usually buying
- Creates natural support and resistance that you can actually trade against
- Serves as benchmark for execution quality assessment
------------------------------------------------------------------------------------
3. MULTI-TIMEFRAME VWAP ANALYSIS
------------------------------------------------------------------------------------
Core Innovation: Here's where LOI gets interesting. Instead of just showing daily VWAP like most indicators, it displays four different timeframes simultaneously:
**Daily VWAP Implementation**:
- Resets every morning at market open
- Provides clearest picture of intraday institutional sentiment
- Primary tool for day trading strategies
- Most responsive to immediate market conditions
**Weekly VWAP System**:
- Resets each Monday (or first trading day)
- Smooths out daily noise and volatility
- Perfect for swing trades lasting several days to weeks
- Captures weekly institutional positioning
**Monthly VWAP Analysis**:
- Resets at beginning of each calendar month
- Captures bigger institutional rebalancing at month-end
- Fund managers often operate on monthly mandates
- Significant weight in intermediate-term analysis
**Yearly VWAP Perspective**:
- Resets annually for full-year institutional view
- Shows long-term institutional positioning
- Where pension funds and sovereign wealth funds operate
- Critical for major trend identification
Confluence Zone Theory: The magic happens when multiple VWAP levels cluster together. These confluence zones often become major turning points because different types of institutional money all see value at the same price.
------------------------------------------------------------------------------------
4. MOVING AVERAGE INTEGRATION SYSTEM
------------------------------------------------------------------------------------
Multi-Type Implementation: The indicator includes three types of moving averages, each with its own personality and application:
**Exponential Moving Averages (EMAs)**:
- React quickly to recent price changes
- Displayed as solid lines for easy identification
- Optimal performance in trending market conditions
- Higher sensitivity to current price action
**Simple Moving Averages (SMAs)**:
- Treat all historical data points equally
- Appear as dashed lines in visual display
- Slower response but more reliable in choppy conditions
- Traditional approach favored by institutional traders
**Hull Moving Averages (HMAs)**:
- Newest addition to the system (dotted line display)
- Created by Alan Hull in 2005
- Solves classic moving average dilemma: speed vs. accuracy
- Manages to be both responsive and smooth simultaneously
Technical Innovation: Alan Hull's solution addresses the fundamental problem where moving averages are either too slow (missing moves) or too fast (generating false signals). HMAs achieve optimal balance through weighted calculation methodology.
Period Configuration:
- 5-period: Short-term momentum assessment
- 50-period: Intermediate trend identification
- 200-period: Long-term directional confirmation
------------------------------------------------------------------------------------
5. TREND DIRECTION SIGNAL DETECTION
------------------------------------------------------------------------------------
Real-Time Momentum Analysis: One of LOI's best features is its real-time trend detection system. Next to each moving average, visual symbols provide immediate trend assessment:
Symbol System:
- ▲ Rising average (bullish momentum confirmation)
- ▼ Falling average (bearish momentum indication)
- ► Flat average (consolidation or indecision period)
Update Frequency: These signals update in real-time with each new price tick and function across all configured timeframes. Traders can quickly scan daily and weekly trends to assess alignment or conflicting signals.
Multi-Timeframe Trend Analysis:
- Simultaneous daily and weekly trend comparison
- Immediate identification of trend alignment
- Early warning system for potential reversals
- Momentum confirmation for entry decisions
------------------------------------------------------------------------------------
6. VISUAL DESIGN & DISPLAY FEATURES
------------------------------------------------------------------------------------
Color Psychology Framework: The color scheme isn't random but based on psychological associations and trading conventions:
- **Blue Tones**: Institutional neutrality (VWAP levels)
- **Green Spectrum**: Growth and stability (weekly timeframes)
- **Purple Range**: Longer-term sophistication (monthly analysis)
- **Orange Hues**: Importance and attention (yearly perspective)
- **Red Tones**: User-defined significance (custom levels)
Adaptive Display Technology: The indicator automatically adjusts decimal places based on the instrument you're trading. High-priced stocks show 2 decimals, while penny stocks might show 8. This keeps the display incredibly clean regardless of what you're analyzing - no cluttered charts or overwhelming information overload.
Smart Labeling System: Advanced positioning algorithm automatically spaces all elements to prevent overlap, even during extreme zoom levels or multiple timeframe analysis. Every level stays clearly readable without any visual chaos disrupting your analysis.
------------------------------------------------------------------------------------
7. CUSTOM LEVEL INTEGRATION
------------------------------------------------------------------------------------
User-Defined Level System: Beyond the calculated VWAP and moving average levels, traders can add custom horizontal lines at any price point for personalized analysis.
Strategic Applications:
- **Psychological Levels**: Round numbers, previous significant highs/lows
- **Technical Levels**: Fibonacci retracements, pivot points
- **Fundamental Targets**: Analyst price targets, earnings estimates
- **Risk Management**: Stop-loss and take-profit zones
Integration Features:
- Seamless incorporation with smart labeling system
- Custom color selection for visual organization
- Extension capabilities across all chart timeframes
- Maintains display clarity with existing indicators
------------------------------------------------------------------------------------
8. REPAINT PROTECTION TECHNOLOGY
------------------------------------------------------------------------------------
Critical Trading Feature: This addresses one of the most significant issues in live trading applications. Most multi-timeframe indicators "repaint," meaning they display different signals when viewing historical data versus real-time analysis.
Protection Benefits:
- Ensures every displayed signal could have been traded when it appeared
- Eliminates discrepancies between historical and live analysis
- Provides realistic performance expectations
- Maintains signal integrity across chart refreshes
Configuration Options:
- **Protection Enabled**: Default setting for live trading
- **Protection Disabled**: Available for backtesting analysis
- User-selectable toggle based on analysis requirements
- Applies to all multi-timeframe calculations
Implementation Note: With protection enabled, signals may appear one bar later than without protection, but this ensures all signals represent actionable opportunities that could have been executed in real-time market conditions.
------------------------------------------------------------------------------------
9. PRACTICAL TRADING APPLICATIONS
------------------------------------------------------------------------------------
**Day Trading Strategy**:
Focus on daily VWAP with 5-period moving averages. Look for bounces off VWAP or breaks through it with volume. Short-term momentum signals provide entry and exit timing.
**Swing Trading Approach**:
Weekly VWAP becomes your primary anchor point, with 50-period averages showing intermediate trends. Position sizing based on weekly VWAP distance.
**Position Trading Method**:
Monthly and yearly VWAP provide broad market context, while 200-period averages confirm long-term directional bias. Suitable for multi-week to multi-month holdings.
**Multi-Timeframe Confluence Strategy**:
The highest-probability setups occur when daily, weekly, and monthly VWAPs cluster together, especially when multiple moving averages confirm the same direction. These represent institutional consensus zones.
Risk Management Integration:
- VWAP levels serve as dynamic stop-loss references
- Multiple timeframe confirmation reduces false signals
- Institutional flow analysis improves position sizing decisions
- Trend direction signals optimize entry and exit timing
------------------------------------------------------------------------------------
10. SETUP & CONFIGURATION RECOMMENDATIONS
------------------------------------------------------------------------------------
Initial Configuration: Start with default settings and adjust based on individual trading style and market focus. Short-term traders should emphasize daily and weekly timeframes, while longer-term investors benefit from monthly and yearly level analysis.
Transparency Optimization: The transparency settings allow clear price action visibility while maintaining level reference points. Most traders find 70-80% transparency optimal - it provides a clean, unobstructed view of price movement while maintaining all critical reference levels needed for analysis.
Integration Strategy: Remember that no indicator functions effectively in isolation. LOI provides excellent context for institutional flow and trend direction analysis, but should be combined with complementary analysis tools for optimal results.
Performance Considerations:
- Multiple timeframe calculations may impact chart loading speed
- Adjust displayed timeframes based on trading frequency
- Customize color schemes for different market sessions
- Regular review and adjustment of custom levels
------------------------------------------------------------------------------------
FINAL ANALYSIS
------------------------------------------------------------------------------------
Competitive Advantage: What makes LOI different is its focus on where real money actually trades. By combining volume-weighted calculations with multiple timeframes and trend detection, it cuts through market noise to show you what institutions are really doing.
Key Success Factor: Understanding that different timeframes serve different purposes is essential. Use them together to build a complete picture of market structure, then execute trades accordingly.
The integration of institutional flow analysis with technical trend detection creates a comprehensive trading tool that addresses both short-term tactical decisions and longer-term strategic positioning.
------------------------------------------------------------------------------------
END OF DOCUMENTATION
------------------------------------------------------------------------------------

New York Session HighlightIt Plots New York's Trading zone. It will help in marking previous day high and low of New York Session

PriceLevels GB🚨 NEW INDICATOR: GOLDBACH LEVELS
In a market ruled by speed, algorithms, and hidden logic...
Goldbach Levels reveals 5 numbers that aren’t random:
35 – 29 – 71 – 11 – 65
Selected for a reason.
These are Goldbach numbers, deeply tied to algorithmic market behavior.
This free indicator automatically marks key price levels where these numbers occur — levels that align with the extremes of trading algorithms.
What does this mean?
These are levels where price tends to hesitate, react, or reverse.
🛠️ Full customization included: highlight only the levels you care about, tailored to your strategy.
📌 Follow us on TradingView for more custom tools and next-level strategies!!!

Schmit Trading LiquidityDescription
Schmit Trading Liquidity Marker automatically spots and labels open liquidity sweep levels by detecting classic stop-run patterns (Bull→Bear for highs, Bear→Bull for lows) across multiple timeframes. Lines are drawn exactly at the wick of the triggering candle and removed as soon as price “sweeps” through them, keeping your chart clean and focused on live levels only.
How It Works
1. Pattern Detection
• Liquidity High: When a bullish candle is immediately followed by a bearish candle (Bull→Bear), the script records the higher of the two wicks.
• Liquidity Low: When a bearish candle is immediately followed by a bullish candle (Bear→Bull), the script records the lower of the two wicks.
2. Multi-Timeframe Support
• Choose up to six timeframes (5 min, 15 min, 30 min, 1 h, 4 h, daily) via checkboxes.
• Each timeframe is evaluated independently, and liquidity levels are drawn on your current chart.
3. Precision Wick Placement
• Lines start at bar_index – 1 so they align exactly with the wick of the signal candle, regardless of your chart’s timeframe.
4. Automatic Cleanup
• As soon as price closes beyond a drawn line (sweep), that line is deleted automatically.
Inputs
Input Name Description
Show 5 min. Enable liquidity detection on the 5-minute timeframe.
Show 15 min. Enable liquidity detection on the 15-minute timeframe.
Show 30 min. Enable liquidity detection on the 30-minute timeframe.
Show 1 h. Enable liquidity detection on the 1-hour timeframe.
Show 4 h. Enable liquidity detection on the 4-hour timeframe.
Show 1 D. Enable liquidity detection on the daily timeframe.
High Line Color. Color of Bull→Bear (liquidity high) lines (default: red).
Low Line Color. Color of Bear→Bull (liquidity low) lines (default: blue).
Line Length. How many bars each liquidity line extends to the right.
Usage Tips
• Focus on Live Zones: Combine with volume or order-flow tools to confirm genuine
liquidity sweeps.
• Multiple TFs: Enable higher timeframes for major liquidity clusters; lower timeframes
for fine‐tuning entries.
• Chart Cleanliness: Lines self‐delete on sweep, ensuring no manual cleanup is needed.
⸻
Disclosure & License
This indicator is Open-Source under the Mozilla Public License 2.0. Feel free to review, adapt, and improve the code. No performance guarantees—use responsibly and backtest any strategy before trading live.

OBOB_With_Time4 – Smart Order Blocks + Time-Based Labels + Auto-Cleanup + Liquidity Zones
This indicator combines:
Fractal-based Order Block detection
Dynamic and Static Liquidity Zones
Time-based label calculations (Sum, Difference, Minutes)
Auto-removal of broken Order Blocks (custom feature)
🔹 Key features:
Detects bullish and bearish OBs using 3-bar or 5-bar fractals
OBs are automatically deleted once broken, helping keep charts clean and focused – a major improvement over the original implementation
Optional FVG validation for higher OB quality
Includes time-based label logic for bar/session timing analysis
Customizable line styles, widths, label positions, and time offsets
Displays swing highs/lows and fractal points
🛠 Fully customizable:
Select which fractal type to use
Enable/disable time logic elements
Adjust OB/FVG filtering
Fine-tune liquidity sensitivity
📌 Credits:
Liquidity detection uses open-source logic from 's LiquidityFinderLibrary.
This version significantly extends the original logic by adding automated cleanup of broken order blocks, new visualization options, and integrated time analytics.
Developed and expanded by @Nephew_Sam_
🔓 This script is open-source and published for educational and strategic use on TradingView.

Simple Entry Signals (Confirmed)//@version=5
indicator("Simple Entry Signals (Confirmed)", overlay=true)
// إعدادات المتوسطات
emaFast = ta.ema(close, 8)
emaSlow = ta.ema(close, 21)
// إشارات الدخول
buySignal = ta.crossover(emaFast, emaSlow) and close > close
sellSignal = ta.crossunder(emaFast, emaSlow) and close < close
// رسم الأسهم على الشارت
plotshape(buySignal, title="Call Entry", location=location.belowbar, color=color.green, style=shape.labelup, text="CALL")
plotshape(sellSignal, title="Put Entry", location=location.abovebar, color=color.red, style=shape.labeldown, text="PUT")

Ben Multipls Moving Average V1Script allows for the charting of multiple moving averages. This is a work in progress

Strategy with DI+/DI-, ADX, RSI, MACD, EMA + Time Stop [FAILED]I built this strategy combining trend strength (ADX, DI+/DI-), momentum (MACD, RSI), candle filters, and EMA direction with a time-based stop and fixed SL/TP.
Backtested on BTCUSDT (5-min) from Jan–Apr 2023 using TradingView Premium’s deep data.
🟥 Results:
• 5 trades, 0 wins
• -14.45% total P&L
• All trades hit stop-loss (1.5%)
• Profit factor: 0.00
Despite logical layering, the entry timing didn’t capture profitable moves. Possibly overfiltered or too delayed.
💡 Sharing this for transparency and learning. Not every test wins — but every test teaches. On to the next.

Crypto Long RSI Entry with AveragingIndicator Name:
04 - Crypto Long RSI Entry with Averaging + Info Table + Lines (03 style lines)
Description:
This indicator is designed for crypto trading on the long side only, using RSI-based entry signals combined with a multi-step averaging strategy and a visual information panel. It aims to capture price rebounds from oversold RSI levels and manage position entries with two staged averaging points, optimizing the average entry price and take-profit targets.
Key Features:
RSI-Based Entry: Enters a long position when the RSI crosses above a defined oversold level (default 25), with an optional faster entry if RSI crosses above 20 after being below it.
Two-Stage Averaging: Allows up to two averaging entries at user-defined price drop percentages (default 5% and 14%), increasing position size to improve average entry price.
Dynamic Take Profit: Adjusts take profit targets after each averaging stage, with customizable percentage levels.
Visual Signals: Marks entries, averaging points, and exits on the chart using colored labels and lines for easy tracking.
Info Table: Displays current trade status, averaging stages, total profit, number of wins, and maximum drawdown percentage in a table on the chart.
Graphical Lines: Shows horizontal lines for entry price, take profit, and averaging prices to visually track trade management.

Quant Trading Zero Lag Trend Signals (MTF) Strategy🧠 Strategy Overview
The Quant Trading Zero Lag Trend Signals (MTF) Strategy is a high-precision, multi-timeframe trend-following system designed for traders seeking early trend entries and intelligent exits. Built around ZLEMA-based signal detection, it includes dynamic risk management features. Based on the original indicator Zero Lag Trend Signals (MTF) from AlgoAlpha, now built as a strategy with several improvements for Exit Criteria include RR, ATR Stop Loss, Trailing stop loss, etc. See below.
🔍 Key Components
1️⃣ ZLEMA Trend Engine
ZLEMA (Zero-Lag EMA) forms the foundation of the trend signal system.
Detects bullish and bearish momentum by analyzing price action crossing custom ZLEMA bands.
Optional confirmation using 5-bar ZLEMA slope filters (up/down trends) ensures high-conviction entries.
2️⃣ Volatility-Based Signal Bands
Dynamic bands are calculated using ATR (volatility) stretched over 3× period length.
These bands define entry zones (outside the bands) and trend strength.
Price crossing above/below the bands triggers trend change detection.
3️⃣ Entry Logic
Primary long entries occur when price crosses above the upper ZLEMA band.
Short entries (optional) trigger on downside cross under the lower band.
Re-entry logic allows continuation trades during strong trends.
Filters include date range, ZLEMA confirmation, and previous position state.
4️⃣ Exit Logic & Risk Management
Supports multiple customizable exit mechanisms:
🔺 Stop-Loss & Take-Profit
ATR-Based SL/TP: Uses ATR multipliers to dynamically set levels based on volatility.
Fixed Risk-Reward TP: Targets profit based on predefined RR ratios.
Break-Even Logic: Automatically moves SL to entry once a threshold RR is hit.
EMA Exit: Optional trailing exit based on price vs. short EMA.
🔀 Trailing Stop
Follows price action using a trailing ATR-based buffer that tightens with trend movement.
🔁 Trend-Based Exit
Automatically closes positions when the detected trend reverses.
5️⃣ Multi-Option Trade Filtering
Enable/disable short trades, ZLEMA confirmations, re-entries, etc.
Time-based backtesting filters for isolating performance within custom periods.
6️⃣ Visual Feedback & Annotations
Trend shading overlays: Green for bullish, red for bearish zones.
Up/Down triangle markers show when ZLEMA is rising/falling for 5 bars.
Stop-loss, TP, trailing lines drawn dynamically on the chart.
Floating stats table displays live performance (PnL, win %, GOA, drawdown, etc.).
Trade log labels annotate closed trades with entry/exit, duration, and reason.
7️⃣ CSV Export Integration
Seamless export of trade data including:
Entry/exit prices
Bars held
Encoded exit reasons
Enables post-processing or integration with external optimizers.
⚙️ Configurable Parameters
All key elements are customizable:
Entry band length and multiplier
ATR lengths, multipliers, TP/SL, trailing stop, break-even
Profit target RR ratio
Toggle switches for confirmations, trade types, and exit methods


Candle PercentageThis simple code displays the percentage change of each candle on top of the candle.
The treshhold for display can be adjusted as required.

FXC Candle strategyFXC Engulfing candlestick patterns are comprised of three bars on a price chart. They are used to indicate a market reversal. The third candlestick will be much larger than the first and second, so that it completely covers or 'engulfs' the length of the previous bars
