Trailing STOP based on ATR with Offset, SMA, and RMATrailing STOP based on Average True Range (ATR)
Start with Multiplier = 2 and Offset = 1
Indicators and strategies

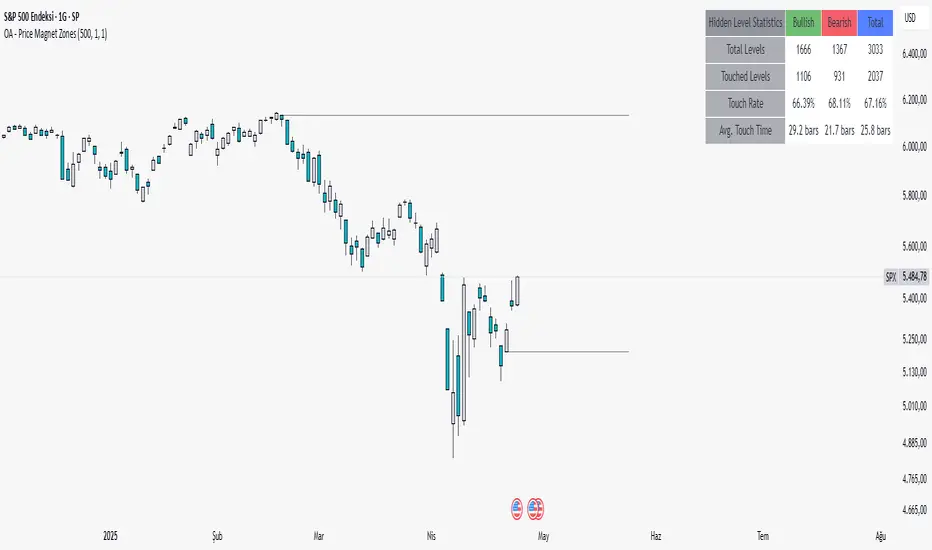
OA - Price Magnet Zones Price Magnet Zones Indicator
Overview
The Price Magnet Zones indicator identifies special price levels that have a high statistical probability of being revisited by price in the future.
It works by detecting candles with specific formation characteristics - those without top or bottom wicks - which often signify important market levels that price tends to return to.
Key Features
Automated Detection: Identifies special candle formations automatically and draws horizontal lines at these levels
Dynamic Management Removes lines once price touches them or when they exceed the lookback period
Statistical Analysis: Tracks touch rates and average time until price returns to these levels
Clean Visual Interface: Shows only untouched levels for a clear chart view
How It Works
The indicator detects two specific types of candle formations:
Bullish Levels: Candles with no bottom wick (open = low) that close higher
Bearish Levels: Candles with no top wick (open = high) that close lowe
These formations often represent hidden liquidity zones or order blocks where price tends to return. The indicator draws horizontal lines at these levels and tracks whether price revisits them.
Statistics Tracking
The indicator maintains comprehensive statistics about the detected levels:
Total Levels: Number of bullish, bearish, and total levels detected
Touched Levels: Number of levels that price has returned to touch
Touch Rate: Percentage of levels that have been touched by price
Average Touch Time: Average number of bars until price touches each level type
Trading Applications
These hidden levels can be valuable for:
Identifying potential support and resistance zones
Finding entry and exit points for trades
Setting stop loss levels
Determining price targets
Confirming other technical signals
Settings
Max Bars to Track: Maximum number of bars to keep tracking a level (default: 500)
Line Thickness: Visual thickness of the horizontal lines (1-4)
Line Color: Color of the horizontal lines
Min Candles Before Check: Number of candles to wait before including touches in statistics (default: 3)
Show Statistics: Toggle statistics table display
Usage Tips
The statistics only count touches that occur after the specified minimum number of candles have passed, providing more meaningful data
Higher touch rates indicate stronger magnetic properties of these levels
The average touch time can help with timing expectations for trades
These levels work across various timeframes and markets
For best results, use alongside other technical analysis tools
This indicator does not provide trading signals but offers valuable insights into hidden market structure that can enhance your trading strategy.

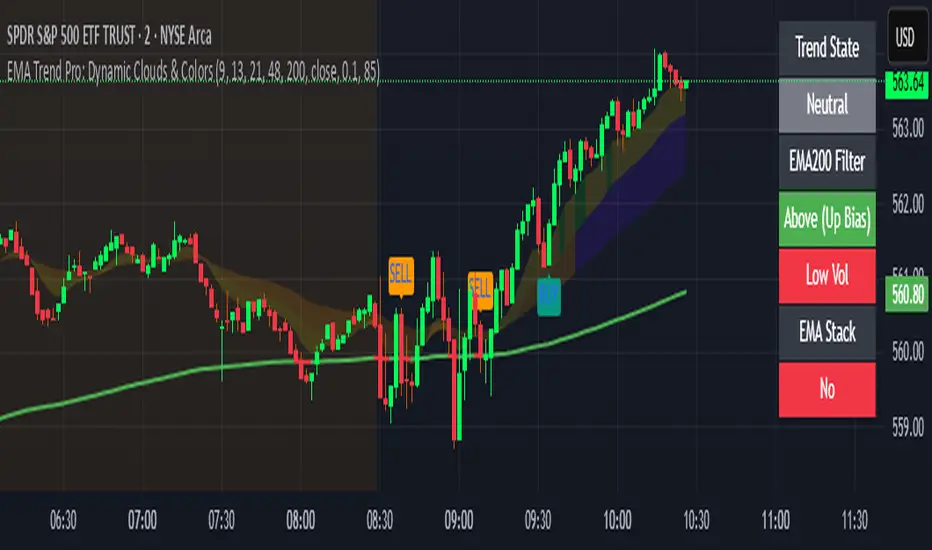
EMA Trend Pro: Dynamic Clouds & ColorsEMA Trend Pro is your ultimate trend companion, built for traders who want clarity, precision, and confidence in their entries.
This script fuses dynamic EMA cloud zones with breakout and pullback signals — giving you real-time insights into market structure and momentum. Whether you're trading crypto, forex, stocks, or futures, EMA Trend Pro adapts to your style.
🔧 Key Features:
✅ EMA Stack Clouds with Folding Sensitivity (9/21/48/200)
✅ Bullish / Bearish trend labels with real-time dashboard
✅ Volume strength analysis (High, Normal, Low)
✅ Breakout signal alerts (momentum-based)
✅ Pullback signal alerts (trend resumption)
✅ Fully customizable: EMA lengths, signal visibility, cloud opacity
✅ Works across all assets and timeframes
🛠️ Designed for scalping, swing trading, and intraday setups.
🔔 Built-in alerts make automation seamless — no guesswork.
💡 Usage Tips:
Use clouds and trend labels to identify structure and bias
Trade breakouts when EMAs align and volume confirms
Look for pullbacks into the EMA zone and enter on resumption
📅 Market Hours Filter: Keeps signals relevant during core trading hours (9:30 AM–4 PM ET).
👤 Developed by @glapougbaegarmondeh
🧠 Version 1.0 | 📆 Released: April 24, 2025
Dow Trend with MA FilterThis is a modification of a very clever Dow Theory script by Mohit_Kakkar08. I found the logic to be great but the visual to be distracting due to lack of user control. The original uses dow theory to define every single bar as an up, down, or outside bar. Fantastic. This mod plots only when the status changes and allows full control over arrows, stop loss plots, etc. Also added a filter by 2 MAs if you want to lessen the signals. The filter will only show up arrows if they are below the MA and only show down arrows if they are above the MA (none, one MA, or both as a filter). Also extended the MTF table to 8 spots...

EMA Ribbon Cross Multi-TF MonitorThis is not your typical moving average, this give you a great buy and sell alert alongside showing you what price is doing at the 1m and 2m charts with a monitor that updates with price.
The EMA is configurable though I recommend the 2 and 8 ema's as the best ones to catch price moving higher or lower to get an early entry.
You can configure the script to add in different times and it will work on those time frames also, like 15min and 30min so you can see the longer trend of the market.

CyberCandle SwiftEdgeCyberCandle SwiftEdge
Overview
CyberCandle SwiftEdge is a cutting-edge, AI-inspired trading indicator designed for traders seeking precision and clarity in trend-following and swing trading. Powered by SwiftEdge, it combines Heikin Ashi candles, a gradient-colored Exponential Moving Average (EMA), and a Relative Strength Index (RSI) to deliver clear buy and sell signals. Featuring glowing visuals, dynamic signal icons, and a customizable RSI dashboard in the top-right corner, this script offers a futuristic interface for identifying high-probability trade setups on various timeframes (e.g., 1H, 4H).
What It Does
CyberCandle SwiftEdge integrates three powerful components to generate actionable trading signals:
Heikin Ashi Candles: Smooths price action to highlight trends, reducing market noise and making reversals easier to spot.
Gradient EMA: A 100-period EMA with dynamic color transitions (blue/cyan for uptrends, red/pink for downtrends) to confirm market direction.
RSI Dashboard: A neon-lit display showing RSI levels, indicating overbought (>70), oversold (<30), or neutral (30-70) conditions.
Buy and sell signals are marked with prominent, glowing icons (triangles and arrows) based on trend direction, momentum, and specific Heikin Ashi patterns. The script’s customizable parameters allow traders to tailor the strategy to their preferences, balancing signal frequency and precision.
How It Works
The strategy leverages the synergy of Heikin Ashi, EMA, and RSI to filter trades and highlight opportunities:
Trend Direction: The price must be above the EMA for buy signals (bullish trend) or below for sell signals (bearish trend). The EMA’s gradient color shifts based on its slope, visually reinforcing trend strength.
Momentum Confirmation: RSI must exceed a user-defined threshold (default: 50) for buy signals or fall below it for sell signals, ensuring momentum supports the trade.
Candle Patterns: Buy signals require a green Heikin Ashi candle (close > open), with the two prior candles having minimal upper wicks (≤5% of candle body) and being red (indicating a retracement). Sell signals require a red candle, minimal lower wicks, and two prior green candles.
RSI Dashboard: Positioned in the top-right corner, it features a glowing circle (red for overbought, green for oversold, blue for neutral), the current RSI value, and a status indicator (triangle for extremes, square for neutral). This provides instant momentum insights without cluttering the chart.
By combining Heikin Ashi’s trend clarity, EMA’s directional filter, and RSI’s momentum validation, CyberCandle SwiftEdge minimizes false signals and highlights trades with strong potential. Its vibrant, AI-like visuals make it easy to interpret at a glance.
How to Use It
Add to Chart: In TradingView, search for "CyberCandle SwiftEdge" and add it to your chart. Set the chart to Heikin Ashi candles for optimal compatibility.
Interpret Signals:
Buy Signal: Large green triangles and arrows appear below candles when the price is above the EMA, RSI is above the buy threshold (default: 50), and conditions for a bullish retracement are met. Consider entering a long position with a 1:2 risk/reward ratio.
Sell Signal: Large red triangles and arrows appear above candles when the price is below the EMA, RSI is below the sell threshold (default: 50), and conditions for a bearish retracement are met. Consider entering a short position.
RSI Dashboard: Monitor the top-right dashboard. A red circle (RSI > 70) suggests caution for buys, a green circle (RSI < 30) indicates potential buying opportunities, and a blue circle (RSI 30-70) signals neutrality.
Customize Parameters: Open the indicator’s settings to adjust:
EMA Length (default: 100): Increase (e.g., 200) for longer-term trends or decrease (e.g., 50) for shorter-term sensitivity.
RSI Length (default: 14): Adjust for more (e.g., 7) or less (e.g., 21) responsive momentum signals.
RSI Buy/Sell Thresholds (default: 50): Set higher (e.g., 55) for buys or lower (e.g., 45) for sells to require stronger momentum.
Wick Tolerance (default: 0.05): Increase (e.g., 0.1) to allow larger wicks, generating more signals, or decrease (e.g., 0.02) for stricter conditions.
Require Retracement (default: true): Disable to remove the two-candle retracement requirement, increasing signal frequency.
Trading: Use signals in conjunction with the RSI dashboard and market context. For example, avoid buy signals if the RSI dashboard is red (overbought). Always apply proper risk management, such as setting stop-losses based on recent lows/highs.
What Makes It Original
CyberCandle SwiftEdge stands out due to its futuristic, AI-inspired visual design and user-friendly customization:
Neon Aesthetics: Glowing Heikin Ashi candles, gradient EMA, and dynamic signal icons (triangles and arrows) with RSI-driven transparency create a high-tech, immersive experience.
RSI Dashboard: A compact, top-right display with a neon circle, RSI value, and adaptive status indicator (triangle/square) provides instant momentum insights without cluttering the chart.
Customizability: Users can fine-tune EMA length, RSI parameters, wick tolerance, and retracement requirements via TradingView’s settings, balancing signal frequency and precision.
Integrated Approach: The synergy of Heikin Ashi’s trend clarity, EMA’s directional strength, and RSI’s momentum validation offers a cohesive strategy that reduces false signals.
Why This Combination?
The script combines Heikin Ashi, EMA, and RSI for a complementary effect:
Heikin Ashi smooths price fluctuations, making it ideal for identifying sustained trends and retracements, which are critical for the strategy’s signal logic.
EMA provides a reliable trend filter, ensuring signals align with the broader market direction. Its gradient color enhances visual trend recognition.
RSI adds momentum context, confirming that signals occur during favorable conditions (e.g., RSI > 50 for buys). The dashboard makes RSI intuitive, even for non-technical users.
Together, these components create a balanced system that captures trend reversals after retracements, validated by momentum, with a visually engaging interface that simplifies decision-making.
Tips
Best used on volatile assets (e.g., BTC/USD, EUR/USD) and higher timeframes (1H, 4H) for clearer trends.
Experiment with parameters in the settings to match your trading style (e.g., increase wick tolerance for more signals).
Combine with other analysis (e.g., support/resistance) for higher-confidence trades.
Note
This indicator is for informational purposes and does not guarantee profits. Always backtest and use proper risk management before trading.


cktraderpro session high lowCK Session Tracker – Global Market Session Levels
The CK Session Tracker is a precision-built TradingView indicator designed to map out the most critical times in the market — the Asia, EU, and US sessions. This tool automatically plots the open, close, high, and low of each major session, giving traders a crystal-clear view of market structure, key liquidity zones, and session-based momentum shifts.
🔍 Features:
🕒 Automatic Session Markers – Visualize the exact open and close times of Asia, Europe, and US sessions directly on your chart.
📈 Session Highs & Lows – Instantly spot where price reacted during each session, helping identify breakouts, reversals, or liquidity grabs.
🌐 Global Market Awareness – Designed to adapt to futures, forex, and crypto across all time zones.
🎯 Smart Trading Zones – Use session data to pinpoint high-probability setups during overlaps or session handoffs.
Perfect for intraday traders, ICT strategy followers, and anyone focused on session-based movement. The CK Session Tracker gives you the edge of institutional timing — all on one chart.

Top & Bottom Search ~ Experimental Top & Bottom Search ~ Experimental
This script is designed to identify potential market reversal zones using a combination of classic candlestick patterns (Piercing Line & Dark Cloud Cover) and trend confirmation tools like EMA positioning and optional RSI filters.
Core Features:
Detects Piercing Line and Dark Cloud Cover patterns.
Optional EMA filter to confirm bullish or bearish alignment.
Optional RSI filter to confirm oversold or overbought conditions.
Visual plot of the selected EMA (customizable thickness & color).
Clean and toggleable inputs for user flexibility.
Customizable Settings:
Enable/disable EMA confirmation.
Enable/disable RSI confirmation.
Choose whether to display the EMA on the chart.
Adjust EMA period, RSI thresholds, and candle visuals.
Note:
This is an experimental tool, best used as a supplement to your existing analysis. Not every signal is a guaranteed reversal—this script aims to highlight potential turning points that deserve closer attention.
I HIGHLY recommend using this in coherence with many other indicators in a robust system of indicators that meet your desired time frames and signal periods.
NOTES*
1.) An alternative way to view this indicator is as a "Piercing & Dark Cloud Candle Indicator/Strategy w/ EMA & RSI Logic - Either EMA or RSI Logics are Optional."
2.) When toggling between the RSI and EMA Filters, the default is set to RSI filter applied, however you cannot have both RSI signals and EMA filters on the chart at the same time, it can only be one or the other. So be aware that if you have EMA filter ON and select RSI filter, it will only be displaying the RSI filtered outputs. The ONLY WAY to see the EMA filtered outputs is to only have the EMA filter box checked and NOT the RIS filter box.
3.) Clarity: The display image above for the indicator is with only the RSI filter setting on. EMA filter is an option as well that I recommend considering when conducting trades/analysis.

Basic/Fractal Engulfing Candle Filtered EMA/ATRBasic/Fractal Engulfing Candle Filtered EMA/ATR
This clean and flexible indicator is designed to highlight high-probability engulfing candle patterns by applying a smart combination of filters based on ATR, EMA, and fractal swing high/low logic.
Engulfing candles are commonly used for spotting potential trend reversals or momentum continuation zones—but without proper filtering, they can produce noise. This script enhances reliability by giving traders control over:
ATR Filter: Limits signals to candles within a specific size range relative to the Average True Range, filtering out excessive volatility.
EMA Filter: Confirms trend direction using an exponential moving average. Engulfing candles are only valid if aligned with or against the EMA depending on user configuration.
Fractal Swing High/Low Filter: Requires engulfing candles to occur near local highs (for bearish setups) or lows (for bullish setups), identifying potential turning points in market structure.
Highlights:
Fully customizable with intuitive inputs
Clean chart visuals with triangle markers for bullish (🟦 aqua) and bearish (🟪 fuchsia) engulfing signals
Adaptive EMA color changes based on price position (above = bullish, below = bearish)
Perfect for traders who want a smarter engulfing candle tool that adapts to market conditions, price structure, and trend confirmation.
*Highly recommend using this in confluence with many other indicators of my own/your liking.
*You can use this very well on memecoins and alt coins, works for trading, swing trading, and long term analysis. Lower time frames recommended.
*includes alerts functionality.

Market Regime Detection – Breakout/down w/ ADX & EMA Filter Market Regime Detection – Breakout/down w/ ADX & EMA Filter
By: alphainvestor123
This indicator helps you visually detect whether the market is in a trending or mean-reverting regime by combining:
Core Logic:
Breakouts: Price exceeds recent highs (or lows), suggesting trending behavior.
EMA Filter: Confirms bullish or bearish bias based on price vs. EMA.
VHF (Vertical Horizontal Filter): Measures the trend strength.
VHF value is multiplied by 1000 in the event you wish to display it onto your
BTC
or Crypto chart, it will be visible on your chart, no need to scroll down to see.
VHF ≥ 3333 = Trending Regime
VHF ≤ 3333 = Mean-Reverting / Rangebound
Key Features:
- Plot of recent high/low breakout levels.
- Background highlights breakout signals (trending market).
- Optional background for breakdown signals (non-trending market).
- Optional VHF and EMA plots for further confirmation.
- Adjustable inputs to control signal sensitivity and chart visuals.
Inputs:
Lookback Periods for breakout/breakdown
EMA Length and Line Thickness
Toggle VHF/EMA/Signal Display
Custom Colors for bullish/bearish trends
Ideal Use Cases:
Determining market regime
Filtering for momentum/trend continuation setups
Avoiding false signals in mean-reverting market conditions
*Best used on 1D chart as seen on the sample display, I find this most useful for detecting long term trend breakouts/breakdowns and mean reverting regimes.
*to clarify:
breakouts/trend regimes can only be marked if:
1. Candle has the highest high out of the last 40 bars (default indicator setting, can be customized by user)
2. EMA on the desired asset is bullish
3. ADX is >= a value of 3,333
Visa versa logic for breakdowns/mean reverting regime detection.

VWAP - CATSsession vwap with % bands and a highlight of every 4th band... because I think those are interesting levels. If you use with my alternating ma red/green background and set that one also to vwap then these 2 scripts play well together otherwise this will just be the big yellow with grey % bands and every 4th one able to be highlighted....

cktraderpro 200 BLASTCK 200 Blast – Multi-Time Frame EMA Overlay
The CK 200 Blast is a powerful TradingView indicator designed exclusively for CK Trader PRO traders who want a clear, multi-timeframe view of the 200 EMA across key trading intervals. This innovative tool overlays the 200 EMA from the 1-minute, 5-minute, 15-minute, and 1-hour timeframes onto a single chart, allowing traders to instantly identify key dynamic support and resistance levels without switching between charts.
Key Features:
✅ Multi-Timeframe 200 EMA Overlay – View the 200 EMA from the 1M, 5M, 15M, and 1H charts on any timeframe.
✅ Dynamic Support & Resistance Zones – Track institutional key levels across multiple timeframes for precise trade execution.
✅ Seamless Integration – Works with any chart, enhancing your market analysis without cluttering your screen.
✅ Trend Confirmation Tool – Identify confluences and trend shifts as price interacts with multiple 200 EMAs.
Whether you trade scalps, intraday setups, or larger swing trades, CK 200 Blast gives you a superior edge by visualizing high-probability reaction zones. Stay ahead of the market with real-time trend awareness, all from a single chart!

cktraderpro LSMA BlastLSMA Multi-Timeframe Indicator
The LSMA Multi-Timeframe Indicator is a powerful tool designed to enhance trend analysis by incorporating Least Squares Moving Average (LSMA) calculations across multiple timeframes. This indicator displays LSMA values from the 1-minute, 5-minute, 15-minute, and 1-hour charts, allowing traders to gain deeper insight into the overall trend structure and potential areas of support or resistance.
By visualizing LSMA across different timeframes, traders can:
✅ Identify Key Support & Resistance – Higher timeframe LSMA levels often act as strong barriers where price reacts.
✅ Enhance Trend Confirmation – A confluence of LSMAs pointing in the same direction strengthens confidence in a trend.
✅ Spot Reversals & Trend Shifts Early – Watching lower timeframe LSMAs in relation to higher ones can signal potential shifts before they fully develop.
This indicator is ideal for traders looking to align short-term entries with longer-term trend dynamics, providing an edge in both intraday and swing trading strategies.

Prev Day High/Low + First 5-Min Candle RangeThis will draw a a line for previous day high and low and will also draw out the high and the low of the first five minute candle of the daytime session.

ONE RING SlimJust 3 nested envelopes tied together with a factor to size them together. You can have them based on various MAs and the envelopes based on % or on a volatility setup I came up with. You can highlight crosses of outside bands and/or midpoints. Mid lines can be colored based on slope. You can shade in various ways. You can highlight freak volume bars, and ranges also. Have basic options for highlight of session and lunch. Have fun.

Horizontal Color BandsJust horizontal bands running across the chart. Choice of 2 colors you pick and the spacing is a percentage of price. The "grid" runs up from a price you choose and also can be dragged around on the chart. Possibly makes trading measured % moves visually clearer....

Smart Market Matrix Smart Market Matrix
This indicator is designed for intraday, scalping, providing automated detection of price pivots, liquidity traps, and breakout confirmations, along with a context dashboard featuring volatility, trend, and volume.
## Summary Description
### Menu Settings & Their Roles
- **Swing Pivot Strength**: Controls the sensitivity for detecting High/Low pivots.
- **Show Pivot Points**: Toggles the display of HH/LL markers on the chart.
- **VWMA Length for Trap Volume** & **Volume Spike Multiplier**: Identify concentrated volume spikes for liquidity traps.
- **Wick Ratio Threshold** & **Max Body Size Ratio**: Detect candles with disproportionate wicks and small bodies (doji-ish) for traps.
- **ATR Length for Trap**: Measures volatility specific to trap detection.
- **VWMA Length for Breakout Volume**, **ATR Multiplier for Breakout**, **ATR Length for Breakout**, **Min Body/Range Ratio**: Set adaptive breakout thresholds based on volatility and volume.
- **OBV Smooth Length**: Smooths OBV momentum for breakout confirmation.
- **Enable VWAP Filter for Confirmations**: Optionally validate breakouts against the VWAP.
- **Enable Higher-TF Trend Filter** & **Trend Filter Timeframe**: Align breakout signals with the 1h/4h/Daily trend.
- **ADX Length**, **EMA Fast/Slow Length for Context**: Parameters for the context dashboard (Volatility, Trend, Volume).
- **Show Intraday VWAP Line**, **VWAP Line Color/Width**: Display the intraday VWAP line with custom style.
### Signal Interpretation Map
| Signal | Description | Recommended Action |
|--------------------------------|-----------------------------------------------------------|-------------------------------------------|
| 📌 **HH / LL (pivot)** | Market structure (support/resistance) | Note key levels |
| **Bull Trap(green diamond)** | Sweep down + volume spike + wick + rejection | Go long with trend filter
| **Bear Trap(red diamond)** | Sweep up + volume spike + wick + rejection | Go short with trend filter
| 🔵⬆️ **Breakout Confirmed Up** | Close > ATR‑scaled high + volume + OBV↑ | Go long with trend filter |
| 🔵⬇️ **Breakout Confirmed Down** | Close < ATR‑scaled low + volume + OBV↓ | Go short with trend filter |
| 📊 **VWAP Line** | Intraday reference to guide price | Use as dynamic support/resistance |
| ⚡ **Volatility** | ATR ratio High/Med/Low | Adjust position size |
| 📈 **Trend Context** | ADX+EMA Strong/Moderate/Weak | Confirm trend direction |
| 🔍 **Volume Context** | Breakout / Rising / Falling / Calm | Check volume momentum |
*This summary gives you a quick overview of the key settings and how to interpret signals for efficient intraday scalping.*
### Suggested Settings
- **Intraday Scalping (5m–15m)**
- `Swing Pivot Strength = 5`
- `VWMA Length for Trap Volume = 10`, `Volume Spike Multiplier = 1.6`
- `ATR Length for Trap = 7`
- `VWMA Length for Breakout Volume = 12`, `ATR Length for Breakout = 9`, `ATR Multiplier for Breakout = 0.5`
- `Min Body/Range Ratio for Breakout = 0.5`, `OBV Smooth Length = 7`
- `Enable Higher-TF Trend Filter = true` (TF = 60)
- `Show Intraday VWAP Line = true` (Color = orange, Width = 2)
- **Swing Trading (4h–Daily)**
- `Swing Pivot Strength = 10`
- `VWMA Length for Trap Volume = 20`, `Volume Spike Multiplier = 2.0`
- `ATR Length for Trap = 14`
- `VWMA Length for Breakout Volume = 30`, `ATR Length for Breakout = 14`, `ATR Multiplier for Breakout = 0.8`
- `Min Body/Range Ratio for Breakout = 0.7`, `OBV Smooth Length = 14`
- `Enable Higher-TF Trend Filter = true` (TF = D)
- `Show Intraday VWAP Line = false`
*Adjust these values based on the symbol and market volatility for optimal performance.*

SMA mit Prozentlinien – Heiko SeiffertSMA mit einstellbarer Periode und Prozentlinien (oben und unten).

CATS Freak Volume MA % Bands with ShiftThis is a riff on Freak Volume by UniqueCharts. You should probably start there to understand what is happening here. Basically you look for a high volume "freak" volume bar using a set lookback period and a certain standard deviation thresehold. Pretty cool. You can then highlight that bar and show it's range… What has been added here is allowing multiples of the range of that freak bar to be shown. (Sometimes when volume comes into the market there will be a measured move of 2x or 3x of the volume bar.) Also have turned the midpoints of the freak volume bars into a moving average of sorts by connecting those levels with various MA choices and a smothing factor. This MA by itself is very interesting since it can plateau and flatten like a kaufmann ma. Also added the abilty for there to be an envelope around this volume MA. The envelope choices can be a fixed percentage, or a multiple of the freak bar (the before mentioned 2x or other multiples), or a volatility based envelope which you may find interesting. The volatility envelope works in a unique way but you can choose smoothing, steps, % capture, etc. Also added an atr stop loss and the indicator is multi timeframe. There is a lot to play with here...

Matinator 2min -v2.1ATR with ZLSMA exit
Uses ATR reversal for trends and ZLSMA for exit and filtering

3 EMA Trend Detector with Selectable EMAs & Slope Filter📈 3 EMA Trend Detector with Selectable Slope Filters
Overview:
This indicator highlights strong trend conditions using a customizable combination of three exponential moving averages (EMAs). It shades the background green during confirmed uptrends and red during downtrends, providing a clear "go / stop" visual signal on your chart.
The indicator is built for traders who want precision control over which EMAs are used in their trend logic and how strong the trend must be (based on EMA slope). It can be used as a trend confirmation tool, entry filter, or visual market bias gauge.
🧠 How It Works:
Uses three EMAs: default lengths are 12, 48, and 200.
A strong uptrend is confirmed when:
The selected EMAs are aligned (e.g., EMA 12 > EMA 48 > EMA 200)
Each EMA is rising by more than a threshold, defined as a percentage of price
A strong downtrend is confirmed when:
The EMAs are aligned in reverse (e.g., EMA 12 < EMA 48 < EMA 200)
Each EMA is falling by more than the threshold
You can customize the threshold (%) for each EMA to control sensitivity.
⚙️ Features & Customization:
✅ Enable/disable each EMA individually via checkboxes
✅ Custom slope sensitivity per EMA (e.g., EMA 12 reacts faster than EMA 200)
✅ Background shading turns green for uptrend, red for downtrend
✅ Color customization for up/down trends
✅ Hidden trendSignal output (1 = uptrend, -1 = downtrend) for use in alerts
📌 How to Use:
Add the indicator to your chart.
Use the settings to:
Select which EMAs are included in trend detection
Set slope sensitivity for each EMA (as % of price)
Watch the background for:
🟩 Green = strong uptrend (aligned and sloping up)
🟥 Red = strong downtrend (aligned and sloping down)
Optional: use the hidden trendSignal (value of 1 or -1) to set alerts.
🔔 Example Alert Condition:
To alert when a strong uptrend begins:
trendSignal crosses 1
Or when a strong downtrend begins:
trendSignal crosses -1
🔎 Ideal For:
Momentum traders
Trend-followers
Swing traders looking for clean market structure confirmation
Anyone who wants to simplify multi-EMA trend filtering

RSI Bars cleanan update of the excellent concept of RSI chart bars by Glaz ... modified to add a filter for how many bars would be considered a valid signal, optional arrows on valid signals, coloring separate for bar, wick, and body to make RSI bars more obvious, and multi-timeframe ability. Screenshot is set to 8/70/30 and at least 3 RSI bars for an arrow. Highlights are I believe slightly different from original script as well. The emphasis here is on overheated bars that then cool off. Bars are colored when RSI crosses up through 70 then coloring stops when RSI crosses back down through 70. Same at bottom when RSI crosses down below 30 then back up through 30. These numbers as well as the frequency are user changeable. Helps with identifying tops/bottoms of cycles. Fine Print - Your mileage may vary. All standard exclusions apply. Not liable for account injury of any sort. Do not follow too closely. Not responsible for broken windshields.
