NR4 & NR7 with Breakouts [LuxAlgo]NR4 & NR7 with Breakouts is a simple indicator that utilizes the NR4 and NR7 candle patterns to display candle ranges and signals from range breakouts.
🔶 USAGE
The Narrow Range Patterns are candle formations determined by the last candle having a narrower (high-low) range than the previous number. This indicator showcases the 2 most recognized Narrow Range Patterns, which are the 4 and 7 bar variants (NR4 and NR7).
These patterns, introduced by Toby Crabel, are thought to provide insight for potential market breakouts by identifying periods of low volatility indicated by a candle with a small range. This is due to the idea that markets often move from periods of low volatility (contraction) to high volatility (expansion), and the NR4 and NR7 patterns help spot these transitions.
By utilizing these patterns, traders are better able to anticipate and respond to market shifts for better decision-making and risk management.
NOTE: These patterns have traditionally been studied on the Daily Timeframe Chart. This indicator allows the user to select a timeframe to generate these patterns from. It is suggested to be mindful of this when considering these patterns.
In this indicator, on the bar after the pattern is detected, the Narrow Range Bar will be highlighted with a zone, and lines displaying the range will extend from it. These ranges are helpful for providing levels to set limit orders and for managing risk.
Users are able to adjust which pattern they want visualized on their chart, please note;
All NR7s are NR4s but not all NR4s are NR7s.
Because of this, you will notice that when selecting "NR4" to display, the colors will change, but the detected ranges will not change.
🔹 Signals
When a Narrow Range Bar is detected, the script will wait for the price to close outside of the Range, then a signal will fire indicating the direction of exit. The signals are produced from the last NR4 or NR7 and will have the potential to fire from that range until a new NR4 or NR7 is detected.
After a signal fires, the logic goes into a "reset" period where it will wait for the price to reach the Range Mean before firing another signal.
These signals can be anticipated by considering the underlying logic and watching price approach the range extremities, and can be improved by utilizing other market information for confluence.
🔶 SETTINGS
Timeframe: Choose which timeframe to identify the NR4 and NR7 Pattern on. This must be Higher than the chart timeframe.
Pattern Type: Choose which (or all) patterns to display.
Indicators and strategies

Daily ATR Bonanza: Expected Moves - Tr33man Daily ATR Bonanza: Expected Moves
Overview 🤷♂️
The Daily ATR Bonanza script is a powerful trading tool designed to help traders visualize and understand potential price movements using the Average True Range (ATR). It provides daily and weekly ATR levels, historical statistics, and conditional probability analysis to give traders actionable insights. The script also plots the daily Keltner channel. This script is ideal for traders who want to gauge volatility, identify key levels, and make data-driven decisions.
b]Key Features:
📈 1. Daily and Weekly ATR Levels
🔵ATR Levels: The script calculates and displays ATR-based levels for the day and week. These levels are derived from the previous day's or week's close price and are adjusted using customizable multipliers (0.5x, 1x, and 1.5x by default).
🔵You can choose the number of ATR levels (1, 2, or 3) and adjust the multipliers to suit your trading strategy.
🌐 2. ATR Bands (Keltner Channels)
🔵The script includes an option to display ATR Bands, which are volatility-based envelopes around a moving average. These bands help identify overbought and oversold conditions.
🔵You can adjust the ATR multiplier and the length of the moving average used for the bands.
🧮 3. Historical Statistics and Conditional Probability
🔵 Historical Analysis: The script analyzes historical price movements to calculate the likelihood of closing at certain ATR levels.
🔵 Conditional Probability: This feature shows the probability of the price reaching specific ATR levels given the current market conditions. The conditional matches historical data by an open in the same opening ATR bucket, as well as the current price bucket having been visited in the historical case. Conditional probabilities are just statistics, and do not predict anything.
Data Table: 📚
🔵 Historical Close Probability: The percentage of days the price closed within each ATR level.
🔵 Conditional Close Probability: The likelihood of the price closing within each ATR level today.
❓ What is Conditional Probability? ❓
Conditional probability is a statistical measure that calculates the likelihood of an event occurring given that another event has already occurred. In this script, it is used to determine the probability of the price reaching specific ATR levels based on the current opening range as well as current ATR distance from the previous close.
For example:
If the market opens near the lower end of the first ATR level, the script calculates the likelihood of the price reaching the upper end of the first, second, or third ATR level.
This analysis is based on historical data, making it a powerful tool for understanding potential price movements.
🌟 Understanding the Levels
🔵Daily Levels: These are based on the previous day's close price and ATR. They are updated at the start of each new day.
🔵Weekly Levels: These are based on the previous week's close price and ATR. They are updated at the start of each new week.
🔵ATR Bands: These are dynamic levels that adjust with market volatility.
🔬 Analyze the Statistics (Daily only for now, no weekly yet)
🔵Use the interactive table to understand historical probabilities and conditional probabilities.
🔵Focus on the current opening range and the likelihood of reaching specific levels.
🧠 Make Trading Decisions
🔵Use the ATR levels and bands to identify key support and resistance levels.
🔵Use the conditional probability table to gauge the likelihood of reaching specific targets.
🔵Adjust your strategy based on the historical performance of the market.
Example Use Cases
1. Day Trading
Use the daily ATR levels to set intraday targets and stop-loss levels.
Monitor the conditional probability table to adjust your expectations based on the opening range.
2. Swing Trading
Use the weekly ATR levels to identify longer-term support and resistance levels.
3. Scalping
Use the ATR bands to identify overbought and oversold conditions.
Use the conditional probability table to quickly assess the likelihood of price movements.

OTE & A-B-C Zone Indicator SwiftEdgeOTE & A-B-C Zone Indicator SwiftEdge
Overview
The OTE & A-B-C Zone Indicator SwiftEdge is a versatile tool designed to help traders identify high-probability trading setups using a combination of Optimal Trade Entry (OTE) zones, Fibonacci levels, and A-B-C price patterns. This indicator is particularly useful for traders who rely on price action and Fibonacci-based strategies to find entry points, set stop-losses, and target potential take-profit levels. By integrating swing point detection, trend analysis, and Fibonacci projections, SwiftEdge provides a clear visual framework for making informed trading decisions across various timeframes.
What It Does
SwiftEdge identifies key price levels and zones to guide your trading:
OTE Zone: Highlights the Optimal Trade Entry zone between swing points A (swing high) and B (swing low) using Fibonacci retracement levels (default: 0.618 to 0.786). This zone represents a high-probability area for price reversals, making it an ideal entry point for trades.
A-B-C Pattern: Marks the latest swing points as A (swing high), B (swing low), and C (projected take-profit level) with dashed lines and labels. A solid line connects A to B to C, visually illustrating the price movement from entry to target.
Take-Profit Zones: Projects three customizable take-profit levels (TP1, TP2, TP3) based on Fibonacci extensions (default: 1.272, 1.618, 2.0) from the A-B swing, helping traders plan exits with favorable risk-reward ratios.
How It Works
SwiftEdge combines several technical components to create a cohesive trading system:
Swing Point Detection: Identifies significant swing highs (A) and swing lows (B) using a dynamic lookback period that adjusts to the selected timeframe. On lower timeframes like 1-minute charts, an ATR-based filter reduces noise by requiring price movements to exceed a threshold (0.5 * ATR(14)).
Trend Analysis: Uses an Exponential Moving Average (EMA) to determine the trend direction (default: 50-period EMA on 1H). The indicator marks uptrends (price above EMA) in green and downtrends (price below EMA) in red, ensuring trades align with the market's direction.
Fibonacci Levels: Applies Fibonacci retracement to define the OTE zone between A and B, and Fibonacci extensions to project take-profit levels (C) beyond the initial swing. This approach leverages the natural tendency of markets to respect Fibonacci ratios for reversals and extensions.
Visual Clarity: Displays only the latest A-B-C pattern with three dashed lines (A, B, C) and a solid connecting line, ensuring the chart remains uncluttered and easy to interpret.
The combination of these elements creates a structured setup where the OTE zone (between A and B) serves as an entry point, while the projected C level offers a target, all within the context of the prevailing trend. This synergy makes SwiftEdge a powerful tool for traders seeking to combine price action, trend analysis, and Fibonacci strategies.
How to Use
Add the Indicator: Apply the indicator to your chart via TradingView's indicator menu.
Identify the Trend: The OTE zone and A-B-C pattern will be colored green in uptrends (price above EMA) or red in downtrends (price below EMA). Use this to determine the market direction.
Entry Point: Look for price reversals within the OTE zone (between A and B). This zone is typically between the 0.618 and 0.786 Fibonacci retracement levels of the A-B swing, making it a high-probability area for entries.
Stop-Loss: Place your stop-loss below the OTE zone in an uptrend (or above in a downtrend) to protect against false breakouts.
Take-Profit Targets: Use the projected take-profit zones (TP1, TP2, TP3) as potential exit levels. These are based on Fibonacci extensions and can be toggled on/off in the settings.
Customization:
Adjust the Fibonacci levels for the OTE zone (Fibonacci Level 1 and Fibonacci Level 2) to suit your strategy.
Modify the take-profit levels (Fibonacci Extension Level for TP1/TP2/TP3) to target different extension ratios.
Change the lookback period (Base Lookback Period) and EMA period (Base EMA Period) to fine-tune swing point detection and trend sensitivity.
Customize colors for uptrends, downtrends, and A-B-C lines to match your preferences.
What Makes It Unique
SwiftEdge stands out by integrating swing point detection, Fibonacci-based OTE zones, and A-B-C price patterns into a single, visually intuitive indicator. Unlike standalone Fibonacci tools or trend indicators, SwiftEdge combines these elements to provide a complete trading setup: it identifies entry zones (OTE), confirms trend direction (EMA), and projects take-profit targets (Fibonacci extensions). The dynamic timeframe adjustment ensures consistent performance across all chart intervals, while the clean A-B-C visualization (with only the latest pattern displayed) prevents chart clutter, making it easier to focus on the most relevant price levels.
Notes
This indicator is designed for traders familiar with price action and Fibonacci strategies. It does not guarantee profits and should be used in conjunction with other analysis tools and proper risk management.
Performance may vary depending on market conditions and timeframe. Test the indicator on a demo account before using it in live trading.

MACD-V with Volatility Normalisation [DCD]MACD-V with Volatility Normalisation
This indicator is a modified version of the traditional MACD, designed to account for market volatility by normalizing the MACD line using the Average True Range (ATR). It provides a more adaptive approach to identifying momentum shifts and potential trend reversals. This indicator was developed by Alex Spiroglou in this paper:
Spiroglou, Alex, MACD-V: Volatility Normalised Momentum (May 3, 2022).
Features:
Volatility Normalization: The MACD line is adjusted using ATR to standardize its values across different market conditions.
Customizable Parameters: Users can adjust the MACD fast length, slow length, signal line smoothing, and ATR length to suit their trading style.
Histogram Visualization: The histogram highlights the difference between the MACD and signal lines, with customizable colors for positive and negative momentum.
Crossover Signals: Green and red dots indicate bullish and bearish crossovers between the MACD and signal lines.
Background Highlighting: The chart background changes to green when the MACD is above 0 and red when it is below 0, providing a clear visual cue for bullish and bearish conditions.
Horizontal Levels: Dotted horizontal lines are plotted at key levels for better visualization of MACD values.
How to Use:
Look for crossovers between the MACD and signal lines to identify potential buy or sell signals.
Use the histogram to gauge the strength of momentum.
Pay attention to the background color for quick identification of bullish (green) or bearish (red) conditions.
This indicator is ideal for traders who want a more dynamic MACD that adapts to market volatility. Customize the settings to align with your trading strategy and timeframe.

Binary Options Time/Price Entry HelperFor those who like to trade the Nadex 5 minute binary options.
✅ Features:
Marks the start of every 5-minute candle (HH:00, HH:05, HH:10, etc.)
Highlights price action signals:
Bullish Engulfing
Bearish Engulfing
Long rejection wicks (potential reversals)
Designed for 1-minute charts
Ideal for manual binary entries
Look for:
🔽 Gray markers: start of a 5-min cycle
🟩 CALL or 🟥 PUT: bullish or bearish engulfing
🟢 or 🟠 circles: strong rejection wicks
You can take off the 5 minute chart cycle markers and the rejection wick markers for a clean looking chart.
Jump in the trade when the call/put arrows appear. These can be fast moving trades. Be prepared to exit if need be. Nadex lets you exit at any time.
Example: if you enter a call around $75 you can get out at $50 if the trade goes against you. If you enter a put around $25 and the trade goes against you, exit at $50, or as close as possible. If you do this it will keep your rr close to 1:1 - this is VERY important for these trades.
I'm not responsible for how you do on these trades. I've only used it for EURUSD, but it works well. Test it on all the 5 minute binaries if you want and see what you think.
Don't wear yourself out on these. Nadex has 5 minute binaries continuously. Work at it for a couple hours and get good. You can collect the $25 premium several times a day. Just get out if it moves against you.

Fibonacci - RSI OscillatorIndicator Overview
The Fibonacci RSI Oscillator calculates the Relative Strength Index (RSI) based on a dynamically adjusting level derived from recent price action and a fixed Fibonacci ratio (0.236). This differs from standard RSI, which is calculated directly on the closing price. The objective is to measure momentum relative to a level that adapts to recent peaks and valleys.
Core Calculation Mechanism
Peak/Valley Tracking: The script identifies the highest high (state_peak) and lowest low (state_valley) since the last detected change in short-term directional bias (state_dir).
Dynamic Level Calculation: A level (state_dyn_level) is calculated using a fixed 0.236 Fibonacci ratio relative to the tracked peak and valley:
If bias is up: state_dyn_level = state_peak - (state_peak - state_valley) * 0.236
If bias is down: state_dyn_level = state_valley + (state_peak - state_valley) * 0.236
This level adjusts automatically when a new peak or valley is established in the current directional bias. If price crosses the dynamic level against the current bias, the bias flips, and the level recalculates.
Optional Source Smoothing: The calculated state_dyn_level can optionally be smoothed using a user-selected moving average (SMA, EMA, WMA, HMA, RMA) before the RSI calculation.
RSI Calculation: The standard RSI formula is applied to the (optionally smoothed) state_dyn_level series to produce the primary oscillator value (val_primary_osc).
Signal Line: A moving average (type and length configurable) is calculated on the val_primary_osc to generate the val_sig_line.
Key Features & Components
Dynamic Fibonacci Level: The core input for the RSI calculation, based on recent peaks/valleys and the 0.236 ratio.
Fibonacci Level RSI: The primary oscillator line representing the RSI of the dynamic level.
Signal Line: A moving average of the primary RSI line.
Overbought/Oversold Levels: User-defined threshold lines.
Optional Source Smoothing: Configurable MA smoothing applied to the dynamic level before RSI calculation.
Gradient RSI Color : Option to color the primary RSI line based on its value relative to OB/Mid/OS levels.
Zone & OB/OS Fills: Visual fills for the 0-50 / 50-100 zones and specific fills when the RSI enters OB/OS territory.
Background Gradient: Optional vertical background color gradient based on the RSI's position between 0 and 100.
Configurable Parameters: Inputs for lengths, MA types, OB/OS levels, colors, line widths, and feature toggles.
Visual Elements Explained
Fibonacci Level RSI Line: The main plotted oscillator (color/gradient/width configurable).
Signal Line: The moving average of the RSI line (color/width/MA type configurable).
OB/OS Lines: Horizontal lines plotted at the set OB/OS levels (color/width configurable).
Mid-Line (50): Horizontal line plotted at 50 (color/width configurable).
Zone Fills:
Background fill between 0-50 and 50-100 (colors configurable).
Conditional fill between the RSI line and the 50 line when RSI > OB level or RSI < OS level (colors configurable).
Background Gradient: Optional background coloring where transparency varies vertically with the RSI level (base colors and transparency range configurable).
Configuration Options
Users can adjust the following parameters in the indicator settings:
Smoothing: Enable/disable dynamic level smoothing; set length and MA type.
RSI: Set the RSI calculation length.
Signal Line: Set the signal line smoothing length and MA type.
Levels: Define Overbought and Oversold numeric thresholds.
Visuals: Configure colors and widths for the RSI line, signal line, OB/OS lines, mid-line, zone fills, and OB/OS fills.
Gradients: Enable/disable and configure colors for the RSI line gradient; enable/disable and configure colors/transparency for the background gradient.
Interpretation Notes
The oscillator reflects the momentum of the dynamic Fibonacci level, not directly the price. Divergences, OB/OS readings, and signal line crossovers should be interpreted in this context.
The behavior may differ from standard RSI, potentially offering a smoother output or highlighting different momentum patterns depending on market structure and volatility.
As with any indicator, signals should be used in conjunction with other analysis methods and risk management practices. It is not designed as a standalone trading system.
Risk Disclaimer:
Trading involves significant risk. This indicator is provided for analytical purposes only and does not constitute financial advice. Past performance is not indicative of future results. Use sound risk management practices and never trade with capital you cannot afford to lose.

Multi-Symbol Trend DashboardMulti-Symbol Trend Dashboard - MA Cross Trend Monitor
Short Description
A customizable dashboard that displays trend direction across multiple symbols and timeframes using moving average crossovers.
Full Description
Overview
This Multi-Symbol Trend Dashboard allows you to monitor trend direction across 7 different symbols and 5 timeframes simultaneously in a single view. The dashboard uses moving average crossovers to determine trend direction, displaying bullish trends in green and bearish trends in red.
Key Features
Multi-Symbol Monitoring : Track up to 7 different trading instruments at once
Multi-Timeframe Analysis: View 5 different timeframes simultaneously for each instrument
Customizable Moving Averages: Choose between SMA, EMA, or WMA with adjustable periods
Visual Clarity: Color-coded cells provide immediate trend identification
Flexible Positioning: Place the dashboard anywhere on your chart
Customizable Appearance: Adjust sizes, colors, and text formatting
How It Works
The dashboard calculates a fast MA and slow MA for each symbol-timeframe combination. When the fast MA is above the slow MA, the cell shows green (bullish). When the fast MA is below the slow MA, the cell shows red (bearish).
Use Cases
Get a bird's-eye view of market trends across multiple instruments
Identify potential trading opportunities where multiple timeframes align
Monitor your watchlist without switching between charts
Spot divergences between related instruments
Track market breadth across sectors or related instruments
Notes and Limitations
Limited to 7 symbols and 5 timeframes due to TradingView's security request limits
Uses simple MA crossover as trend determination method
Dashboard is most effective when displayed on a dedicated chart
Performance may vary on lower-end devices due to multiple security requests
Settings Explanation
MA Settings: Configure the periods and types of moving averages
Display Settings: Adjust dashboard positioning and visual elements
Trading Instruments: Select which symbols to monitor (defaults to major forex pairs)
Timeframes: Choose which timeframes to display (default: M15, H1, H4, D1, W1)
Colors: Customize the color scheme for bullish/bearish indications and headers
This dashboard provides a straightforward way to maintain situational awareness across multiple markets and timeframes, helping traders identify potential setups and market conditions at a glance.

Volumetric Tensegrity🧮 Volumetric Tensegrity unifies two of the Leading Indicator suite's critical engines — ZVOL ( volume anomaly detection ) and OBVX ( directional conviction ). Originally designed as a structural economizer for traders navigating strict indicator limits (e.g. < 10 slots per chart), it was forced to evolve beyond that constraint simply to fulfill it, albeit with a difference. The fatal flaw of traditional fusion, where two metrics are blended mathematically, is that they lose scale integrity (i.e. meaning). VTense encodes optical tensegrity to scale the amplitude of the ZVOL histogram and the slope of the OBVX spread independently, so that expansion and direction may coexist without either dominating the frame.
🧬 Tensegrity , by definition, is an intelligent design principle where elements in compression are suspended within a network of continuous tension, forming a stable, self-supporting structure . Originally conceived in esoteric biomorphology (c.f. Da Vinci, Snelson, Casteneda), tensegrity balances force through opposition, not rigidity. Applied to financial markets, Volumetric Tensegrity captures this same principle: price compresses, volume expands, conviction builds or fades — yet structure holds through the interplay. The result is not a prediction engine, but a pressure field — one that visualizes where structure might bend, break, or rebound based on how volume breathes.
🗜️ Rather than layering multiple indicators and consuming precious chart space, VTense frees up room for complementary overlays like momentum mapping, liquidity tiers, or volatility phase detection — making it ideal for modular traders operating in tight technical real estate.
🧠 Core Logic - VTense separates and preserves two essential structural forces:
• ZVOL Histogram : A Z-score-based expansion map that measures current volume deviation from its historical average. It reveals buildup zones, dormant stretches, and breakout pressure — regardless of price behavior.
• OBVX Spread : A directional conviction curve that tracks the difference between On-Balance Volume and its volume-weighted fast trend. It shows whether the crowd is leaning in (accumulation/distribution) or backing off.
🔊 ZVOL controls the amplitude of the histogram, while OBVX controls the curvature and slope of the spread. Without sacrificing breathing behavior or analytical depth, VTense provides a compact yet dynamic lens to track both expansion pressure and directional bias within a single footprint.
🌊 Volumetric Tensegrity forecasts breakout readiness, trend fatigue, and compression zones by measuring the volatility within volume . Unlike traditional tools that track volatility of price, this indicator reveals when effort becomes unstable — signaling inflection points before price reacts. Designed to decode rhythm shifts at the volume level, it operates as a pre-ignition scanner that thrives on low-timeframe charts (15m and under) while scaling effectively to 1H for validation.
🪖 From Generals to Scouts
👀 When used jointly, ZVOL + OBVX act as the general : deep-field analysts confirming stress, commitment, or exhaustion. VTense , by contrast, functions as a scout — capturing subtle buildup and alignment before structure fully reveals itself. The indicator aims to be a literal vanguard, establishing a position that can be confirmed or flexibly abandoned when the higher authority arrives to evaluate.
🥂 Use the ZVOL + OBVX pair when :
• You need independent axis control and manual dissection
• You’re building long-form confluence setups
• You have more indicator slots than you need
🔎 Use VTense when :
• You need compact clarity across multiple instruments
• You’re prioritizing confluence _detection_ over granular separation
• You’re building efficient multi-layered systems under slot constraints
🏗️ Structural Behavior and Interpretation
🫁 Z VOL Respiration Histogram : Structural Effort vs Baseline
🔵 Compression Coil – volume volatility is low and stable; the market is coiling
🟢 Steady Rhythm – volume is healthy but unremarkable; balanced participation
🟡 Passive/Absorbed Effort – expansion failing to manifest; watch for reversal
🟠 Clean Expansion – actionable volatility rise backed by structure
🔴 Volatile Blowout – chaos, climax; likely end-phase or fakeout
⚖️ ZVOL Respiration measures how hard the crowd is pressing — not just that volume is rising, but how statistically abnormal the surge is. Because it is rescaled proportionally to OBVX, the amplitude of the histogram reflects structural urgency without overwhelming the visual field.
🖐️ OBVX Spread : Real-Time Directional Conviction Behind Price Moves
🔑 The curvature of the spread reveals not just directional bias but crowd temp o: sharp slopes = urgent transitions; gradual slopes = building structural shifts. Curvature is key: sharp OBVX slope = urgency; gentle arcs = controlled drift or indecision.
• Green Rising : Accumulation — upward pressure from real buyers
• Red Falling : Distribution — sell pressure, downward slope
• Flat Curves : Transitional → uncertainty, microstructure digestion
🎭 Synchronized vs Divergent Behavior
⏱️ Synchronized (high-confluence) : often precedes structural breakouts, with internal conviction clearly visible before price resolves.
• ZVOL expands (yellow/orange/red) and OBVX climbs steeply green = strong bullish pressure
• ZVOL expands while OBVX steepens red = growing sell-side intent
🪤 Divergent (conflict tension) : flags potential traps, fakeouts, and liquidity sweeps.
• ZVOL expands sharply, but OBVX flattens or opposes → reactive expansion without crowd commitment
⛔️ Latent Drift + Structural Holding Patterns : tensegrity in action — the market holds tension without directional release.
• ZVOL compresses (blue) + OBVX meanders near zero → structure is resting, building up energy
• After prolonged drift, expect violent asymmetry when balance finally breaks
📚 Phase Interpretation: Dynamic Structural Read
• 1️⃣ Quiet Coil : Histogram flat, OBVX flat → no urgency
• 2️⃣ Initial Pulse : Yellow bars, OBVX slope builds → actionable tension
• 3️⃣ Structural Breath : Synchronized expansion and slope → directional commitment
• 4️⃣ Disagreement : Spike in ZVOL, flattening OBVX → exhaustion risk or false signal
💡 Suggested Use
• Run on 15m charts for breakout anticipation and 1H for validation
• Pair with ZVOL + OBVX to confirm crowd conviction behind the tension phase
• Use as a rhythm filter for the suite's trend indicators (e.g., RDI , SUPeR TReND 2.718 , et. al.)
• Ideal during low-volume regimes to detect pressure buildup before triggers
🧏🏻 Volumetric Tensegrity doesn’t signal. It breathes , and listens to pressure shifts before they speak in price. As a scout, it lets you see structural posture before signals align — helping you front-run resolution with clarity, not prediction.

TJR Liquidity mark-out indicatorIndicator Description:
This custom Pine Script indicator is designed to mark highs and lows based on a simple candle pattern recognition system, ideal for traders using TJR's Strategy or any strategy focused on liquidity.
The indicator marks out key levels where the price has not yet taken out liquidity. Specifically, it looks for price patterns where there is:
A bullish candle followed by a bearish candle (marking a potential high).
A bearish candle followed by a bullish candle (marking a potential low).
Once these highs and lows are identified, lines are drawn extending to the right until price sweeps the level — that is, when the price breaks above a high or below a low, the line is deleted. This makes the indicator highly useful for liquidity-based strategies where the goal is to spot unfilled liquidity zones (i.e., levels where price has not yet reached).
The indicator is especially beneficial for traders who:
Use TJR's Strategy, which typically involves identifying market structure shifts and liquidity zones.
Focus on liquidity pools and want to visualize areas where the market could potentially "sweep" or revisit to grab liquidity before continuing its movement.
By showing these areas where the liquidity hasn't been taken out yet, this indicator allows traders to better time their entries and exits, helping them align with areas of unfilled liquidity in the market. It’s a great addition for those looking to trade near key liquidity zones or manage risk based on market structure shifts.
Key Features:
Marks Liquidity Zones: Detects potential liquidity areas based on candle patterns.
Dynamic Lines: Lines extend to the right and disappear once price sweeps them.
Perfect for TJR's Strategy: Aligns with liquidity-focused strategies.
Customizable: Choose time periods, colors, and line length for personalized settings.
Real-time Updates: Continuously updates as new candles form, ensuring you have the latest liquidity data.

Swing Trading PRO - Moving averages + RSIWhat the Lines Mean ?
Orange Line (Fast EMA) = 20-period Exponential Moving Average
Blue Line (Slow EMA) = 50-period Exponential Moving Average
These are used to determine market trend:
If orange (EMA 20) is above blue (EMA 50) → Market is in an uptrend
If orange is below blue → Market is in a downtrend
Use on 4H or Daily timeframe for swing trades
Avoid using in sideways/choppy markets (when the EMAs are close together or crossing repeatedly)
Combine with support/resistance or Fibonacci retracements for more precise exits

ICT Killzones & Pivots [TFO]shorten the date name
adjust to fit in JST time zone (fit for Japan based traders like me, who is early bird and can't trade at 10PM JST = NY open)

Aggregated Open Interest [Alpha Extract]The Aggregated Open Interest indicator provides a comprehensive view of open interest across multiple cryptocurrency exchanges, allowing traders to monitor institutional positioning and market sentiment. By aggregating data from major exchanges like Binance, BitMEX, and Kraken, this indicator offers valuable insights into potential price movements and market shifts.
🔶 CALCULATION
The indicator processes open interest data through multiple analytical methods:
Exchange Aggregation: Collects and normalizes open interest data from multiple exchanges (Binance, BitMEX, Kraken) with proper currency normalization.
Multi-Mode Analysis: Calculates various metrics including raw open interest values, OI change, OI delta, volume-weighted delta, and OI RSI.
Divergence Detection: Uses pivot point analysis to identify divergences between price action and open interest movements.
Activity Assessment: Tracks bullish and bearish activity patterns by correlating open interest changes with price movements.
Formula:
Aggregate OI = Sum of normalized open interest from selected exchanges
OI Change = Current OI - Previous OI
OI Delta = Net change in open interest across timeframes
OI Delta × Volume = OI Delta weighted by relative volume
OI RSI = Relative Strength Index applied to open interest values
OI Heatmap = Multi-timeframe visualization of OI changes across 7 distinct periods
🔶 DETAILS
Visual Features:
Open Interest: Candlestick representation of aggregated open interest
OI Change: Histogram showing period-to-period changes
OI Delta: Histogram displaying net OI movements
OI Delta × Volume: Volume-weighted OI delta for enhanced signals
OI RSI: Oscillator showing overbought/oversold OI conditions
OI Heatmap: Multi-timeframe visualization showing OI changes across 7 periods (3, 5, 8, 13, 21, 34, and 55 days)
Divergence Detection: Color-coded markers (teal for bullish, red for bearish) highlighting significant divergences between price and open interest
Analysis Table: Real-time summary of key metrics including aggregate OI, recent changes, and bullish/bearish activity.
Interpretation:
Increasing Open Interest + Rising Price: Strong bullish trend confirmation
Increasing Open Interest + Falling Price: Strong bearish trend confirmation
Decreasing Open Interest + Rising Price: Weak bullish trend (potential reversal)
Decreasing Open Interest + Falling Price: Weak bearish trend (potential reversal)
Divergences: Signal potential trend exhaustion and reversals when price moves in one direction while open interest moves in the opposite direction
Heatmap: Provides at-a-glance insight into open interest trends across multiple timeframes, with green bars indicating rising OI and red bars indicating falling OI
🔶 EXAMPLES
Trend Confirmation: Rising open interest accompanying a price increase confirms strong bullish momentum with institutional backing.
Example: During January-February 2025, rising OI during price advances confirms institutional participation in the uptrend.
Bearish Divergence: Price makes a higher high while open interest makes a lower high, signaling potential trend reversal.
Example: Red markers appear at market tops where price continues higher but open interest fails to confirm, preceding significant corrections.
Bullish Divergence : Price makes a lower low while open interest makes a higher low, indicating potential bottoming.
Example: Teal markers appear at market bottoms where price continues lower but open interest fails to confirm, preceding significant rallies.
OI Heatmap Analysis : Multiple timeframes showing consistent red signals across short to long-term periods indicate strong institutional selling pressure.
Example: When all 7 periods (3-55 days) show red during a price uptrend, this signals institutional selling into retail strength, often preceding major corrections.
🔶 SETTINGS
Customization Options:
Data Sources: Toggle different exchanges (Binance USDT/USD/BUSD, BitMEX USD/USDT, Kraken USD)
Display Mode: Choose between Open Interest, OI Change, OI Delta, OI Delta × Volume, OI RSI, and OI Heatmap
Currency Units: Display in USD or base cryptocurrency (COIN)
Analysis Tools: Moving Average (length and color), RSI (length and color)
Divergence Detection: Enable/disable signals, adjust lookback period and threshold percentage, customize bullish/bearish divergence colors
OI Heatmap Colors: Customize bullish (green) and bearish (red) signal colors for the multi-timeframe heatmap visualization
The Aggregated Open Interest indicator provides traders with comprehensive insights into institutional positioning across major exchanges, helping identify potential trend continuations, reversals, and key market turning points driven by smart money movements. The addition of the OI Heatmap feature enables traders to quickly visualize open interest trends across multiple timeframes, providing valuable context for institutional positioning over different market cycles.

Zero Lag Trend Signals (MTF) + Sideways FilterThis script is a custom indicator for TradingView that combines two major components: the **Zero Lag Trend** (with MTF support) and a **Sideways Market Filter**. Let me break down the key features and functions of the script:
### Key Components:
1. **Zero Lag Trend Signals**:
- **Zero Lag Trend (ZLEMA)**: A smoothed moving average designed to minimize lag and give faster responses to price movements. This is used to determine the trend.
- **Trend Bands**: Upper and lower bands are derived from the ZLEMA value and adjusted by volatility (calculated using Average True Range or ATR).
- **Trend Direction**: The trend direction is determined by whether the price crosses over the upper or lower band of the ZLEMA, indicating bullish or bearish trends.
2. **Sideways Market Filter**:
- **RSI (Relative Strength Index)**: Measures the speed and change of price movements. It's used here to identify neutral or sideways market conditions when RSI is between 40 and 60.
- **ADX (Average Directional Index)**: Measures the strength of a trend. The script considers a sideways market when ADX is less than 25 and both DI+ and DI- are low.
- **Sideways Market Condition**: A sideways market is defined when the RSI is in the range of 40 to 60 and the ADX is below 25, indicating weak trends.
### Main Features:
1. **Sideways Market Indicators**:
- **Sideways Circles**: When the market is identified as "sideways" based on RSI and ADX conditions, a small circle is plotted either above or below the bars on the chart. The user can adjust the color of the circles via the indicator settings.
- **Sideways Market Filter**: This filter helps to determine when to stay out of trend-based signals, and its detection is visually marked by the circles.
2. **Zero Lag Trend (ZLEMA) Plot**:
- **ZLEMA**: The Zero Lag Exponential Moving Average is plotted as a baseline, and the direction of the trend is indicated by color changes. Green is used for bullish trends, and red is used for bearish trends.
- **Trend Bands**: The script calculates upper and lower bands around the ZLEMA using volatility, and these bands help identify areas of potential trend reversal.
3. **Trend Plotting**:
- **Trend Arrows**: When the trend crosses from bullish to bearish or vice versa, the script plots arrows ("▲" for bullish and "▼" for bearish) above or below the bars on the chart to indicate the signal.
- **Trend Entry Points**: Small arrows are plotted when an entry point is detected for a long (bullish) or short (bearish) position.
4. **Multi-Timeframe (MTF) Trend Signals**:
- The script includes multi-timeframe (MTF) analysis by checking the trend on different timeframes (5m, 15m, 60m, 240m, and 1D).
- A **data table** is displayed on the chart showing the trend status for each of these timeframes (Bullish or Bearish), helping the trader visualize the trend across multiple timeframes.
5. **Alerts**:
- **Alert Conditions**: Alerts are triggered when specific conditions are met, such as:
- Bullish or bearish trend crossover.
- Zero Lag Trend crossing the price.
- Trend change signals on any of the timeframes.
- Alerts for bullish and bearish entry signals based on the trend.
### Inputs for Customization:
- **Zero Lag Trend Parameters**: Length, multiplier for the band, and timeframes for MTF analysis (t1, t2, t3, t4, t5).
- **Color Customization**: Colors for bullish and bearish trends, as well as the fill colors for the bands and the sideways market circles.
- **Sideways Market Filter Parameters**: RSI length, ADX length, and options for showing sideways market circles.
- **Circle Customization**: You can adjust the size, color, and location (above or below bars) of the sideways market circles.
### Summary:
This indicator is a sophisticated tool that combines the **Zero Lag Trend** and **Sideways Market Filter** to help traders:
- Identify strong trends (bullish or bearish) using the ZLEMA and volatility bands.
- Stay out of choppy or sideways markets using the RSI and ADX filter.
- Make trading decisions based on trend confirmation across multiple timeframes (MTF).
- Customize the visual appearance, including color schemes, circle size, and alert conditions.
This script is perfect for traders who want to focus on trading trends while avoiding market conditions that are not conducive to strong directional moves.

Hull Trend Strong ConfirmationHull Trend original adapted: Added Strong Confirmation. Original code: jaggesoft

Global Net Liquidity - OffsetThis is a global net liquidity indicator with a built-in offset, allowing you to adjust by a specific number of days.
A lot of people believe that Global Net Liquidity operates at a 10-12 week lag, so being able to offset it helps to visualise the impact of liquidity on markets.

Time-Based Fair Value Gaps (FVG) with Inversions (iFVG)The Time-Based Fair Value Gaps (FVG) with Inversions (iFVG) (ICT/SMT) is a specialized tool for ICT traders, pinpointing Fair Value Gaps (FVGs) within customizable 10-minute windows each hour (:00–:10, :10–:20, :20–:30, :30–:40, :40–:50, :50–:60).
Optimized for 10 minute charts or lower, this indicator identifies bullish and bearish FVGs, tracks their mitigation to form inverted FVGs (iFVGs) as key support/resistance zones, and generates retest signals with "Close" or "Wick" options.
With toggleable ATR filtering, optional FVG labels, mitigation removal, and alerts for new FVGs and signals, this indicator delivers precision for ICT strategies.
A timeframe warning ensures users stay on lower timeframes (<1 hour) for accurate filtering, making it ideal for targeting macro timeframes and hourly transitions.
Settings Description:
Show Last (disp_num): Sets the number of recent inverted FVGs (iFVGs) to display (1–100, default: 5). Lower values reduce chart clutter, while higher values show more historical zones.
Time Window Checkboxes (enable_00_10, enable_10_20, etc.): Six toggles to enable/disable FVG detection in each 10-minute window (:00–:10, :10–:20, :20–:30, :30–:40, :40–:50, :50–:60). All default to enabled, allowing FVGs across the hour. Disable specific windows to focus on key ICT periods (e.g., :00–:10 for hourly opens).
Signal Preference (signal_pref): Choose "Close" (default) or "Wick" for iFVG retest signals. "Close" requires the candle body to confirm the retest, while "Wick" uses highs/lows, offering earlier but potentially noisier signals.
Use ATR Filter (use_atr): Enables/disables ATR-based size filtering for FVGs (default: true). When enabled, only FVGs larger than ATR × Multiplier are shown, reducing noise.
ATR Multiplier (atr_multi): Sets the ATR threshold for FVG size (0–∞, default: 0.25). Higher values filter for larger gaps; setting to 0 uses the average bar range, making the filter very permissive.
Remove Mitigated FVGs (remove_mitigated): Removes FVGs and iFVGs when price fully closes through them (default: true), aligning with ICT’s principle that mitigated gaps lose relevance.
Show FVG Labels (show_labels): Displays “Bull FVG” or “Bear FVG” labels above/below gaps (default: true). Disable to reduce chart clutter.
Colors (bull_color, bear_color, midline_color): Customize colors for bullish FVGs (green), bearish FVGs (red), and midlines (gray). Adjust transparency for visibility.
Recommendations for ICT Traders
To maximize the indicator’s effectiveness within ICT concepts, use it on 1–5 minute charts during macro timeframes like the New York Kill Zone (7:00–11:00 AM EST) or London Kill Zone (2:00–5:00 AM EST), where institutional order flow often creates significant FVGs. Focus on the :00–:10 and :50–:60 windows by enabling only these checkboxes , as they capture hourly opens and closes, key for ICT setups like Judas swings or liquidity grabs.
Keep ATR filtering enabled with a multiplier of 0.25–0.5 to prioritize impactful gaps, but disable it on lower timeframes (e.g., 1-minute) for more FVGs during high-volatility periods.
Enable mitigation removal to declutter the chart, reflecting ICT’s view that filled FVGs are less relevant unless inverted.
Use "Close" signal preference for conservative retest confirmation, switching to "Wick" for faster entries in aggressive setups.
Set alerts for “Bullish FVG Detected,” “Bearish FVG Detected,” “Bullish Signal,” and “Bearish Signal” to catch real-time opportunities.
Avoid timeframes ≥1 hour, as the minute-based filter may be unreliable, and heed the warning label to stay on lower timeframes for precision.

PowerHouse SwiftEdge AI v2.10 StrategyOverview
The PowerHouse SwiftEdge AI v2.10 Strategy is a sophisticated trading system designed to identify high-probability trade setups in forex, stocks, and cryptocurrencies. By combining multi-timeframe trend analysis, momentum signals, volume confirmation, and smart money concepts (Change of Character and Break of Structure ), this strategy offers traders a robust tool to capitalize on market trends while minimizing false signals. The strategy’s unique “AI” component analyzes trends across multiple timeframes to provide a clear, actionable dashboard, making it accessible for both novice and experienced traders. The strategy is fully customizable, allowing users to tailor its filters to their trading style.
What It Does
This strategy generates Buy and Sell signals based on a confluence of technical indicators and smart money concepts. It uses:
Multi-Timeframe Trend Analysis: Confirms the market’s direction by analyzing trends on the 1-hour (60M), 4-hour (240M), and daily (D) timeframes.
Momentum Filter: Ensures trades align with strong price movements to avoid choppy markets.
Volume Filter: Validates signals with above-average volume to confirm market participation.
Breakout Filter: Requires price to break key levels for added confirmation.
Smart Money Signals (CHoCH/BOS): Identifies reversals (CHoCH) and trend continuations (BOS) based on pivot points.
AI Trend Dashboard: Summarizes trend strength, confidence, and predictions across timeframes, helping traders make informed decisions without needing to analyze complex data manually.
The strategy also plots dynamic support and resistance trendlines, take-profit (TP) levels, and “Get Ready” signals to alert users of potential setups before they fully develop. Trades are executed with predefined take-profit and stop-loss levels for disciplined risk management.
How It Works
The strategy integrates multiple components to create a cohesive trading system:
Multi-Timeframe Trend Analysis:
The strategy evaluates trends on three timeframes (1H, 4H, Daily) using Exponential Moving Averages (EMA) and Volume-Weighted Average Price (VWAP). A trend is considered bullish if the price is above both the EMA and VWAP, bearish if below, or neutral otherwise.
Signals are only generated when the trend on the user-selected higher timeframe aligns with the trade direction (e.g., Buy signals require a bullish higher timeframe trend). This reduces noise and ensures trades follow the broader market context.
Momentum Filter:
Measures the percentage price change between consecutive bars and compares it to a volatility-adjusted threshold (based on the Average True Range ). This ensures trades are taken only during significant price movements, filtering out low-momentum conditions.
Volume Filter (Optional):
Checks if the current volume exceeds a long-term average and shows positive short-term volume change. This confirms strong market participation, reducing the risk of false breakouts.
Breakout Filter (Optional):
Requires the price to break above (for Buy) or below (for Sell) recent highs/lows, ensuring the signal aligns with a structural shift in the market.
Smart Money Concepts (CHoCH/BOS):
Change of Character (CHoCH): Detects potential reversals when the price crosses under a recent pivot high (for Sell) or over a recent pivot low (for Buy) with a bearish or bullish candle, respectively.
Break of Structure (BOS): Confirms trend continuations when the price breaks below a recent pivot low (for Sell) or above a recent pivot high (for Buy) with strong momentum.
These signals are plotted as horizontal lines with labels, making it easy to visualize key levels.
AI Trend Dashboard:
Combines trend direction, momentum, and volatility (ATR) across timeframes to calculate a trend score. Scores above 0.5 indicate an “Up” trend, below -0.5 indicate a “Down” trend, and otherwise “Neutral.”
Displays a table summarizing trend strength (as a percentage), AI confidence (based on trend alignment), and Cumulative Volume Delta (CVD) for market context.
A second table (optional) shows trend predictions for 1H, 4H, and Daily timeframes, helping traders anticipate future market direction.
Dynamic Trendlines:
Plots support and resistance lines based on recent swing lows and highs within user-defined periods (shortTrendPeriod, longTrendPeriod). These lines adapt to market conditions and are colored based on trend strength.
Why This Combination?
The PowerHouse SwiftEdge AI v2.10 Strategy is original because it seamlessly integrates traditional technical analysis (EMA, VWAP, ATR, volume) with smart money concepts (CHoCH, BOS) and a proprietary AI-driven trend analysis. Unlike standalone indicators, this strategy:
Reduces False Signals: By requiring confluence across trend, momentum, volume, and breakout filters, it minimizes trades in choppy or low-conviction markets.
Adapts to Market Context: The ATR-based momentum threshold adjusts dynamically to volatility, ensuring signals remain relevant in both trending and ranging markets.
Simplifies Decision-Making: The AI dashboard distills complex multi-timeframe data into a user-friendly table, eliminating the need for manual analysis.
Leverages Smart Money: CHoCH and BOS signals capture institutional price action patterns, giving traders an edge in identifying reversals and continuations.
The combination of these components creates a balanced system that aligns short-term trade entries with longer-term market trends, offering a unique blend of precision, adaptability, and clarity.
How to Use
Add to Chart:
Apply the strategy to your TradingView chart on a liquid symbol (e.g., EURUSD, BTCUSD, AAPL) with a timeframe of 60 minutes or lower (e.g., 15M, 60M).
Configure Inputs:
Pivot Length: Adjust the number of bars (default: 5) to detect pivot highs/lows for CHoCH/BOS signals. Higher values reduce noise but may delay signals.
Momentum Threshold: Set the base percentage (default: 0.01%) for momentum confirmation. Increase for stricter signals.
Take Profit/Stop Loss: Define TP and SL in points (default: 10 each) for risk management.
Higher/Lower Timeframe: Choose timeframes (60M, 240M, D) for trend filtering. Ensure the chart timeframe is lower than or equal to the higher timeframe.
Filters: Enable/disable momentum, volume, or breakout filters to suit your trading style.
Trend Periods: Set shortTrendPeriod (default: 30) and longTrendPeriod (default: 100) for trendline plotting. Keep below 2000 to avoid buffer errors.
AI Dashboard: Toggle Enable AI Market Analysis to show/hide the prediction table and adjust its position.
Interpret Signals:
Buy/Sell Labels: Green "Buy" or red "Sell" labels indicate trade entries with predefined TP/SL levels plotted.
Get Ready Signals: Yellow "Get Ready BUY" or orange "Get Ready SELL" labels warn of potential setups.
CHoCH/BOS Lines: Aqua (CHoCH Sell), lime (CHoCH Buy), fuchsia (BOS Sell), or teal (BOS Buy) lines mark key levels.
Trendlines: Green/lime (support) or fuchsia/purple (resistance) dashed lines show dynamic support/resistance.
AI Dashboard: Check the top-right table for trend strength, confidence, and CVD. The optional bottom table shows trend predictions (Up, Down, Neutral).
Backtest and Trade:
Use TradingView’s Strategy Tester to evaluate performance. Adjust TP/SL and filters based on results.
Trade manually based on signals or automate with TradingView alerts (set alerts for Buy/Sell labels).
Originality and Value
The PowerHouse SwiftEdge AI v2.10 Strategy stands out by combining multi-timeframe analysis, smart money concepts, and an AI-driven dashboard into a single, user-friendly system. Its adaptive momentum threshold, robust filtering, and clear visualizations empower traders to make confident decisions without needing advanced technical knowledge. Whether you’re a day trader or swing trader, this strategy provides a versatile, data-driven approach to navigating dynamic markets.
Important Notes:
Risk Management: Always use appropriate position sizing and risk management, as the strategy’s TP/SL levels are customizable.
Symbol Compatibility: Test on liquid symbols with sufficient historical data (at least 2000 bars) to avoid buffer errors.
Performance: Backtest thoroughly to optimize settings for your market and timeframe.

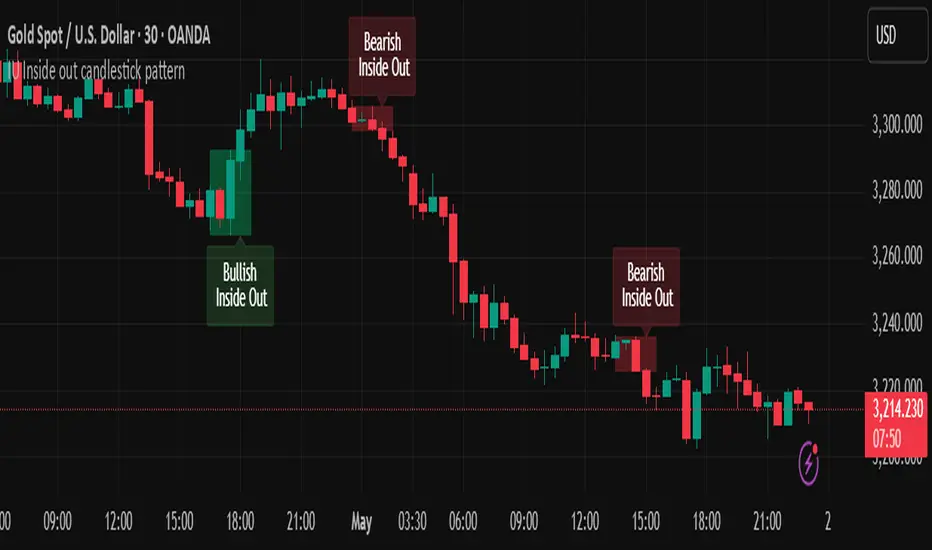
IU Inside out candlestick patternIU Inside Out Candlestick Pattern
This indicator identifies the Inside Out Candlestick Pattern — a unique 3-bar price action setup that captures strong market momentum and potential reversals with greater reliability than traditional patterns.
Pattern Logic:
The Inside Out pattern builds upon a classic engulfing setup by adding a breakout confirmation, making it a refined and filtered approach to candlestick analysis.
Bullish Inside Out Logic:
- Bar must be a bullish engulfing candle (engulfs previous bearish candle).
- Current bar must be bullish and must close above the high of the engulfing candle (a bullish breakout).
- When this setup is confirmed, a shaded green box is drawn around the range of the engulfing candle and its preceding bar.
Bearish Inside Out Logic:
- Bar must be a bearish engulfing candle (engulfs previous bullish candle).
- Current bar must be bearish and must close below the low of the engulfing candle (a bearish breakdown).
- When confirmed, a red box highlights the zone formed by the engulfing candle and its prior bar.
Why this is unique:
Unlike conventional candlestick indicators that trigger signals immediately after an engulfing pattern, this script adds a breakout condition to validate follow-through strength. This reduces false positives and gives traders a clearer edge. The pattern is also rare, which means it captures strong, decisive moves when it does appear.
How users can benefit:
- High-quality entries: Only shows patterns with proven follow-through, improving trade timing.
- Visual clarity: Boxes and labels highlight significant price zones for easy interpretation.
- Flexible use: Applicable across timeframes and instruments — ideal for both intraday and swing traders.
- Alerts included: Real-time alerts help traders stay updated without staring at charts all day.
This script is a powerful tool for price action traders looking to enhance pattern reliability and signal strength through structure-based breakout confirmation.

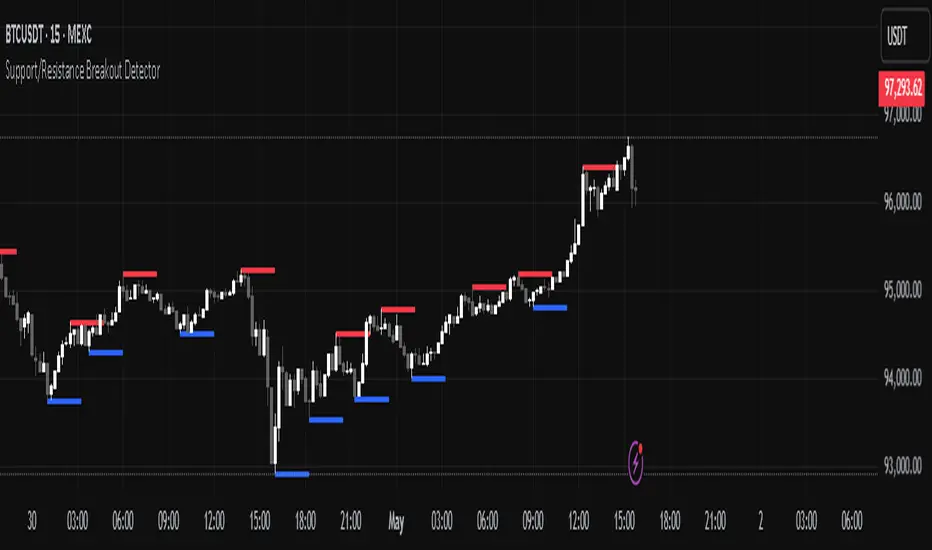
Support/Resistance Breakout DetectorThis indicator automatically detects and plots dynamic support and resistance levels using pivot highs and lows.
✅ It draws red resistance lines and blue support lines,
✅ The lines extend forward but automatically stop when the price touches them,
✅ It monitors for breakouts with strong volume,
✅ When a breakout happens, it shows labels like “B” or “Bull Wick” / “Bear Wick” on the chart,
✅ It also triggers alerts when support or resistance breaks with high volume.
Main settings:
Pivot lookback period
Show/hide breakout labels
Minimum volume for breakout
Maximum extension length for lines
This tool helps traders easily spot key price levels and watch for meaningful breakouts.
TJR's BOS strategyBreak of Structure (BOS) Indicator: TJR version
This Break of Structure (BOS) Indicator helps you identify key market shifts by highlighting breaks in market structure. It uses price action to spot significant swing highs and swing lows and draws horizontal lines that extend to the right whenever a BOS occurs.
Features:
Real-Time Updates: The indicator continuously updates in real time, marking BOS points as they occur.
BOS Lines:
Bullish Break of Structure (BOS): Occurs when the price closes above a previously established high.
Bearish Break of Structure (BOS): Occurs when the price closes below a previously established low.
Customizable: Easily change the color and line length of the BOS markers to suit your charting preferences.
Max Lines Control: Limit the number of BOS lines shown in both upward and downward directions to keep the chart clean.
Visual Clarity: Lines are drawn directly on the high or low levels, marking clear BOS zones on the chart for easy identification.
How to Use:
BOS Up: A bullish BOS is marked when the price closes above a previously marked high.
BOS Down: A bearish BOS is marked when the price closes below a previously marked low.
Trend Direction: This indicator can be particularly useful for traders following trend continuation or reversal strategies, as BOS points represent key areas where market sentiment shifts.
Custom Settings:
Change the color of BOS lines for better visibility.
Adjust the maximum number of BOS lines to display.


Smarter Money Concepts - MTF IFVGs [PhenLabs]📊 Smarter Money Concepts - MTF IFVG
Version: PineScript™ v6
📌 Description
This multi-timeframe indicator identifies Inverse Fair Value Gaps (IFVGs) and their inversions across simultaneous chart intervals, helping traders spot liquidity voids and potential reversal zones. By analyzing price action through the lens of institutional order flow patterns, it solves the problem of manual gap tracking across timeframes while incorporating volatility-adjusted parameters and psychological level analysis for higher-probability setups.
🚀 Points of Innovation
• Multi-Timeframe Engine - Simultaneous analysis of 3 higher timeframes
• Adaptive Parameters - Auto-adjusts to market volatility conditions
• Quality Scoring System - Ranks gaps using RVI strength and size metrics
• Inversion Tracking - Monitors failed gaps for counter-trend signals
• Render Optimization - Prevents chart clutter with smart gap management
🔧 Core Components
FVG Detection Logic: Identifies gaps using customizable price source (Close/Wick)
Inversion Tracker: Manages failed gaps and generates counter signals
Multi-Timeframe Engine: Processes 3 independent higher timeframe analyses
Dashboard System: Real-time display of active gaps across all timeframes
🔥 Key Features
• Volatility-adjusted gap size filters (ATR-based)
• Customizable timeframe confluence analysis
• Color-coded quality scoring
• Non-repainting inversion signals
• Mobile-optimized visual rendering
🎨 Visualization
• Colored Boxes: Translucent zones show active gaps (green/bullish, red/bearish)
• Midline Plot: Dashed gray line marks gap midpoint for price targets
• Inversion Markers: Intense colors show failed gaps (dark red/bullish failure, bright green/bearish failure)
• HTF Differentiation: Higher timeframe gaps shown in blue/teal hues
📖 Usage Guidelines
Multi-Timeframe Settings
• Higher Timeframe 1
Default: 30 | Range: Any > Chart TF | Controls primary confluence timeframe
• Show All Timeframes
Default: True | Toggles multi-TF gap displays
Gap Settings
• Source
Default: Close | Options: | Determines gap measurement method
• RVI Period
Default: 14 | Range: 1-50 | Sets momentum confirmation sensitivity
• RVI Value
Default 0.1 | 0 to see all IFVGs | Increase min RVI to see the most powerful IFVGs
✅ Best Use Cases
• Identifying confluence across timeframes
• Spotting institutional order blocks
• High-probability reversal trading
• Trend continuation confirmation
• Volatility breakout setups
⚠️ Limitations
• Repaints historical gap zones
• Requires understanding of FVG concepts
• Higher timeframe data latency
• Quality scores rely on RVI/ATR settings
💡 What Makes This Unique
First FVG indicator with true multi-timeframe processing
Adaptive parameters that auto-adjust to volatility
Quantifiable quality scoring system
Professional-grade dashboard with HTF tracking
🔬 How It Works
Gap Detection: Identifies FVGs using price relationships and RVI confirmation
Inversion Tracking: Monitors price breaches to flag failed gaps
Quality Assessment: Scores gaps based on size, momentum, and location
Adaptive Filtering: Adjusts parameters using ATR-based volatility analysis
Multi-TF Synthesis: Correlates gaps across user-selected timeframes
Visual Rendering: Displays only relevant, active gaps to prevent clutter
💡 Note:
Start with default settings and gradually adjust parameters after observing market interactions. Focus on gaps with quality scores above 7 that align with higher timeframe trends. Combine with price action at psychological levels for highest-probability setups. Remember that higher timeframe gaps generally carry more significance than current chart gaps.

Zero Lag Trend Signals (MTF) + Sideways FilterAbsolutely! Here's a **plain-language description** of what the script does **without diving into code**:
---
### 🔍 **What This Script Does:**
This is a **technical indicator** for TradingView that helps you identify:
1. **When the market is trending** (either bullish or bearish).
2. **When the market is moving sideways** (range-bound or choppy).
3. **Entry signals** during strong trends.
4. **Confirmation signals** across **multiple timeframes** (from 5-minute to daily).
5. **Visual cues and alerts** to guide trading decisions.
---
### 📈 **How It Works:**
#### 1. **Zero Lag Trend Detection**
- It uses a special moving average called **ZLEMA** (Zero Lag Exponential Moving Average) that reacts faster to price changes than traditional ones.
- If the price moves strongly above or below this average, the script recognizes it as a **new trend starting**.
#### 2. **Sideways Market Filter**
- It checks whether the market is **moving within a tight range** by analyzing:
- RSI (Relative Strength Index)
- ADX (Average Directional Index)
- If the market is sideways, it **avoids showing trend signals** and displays a gray circle instead to indicate indecision or no clear trend.
#### 3. **Visual Trend Markers**
- **Green arrows** appear when an upward trend begins.
- **Red arrows** appear when a downward trend begins.
- **Smaller arrows** suggest continuation or entry points during an ongoing trend.
#### 4. **Multi-Timeframe Confirmation**
- It looks at the trend across **five different timeframes** (e.g., 5 min, 15 min, 1 hour, 4 hour, 1 day).
- A **table appears on your chart** showing whether each timeframe is bullish or bearish — helping you make better-informed decisions.
#### 5. **Alerts**
- The script can send **alerts when trend signals appear**, so you don’t miss a potential trade setup even if you're away from the screen.
---
### ✅ **Why Use It:**
This script is ideal for:
- Traders who want to **follow trends and avoid choppy markets**.
- Those who prefer **clear visual signals** and multi-timeframe analysis.
- Anyone using **momentum or trend-following strategies**, especially with indicators like ZLEMA or ADX.
---
