trendline syedA trendline is a straight line drawn on a chart to help visualize the general direction (trend) of a market, security, or asset over time. It is a basic yet powerful tool used in technical analysis.
🔹 Types of Trendlines:
Uptrend Line
Drawn by connecting higher lows.
Indicates a bullish market.
Acts as support.
Downtrend Line
Drawn by connecting lower highs.
Indicates a bearish market.
Acts as resistance.
Horizontal/Sideways Line
Shows a consolidation or range-bound market.
🔹 Purpose of a Trendline:
Identifies direction of the trend (up, down, sideways).
Acts as support/resistance.
Helps in spotting breakout or reversal opportunities.
🔹 Key Points:
The more times a trendline is touched without being broken, the more valid it is.
It should connect at least two significant points, preferably three for stronger reliability.
Trendlines can be applied to any time frame (intraday, daily, weekly, etc.).
Indicators and strategies

COT3 - Flip Strength Index - Invincible3This indicator uses the TradingView COT library to visualize institutional positioning and potential sentiment or trend shifts. It compares the long% vs short% of commercial and non-commercial traders for both Pair A and Pair B, helping traders identify trend strength, market overextension, and early reversal signals.
🔷 COT RSI
The COT RSI normalizes the net positioning difference between non-commercial and commercial traders over (N=13, 26, and 52)-week periods. It ranges from 0 to 100, highlighting when sentiment is at bullish or bearish extremes.
COT RSI (N)= ((NC - C)−min)/(max-min) x100
🟡 COT Index
The COT Index tracks where the current non-commercial net position lies within its 1-year and 3-year historical range. It reflects institutional accumulation or distribution phases.
Strength represents the magnitude of that positioning bias, visualized through normalized RSI-style metrics.
COT Index (N)= (NC net)/(max-min) x100
🔁 Flip Detection
Flip refers to the crossovers between long% and short%, indicating a change in directional bias among trader groups. When long positions exceed shorts (or vice versa), it signals a possible market flip in sentiment or trend.
For example, Pair B commercial flip is calculated as:
Long% = (Long/Open Interest)×100
Short% = (Short/Open Interest)×100
Flip = Long%−Short%
A bullish flip occurs when long% overtakes short%, and vice versa for a bearish flip. These flips often precede price trend changes or confirm sentiment breakouts.
Flip captures how far current positioning deviates from historical norms — highlighting periods of institutional overconfidence or exhaustion, often leading to significant market turns.
This combination offers a multi-layered edge for identifying when smart money is flipping direction, and whether that flip has strong conviction or is likely to fade.
..........................................................................................................................................................

Multi-Timeframe Closures with Signals month week dayMulti-Timeframe Price Anchoring Indicator (Monthly, Weekly, Daily)
This indicator provides a powerful visual framework for analyzing price action across three major timeframes: monthly, weekly, and daily. It plots the closing prices of each timeframe directly on the chart to help traders assess where current price stands in relation to significant historical levels.
🔍 Core Features:
Monthly, Weekly, and Daily Close Lines: Automatically updated at the start of each new period.
Color-coded Price Anchors: Each timeframe is visually distinct for fast interpretation.
Multi-timeframe Awareness: Helps you identify trend alignment or divergence across different time horizons.
Long & Short Bias Signals: The script can optionally display long or short suggestions based on where the current price stands relative to the anchored closing prices.
📈 How to Use:
Trend Confirmation: If price is consistently above all three levels, it signals a strong bullish trend (potential long bias). If it’s below, the opposite applies (short bias).
Reversal or Pullback Zones: When price becomes extended far above/below the monthly and weekly closes, it may suggest overbought/oversold conditions and the possibility of a reversal or retracement.
Intraday Alignment: Useful for traders who want to enter positions on lower timeframes while being aware of higher timeframe trends.
This indicator is ideal for swing traders, day traders, and position traders who want to anchor their decisions to meaningful multi-timeframe reference points.

Hippo Battlefield - Bulls VS Bears 20 bars## Hippo Battlefield – Bulls VS Bears (20 Bars)
**What it is**
A multi-dimensional momentum-and-sentiment oscillator that combines classic Bull/Bear Power with ATR- or peak-normalization, then layers on RSI and MACD-derived metrics into:
1. **A colored bar series** showing net Bull+Bear Power strength over the last 20 bars,
2. **A dynamic table** of each of those 20 BBP values (grouped into four 5-bar “quartals”), with symbols, per-bar change, and rolling averages, and
3. **A composite “Weighted BBP” histogram** blending normalized RSI, MACD, and BBP into a single view.
---
### Key Inputs
- **Length (EMA)** – look-back for the underlying EMA (default 60)
- **Normalization Length** – look-back window for peak-normalization (default 60)
- **Use ATR for Norm.** – toggle ATR-based normalization vs. highest-abs(BBP)
- **Show Tables** – toggle the bottom-right 21×11 grid of raw and average BBP values
---
### What You See
#### 1. Colored Bars (Overlay = false)
- Bars are colored by normalized BBP intensity:
- Extreme Bull (≥+10): deep blue
- Strong Bull (+5 to +10): green/yellow
- Weak Bull (+0 to +5): dark green
- Weak Bear (–0 to –5): dark red
- Strong Bear (–5 to –10): pink/red
- Extreme Bear (<–10): magenta
#### 2. Bottom-Right Table (20 Bars of Data)
- Divided into four columns (0–4, 5–9, 10–14, 15–19 bars ago) and one “average” row.
- Each cell shows:
1. Bar index (1–20),
2. Normalized BBP value (to four decimals),
3. Direction symbol (↑/↓/=),
4. Bar-to-bar change (± value),
5. A separator “|”.
- At the very bottom, each column’s 5-bar average is displayed as “Avg: X.XXXX” with a dot marker.
#### 3. Top-Center Mini-Table
- When ≥20 bars have elapsed, shows the date at 20 bars ago and the average BBP across the full 20-bar window.
#### 4. Normalized RSI Line
- Rescales the classic 14-period RSI into a –20…+20 band to align with BBP.
#### 5. MACD Lines (Hidden) & Composite Histogram
- MACD and signal lines are calculated but not plotted by default.
- A “Weighted BBP” histogram combines:
- 20% normalized RSI,
- 20% average of (MACD + signal + normalized BBP),
- 60% normalized BBP
- Plotted as columns, color-coded by strength using the same palette as the main bars.
#### 6. Middle Reference Line
- A horizontal zero line to anchor over/under-zero readings.
---
### How to Use It
- **Trend confirmation**: Strong blue/green bars alongside a rising histogram suggest bull conviction; strong reds/magentas signal bear dominance.
- **Divergence spotting**: Watch for price making new highs/lows while BBP or the histogram fails to follow.
- **Quartal analysis**: The 5-bar group averages can reveal whether recent momentum is accelerating or waning.
- **Cross-indicator weighting**: Because RSI, MACD, and raw BBP all feed into the final histogram, you get a smoothed, blended view of momentum shifts.
---
**Tip:** Tweak the EMA and normalization length to suit your preferred timeframe (e.g. shorter for intraday scalps, longer for swing trades). Enable/disable the table if you prefer a cleaner pane.

SuperTrade Ichimoku Cloud StrategyUnlike SuperTrade's Super Trend the Ichimoku Cloud Strategy is a trend-following system derived from the Ichimoku Kinko Hyo indicator. It helps identify market direction, momentum, and potential support/resistance zones. This strategy uses key components of the Ichimoku Cloud to determine bullish or bearish trends and executes trades accordingly.
🔍 Key Components Used
Conversion Line (Tenkan-sen) – short-term average (9-period Donchian midpoint by default)
Base Line (Kijun-sen) – medium-term average (26-period Donchian midpoint)
Leading Span A (Senkou Span A) – average of Conversion Line and Base Line, plotted forward by 26 periods.
Leading Span B (Senkou Span B) – 52-period Donchian midpoint, plotted forward by 26 periods.
Lagging Span (Chikou Span) – current close price, plotted backward by 26 periods (for visual reference only in this version).
The cloud (Kumo) is the area between Leading Span A and B, representing trend direction and potential support/resistance.
📈 Entry Rules (Buy Condition)
A long trade is entered when:
LeadLine1 > LeadLine2 → This implies a bullish cloud.
Close > LeadLine1 and Close > LeadLine2 → The price is trading above the cloud, confirming upward momentum.
This combination indicates a strong bullish trend, so the strategy enters a long position.
📉 Exit Rules (Sell Condition / Close Position)
The long trade is closed when:
LeadLine1 < LeadLine2 → This implies a bearish cloud.
Close < LeadLine1 and Close < LeadLine2 → The price has fallen below the cloud, signaling trend weakness or reversal.
This confirms a bearish trend, prompting the strategy to exit the long position.
✅ Must-Have Elements in This Strategy
Entry Logic – based on price position relative to the cloud and cloud direction.
Exit Logic – closes the position when price shifts to a bearish trend.
Overlay Enabled – plotted over price for visual confirmation of signals.
Dynamic Parameters – inputs for conversion/base/cloud lengths and displacement.
Visualization – plots all Ichimoku components including cloud fill for clarity.
No Shorting Logic Yet – this version only handles long trades; shorting can be added optionally.
No Stop-Loss or Take-Profit – trades are closed purely based on Ichimoku trend reversal.

Vol Spike + Super Trend by Ralpinoy
DESCRIPTION:
A combination of trend indicators in one with and Volume Spikes and some personal touch
A trend-following band built off w ATR. When price closes above the upper band, it flips “Bullish,” and when it closes below the lower band, it flips “Bearish.”
Always remember that the Green Band (UP trending) "TATAAS ang price in Tagalog" then when the Red band its (DOWN Trending) "PAGBABA".
Buy signal when the band flips from red → green; Sell signal when it flips green → red.
Flags bars where volume is “X times” above its moving average.
Additional filters (local highs/lows, hammer/shooter candles, same-color closes) let you only highlight truly significant volume bursts.
Bullish spike = orange circle below bar; Bearish spike = orange circle above bar.
HOW DOES THIS WORKS
ATR & Bands:
The script computes a smoothed ATR.
Upper band = (HL2 − Multiplier·ATR), Lower band = (HL2 + Multiplier·ATR).
Bands “trail” price, flipping direction only on a clear close beyond them—this helps keep you in strong trends and avoids whipsaws.
TREND LOGIC
A simple state variable (trend) holds +1 or –1.
When price closes above the prior lower-band, trend flips to +1; when it closes below the prior upper-band, it flips to –1.
Volume Spike Logic:
volume > MA(volume)×Multiplier flags extreme activity.
Optional “only valid highs & lows,” “only hammers/shooters,” and “same-color” filters give you cleaner, more actionable spikes.
READING THE SIGNALS
Stay long while SuperTrend is green.
Stay short (or stay out of longs) while SuperTrend is red.
Entry Triggers
Buy: SuperTrend flips red→green and prints a “GREEN DOT” label on the band.
Sell: SuperTrend flips green→red and prints a “RED DOT” label.
Volume Spike Confluence
A bullish volume spike (circle below bar) near a SuperTrend flip adds conviction to a long entry.
A bearish volume spike near a down-trend flip adds conviction to a short.
Exits & Stops
A common stop-loss is just beyond the opposite SuperTrend band.
You can also exit when the SuperTrend flips back (i.e. you trade only from flip→next flip).
BEST PRACTICES AND APPLICATIONS
Timeframes: SuperTrend is reliable on 1 H, 4 H, Daily charts. On 1 min/5 min, increase the ATR period or multiplier to reduce noise.
Multipliers:
ATR Multiplier 2–3 for faster flips, 4–5 for more conservative signals.
Volume Multiplier 1.5–2 for catching strong spikes, higher for only extreme activity.
Load the script and toggle only the SuperTrend on. Watch how it trails price.
Activate volume spikes and see which bars light up—note whether they line up with trend flips.
Practice on a demo account: enter on the flip + a confirming volume spike, stop just beyond the opposite band, and target a multiple of your risk ex.x2 (just do it)
With this combo you get a visual, rules-based trend system plus a volume filter to help you catch powerful, momentum-backed moves.
Enjoy, and let me know how does it works for you! Dont be shy to like and comment this indicator, Ralpinoy

Dskyz (DAFE) Adaptive Regime - Quant Machine ProDskyz (DAFE) Adaptive Regime - Quant Machine Pro:
Buckle up for the Dskyz (DAFE) Adaptive Regime - Quant Machine Pro, is a strategy that’s your ultimate edge for conquering futures markets like ES, MES, NQ, and MNQ. This isn’t just another script—it’s a quant-grade powerhouse, crafted with precision to adapt to market regimes, deliver multi-factor signals, and protect your capital with futures-tuned risk management. With its shimmering DAFE visuals, dual dashboards, and glowing watermark, it turns your charts into a cyberpunk command center, making trading as thrilling as it is profitable.
Unlike generic scripts clogging up the space, the Adaptive Regime is a DAFE original, built from the ground up to tackle the chaos of futures trading. It identifies market regimes (Trending, Range, Volatile, Quiet) using ADX, Bollinger Bands, and HTF indicators, then fires trades based on a weighted scoring system that blends candlestick patterns, RSI, MACD, and more. Add in dynamic stops, trailing exits, and a 5% drawdown circuit breaker, and you’ve got a system that’s as safe as it is aggressive. Whether you’re a newbie or a prop desk pro, this strat’s your ticket to outsmarting the markets. Let’s break down every detail and see why it’s a must-have.
Why Traders Need This Strategy
Futures markets are a gauntlet—fast moves, volatility spikes (like the April 28, 2025 NQ 1k-point drop), and institutional traps that punish the unprepared. Meanwhile, platforms are flooded with low-effort scripts that recycle old ideas with zero innovation. The Adaptive Regime stands tall, offering:
Adaptive Intelligence: Detects market regimes (Trending, Range, Volatile, Quiet) to optimize signals, unlike one-size-fits-all scripts.
Multi-Factor Precision: Combines candlestick patterns, MA trends, RSI, MACD, volume, and HTF confirmation for high-probability trades.
Futures-Optimized Risk: Calculates position sizes based on $ risk (default: $300), with ATR or fixed stops/TPs tailored for ES/MES.
Bulletproof Safety: 5% daily drawdown circuit breaker and trailing stops keep your account intact, even in chaos.
DAFE Visual Mastery: Pulsing Bollinger Band fills, dynamic SL/TP lines, and dual dashboards (metrics + position) make signals crystal-clear and charts a work of art.
Original Craftsmanship: A DAFE creation, built with community passion, not a rehashed clone of generic code.
Traders need this because it’s a complete, adaptive system that blends quant smarts, user-friendly design, and DAFE flair. It’s your edge to trade with confidence, cut through market noise, and leave the copycats in the dust.
Strategy Components
1. Market Regime Detection
The strategy’s brain is its ability to classify market conditions into five regimes, ensuring signals match the environment.
How It Works:
Trending (Regime 1): ADX > 20, fast/slow EMA spread > 0.3x ATR, HTF RSI > 50 or MACD bullish (htf_trend_bull/bear).
Range (Regime 2): ADX < 25, price range < 3% of close, no HTF trend.
Volatile (Regime 3): BB width > 1.5x avg, ATR > 1.2x avg, HTF RSI overbought/oversold.
Quiet (Regime 4): BB width < 0.8x avg, ATR < 0.9x avg.
Other (Regime 5): Default for unclear conditions.
Indicators: ADX (14), BB width (20), ATR (14, 50-bar SMA), HTF RSI (14, daily default), HTF MACD (12,26,9).
Why It’s Brilliant:
Regime detection adapts signals to market context, boosting win rates in trending or volatile conditions.
HTF RSI/MACD add a big-picture filter, rare in basic scripts.
Visualized via gradient background (green for Trending, orange for Range, red for Volatile, gray for Quiet, navy for Other).
2. Multi-Factor Signal Scoring
Entries are driven by a weighted scoring system that combines candlestick patterns, trend, momentum, and volume for robust signals.
Candlestick Patterns:
Bullish: Engulfing (0.5), hammer (0.4 in Range, 0.2 else), morning star (0.2), piercing (0.2), double bottom (0.3 in Volatile, 0.15 else). Must be near support (low ≤ 1.01x 20-bar low) with volume spike (>1.5x 20-bar avg).
Bearish: Engulfing (0.5), shooting star (0.4 in Range, 0.2 else), evening star (0.2), dark cloud (0.2), double top (0.3 in Volatile, 0.15 else). Must be near resistance (high ≥ 0.99x 20-bar high) with volume spike.
Logic: Patterns are weighted higher in specific regimes (e.g., hammer in Range, double bottom in Volatile).
Additional Factors:
Trend: Fast EMA (20) > slow EMA (50) + 0.5x ATR (trend_bull, +0.2); opposite for trend_bear.
RSI: RSI (14) < 30 (rsi_bull, +0.15); > 70 (rsi_bear, +0.15).
MACD: MACD line > signal (12,26,9, macd_bull, +0.15); opposite for macd_bear.
Volume: ATR > 1.2x 50-bar avg (vol_expansion, +0.1).
HTF Confirmation: HTF RSI < 70 and MACD bullish (htf_bull_confirm, +0.2); RSI > 30 and MACD bearish (htf_bear_confirm, +0.2).
Scoring:
bull_score = sum of bullish factors; bear_score = sum of bearish. Entry requires score ≥ 1.0.
Example: Bullish engulfing (0.5) + trend_bull (0.2) + rsi_bull (0.15) + htf_bull_confirm (0.2) = 1.05, triggers long.
Why It’s Brilliant:
Multi-factor scoring ensures signals are confirmed by multiple market dynamics, reducing false positives.
Regime-specific weights make patterns more relevant (e.g., hammers shine in Range markets).
HTF confirmation aligns with the big picture, a quant edge over simplistic scripts.
3. Futures-Tuned Risk Management
The risk system is built for futures, calculating position sizes based on $ risk and offering flexible stops/TPs.
Position Sizing:
Logic: Risk per trade (default: $300) ÷ (stop distance in points * point value) = contracts, capped at max_contracts (default: 5). Point value = tick value (e.g., $12.5 for ES) * ticks per point (4) * contract multiplier (1 for ES, 0.1 for MES).
Example: $300 risk, 8-point stop, ES ($50/point) → 0.75 contracts, rounded to 1.
Impact: Precise sizing prevents over-leverage, critical for micro contracts like MES.
Stops and Take-Profits:
Fixed: Default stop = 8 points, TP = 16 points (2:1 reward/risk).
ATR-Based: Stop = 1.5x ATR (default), TP = 3x ATR, enabled via use_atr_for_stops.
Logic: Stops set at swing low/high ± stop distance; TPs at 2x stop distance from entry.
Impact: ATR stops adapt to volatility, while fixed stops suit stable markets.
Trailing Stops:
Logic: Activates at 50% of TP distance. Trails at close ± 1.5x ATR (atr_multiplier). Longs: max(trail_stop_long, close - ATR * 1.5); shorts: min(trail_stop_short, close + ATR * 1.5).
Impact: Locks in profits during trends, a game-changer in volatile sessions.
Circuit Breaker:
Logic: Pauses trading if daily drawdown > 5% (daily_drawdown = (max_equity - equity) / max_equity).
Impact: Protects capital during black swan events (e.g., April 27, 2025 ES slippage).
Why It’s Brilliant:
Futures-specific inputs (tick value, multiplier) make it plug-and-play for ES/MES.
Trailing stops and circuit breaker add pro-level safety, rare in off-the-shelf scripts.
Flexible stops (ATR or fixed) suit different trading styles.
4. Trade Entry and Exit Logic
Entries and exits are precise, driven by bull_score/bear_score and protected by drawdown checks.
Entry Conditions:
Long: bull_score ≥ 1.0, no position (position_size <= 0), drawdown < 5% (not pause_trading). Calculates contracts, sets stop at swing low - stop points, TP at 2x stop distance.
Short: bear_score ≥ 1.0, position_size >= 0, drawdown < 5%. Stop at swing high + stop points, TP at 2x stop distance.
Logic: Tracks entry_regime for PNL arrays. Closes opposite positions before entering.
Exit Conditions:
Stop-Loss/Take-Profit: Hits stop or TP (strategy.exit).
Trailing Stop: Activates at 50% TP, trails by ATR * 1.5.
Emergency Exit: Closes if price breaches stop (close < long_stop_price or close > short_stop_price).
Reset: Clears stop/TP prices when flat (position_size = 0).
Why It’s Brilliant:
Score-based entries ensure multi-factor confirmation, filtering out weak signals.
Trailing stops maximize profits in trends, unlike static exits in basic scripts.
Emergency exits add an extra safety layer, critical for futures volatility.
5. DAFE Visuals
The visuals are pure DAFE magic, blending function with cyberpunk flair to make signals intuitive and charts stunning.
Shimmering Bollinger Band Fill:
Display: BB basis (20, white), upper/lower (green/red, 45% transparent). Fill pulses (30–50 alpha) by regime, with glow (60–95 alpha) near bands (close ≥ 0.995x upper or ≤ 1.005x lower).
Purpose: Highlights volatility and key levels with a futuristic glow.
Visuals make complex regimes and signals instantly clear, even for newbies.
Pulsing effects and regime-specific colors add a DAFE signature, setting it apart from generic scripts.
BB glow emphasizes tradeable levels, enhancing decision-making.
Chart Background (Regime Heatmap):
Green — Trending Market: Strong, sustained price movement in one direction. The market is in a trend phase—momentum follows through.
Orange — Range-Bound: Market is consolidating or moving sideways, with no clear up/down trend. Great for mean reversion setups.
Red — Volatile Regime: High volatility, heightened risk, and larger/faster price swings—trade with caution.
Gray — Quiet/Low Volatility: Market is calm and inactive, with small moves—often poor conditions for most strategies.
Navy — Other/Neutral: Regime is uncertain or mixed; signals may be less reliable.
Bollinger Bands Glow (Dynamic Fill):
Neon Red Glow — Warning!: Price is near or breaking above the upper band; momentum is overstretched, watch for overbought conditions or reversals.
Bright Green Glow — Opportunity!: Price is near or breaking below the lower band; market could be oversold, prime for bounce or reversal.
Trend Green Fill — Trending Regime: Fills between bands with green when the market is trending, showing clear momentum.
Gold/Yellow Fill — Range Regime: Fills with gold/aqua in range conditions, showing the market is sideways/oscillating.
Magenta/Red Fill — Volatility Spike: Fills with vivid magenta/red during highly volatile regimes.
Blue Fill — Neutral/Quiet: A soft blue glow for other or uncertain market states.
Moving Averages:
Display: Blue fast EMA (20), red slow EMA (50), 2px.
Purpose: Shows trend direction, with trend_dir requiring ATR-scaled spread.
Dynamic SL/TP Lines:
Display: Pulsing colors (red SL, green TP for Trending; yellow/orange for Range, etc.), 3px, with pulse_alpha for shimmer.
Purpose: Tracks stops/TPs in real-time, color-coded by regime.
6. Dual Dashboards
Two dashboards deliver real-time insights, making the strat a quant command center.
Bottom-Left Metrics Dashboard (2x13):
Metrics: Mode (Active/Paused), trend (Bullish/Bearish/Neutral), ATR, ATR avg, volume spike (YES/NO), RSI (value + Oversold/Overbought/Neutral), HTF RSI, HTF trend, last signal (Buy/Sell/None), regime, bull score.
Display: Black (29% transparent), purple title, color-coded (green for bullish, red for bearish).
Purpose: Consolidates market context and signal strength.
Top-Right Position Dashboard (2x7):
Metrics: Regime, position side (Long/Short/None), position PNL ($), SL, TP, daily PNL ($).
Display: Black (29% transparent), purple title, color-coded (lime for Long, red for Short).
Purpose: Tracks live trades and profitability.
Why It’s Brilliant:
Dual dashboards cover market context and trade status, a rare feature.
Color-coding and concise metrics guide beginners (e.g., green “Buy” = go).
Real-time PNL and SL/TP visibility empower disciplined trading.
7. Performance Tracking
Logic: Arrays (regime_pnl_long/short, regime_win/loss_long/short) track PNL and win/loss by regime (1–5). Updated on trade close (barstate.isconfirmed).
Purpose: Prepares for future adaptive thresholds (e.g., adjust bull_score min based on regime performance).
Why It’s Brilliant: Lays the groundwork for self-optimizing logic, a quant edge over static scripts.
Key Features
Regime-Adaptive: Optimizes signals for Trending, Range, Volatile, Quiet markets.
Futures-Optimized: Precise sizing for ES/MES with tick-based risk inputs.
Multi-Factor Signals: Candlestick patterns, RSI, MACD, and HTF confirmation for robust entries.
Dynamic Exits: ATR/fixed stops, 2:1 TPs, and trailing stops maximize profits.
Safe and Smart: 5% drawdown breaker and emergency exits protect capital.
DAFE Visuals: Shimmering BB fill, pulsing SL/TP, and dual dashboards.
Backtest-Ready: Fixed qty and tick calc for accurate historical testing.
How to Use
Add to Chart: Load on a 5min ES/MES chart in TradingView.
Configure Inputs: Set instrument (ES/MES), tick value ($12.5/$1.25), multiplier (1/0.1), risk ($300 default). Enable ATR stops for volatility.
Monitor Dashboards: Bottom-left for regime/signals, top-right for position/PNL.
Backtest: Run in strategy tester to compare regimes.
Live Trade: Connect to Tradovate or similar. Watch for slippage (e.g., April 27, 2025 ES issues).
Replay Test: Try April 28, 2025 NQ drop to see regime shifts and stops.
Disclaimer
Trading futures involves significant risk of loss and is not suitable for all investors. Past performance does not guarantee future results. Backtest results may differ from live trading due to slippage, fees, or market conditions. Use this strategy at your own risk, and consult a financial advisor before trading. Dskyz (DAFE) Trading Systems is not responsible for any losses incurred.
Backtesting:
Frame: 2023-09-20 - 2025-04-29
Slippage: 3
Fee Typical Range (per side, per contract)
CME Exchange $1.14 – $1.20
Clearing $0.10 – $0.30
NFA Regulatory $0.02
Firm/Broker Commis. $0.25 – $0.80 (retail prop)
TOTAL $1.60 – $2.30 per side
Round Turn: (enter+exit) = $3.20 – $4.60 per contract
Final Notes
The Dskyz (DAFE) Adaptive Regime - Quant Machine Pro is more than a strategy—it’s a revolution. Crafted with DAFE’s signature precision, it rises above generic scripts with adaptive regimes, quant-grade signals, and visuals that make trading a thrill. Whether you’re scalping MES or swinging ES, this system empowers you to navigate markets with confidence and style. Join the DAFE crew, light up your charts, and let’s dominate the futures game!
(This publishing will most likely be taken down do to some miscellaneous rule about properly displaying charting symbols, or whatever. Once I've identified what part of the publishing they want to pick on, I'll adjust and repost.)
Use it with discipline. Use it with clarity. Trade smarter.
**I will continue to release incredible strategies and indicators until I turn this into a brand or until someone offers me a contract.
Created by Dskyz, powered by DAFE Trading Systems. Trade smart, trade bold.

Price Change Sentiment Index [tradeviZion]Price Change Sentiment Index
A technical indicator that measures price changes relative to the day's range.
Indicator Overview
Normalizes price changes on a 0-100 scale
Uses a smoothing period for signal clarity
Shows potential overbought/oversold conditions
Inputs
Smoothing Period (default: 3)
Show Background Colors (on/off)
Overbought Level (default: 75)
Oversold Level (default: 25)
Reading the Indicator
Values above 75: Price change showing strong upward movement
Values below 25: Price change showing strong downward movement
Around 50: Neutral price movement
Technical Details
// Core calculation
changePct = (currClose - prevClose) / (high - low)
normalized = 50 + (changePct * 50)
smoothedNormalized = ta.sma(normalizedClamped, smoothingPeriod)
Usage Notes
Best used with other technical analysis tools
Adjustable smoothing period affects signal sensitivity
Background colors highlight extreme readings
Works on any timeframe
Settings Guide
Smoothing Period:
- Lower values (1-3): More responsive
- Higher values (5-10): Smoother output
Visual Settings: Toggle background colors
Levels: Adjust overbought/oversold thresholds
This indicator is a technical analysis tool. Please conduct your own research and testing before use.
RM Market StructureThis indicator helps you identify market structure by plotting swing highs and lows (HH, LH, HL, LL), and BOS/CHOCH. 4 swing lengths can be plotted on the chart.

ICT Macro Zone Boxes w/ Individual H/L Tracking v3.1ICT Macro Zones (Grey Box Version
This indicator dynamically highlights key intraday time-based macro sessions using a clean, minimalistic grey box overlay, helping traders align with institutional trading cycles. Inspired by ICT (Inner Circle Trader) concepts, it tracks real-time highs and lows for each session and optionally extends the zone box after the session ends — making it a precision tool for intraday setups, order flow analysis, and macro-level liquidity sweeps.
### 🔍 **What It Does**
- Plots **six predefined macro sessions** used in Smart Money Concepts:
- AM Macro (09:50–10:10)
- London Close (10:50–11:10)
- Lunch Macro (11:30–13:30)
- PM Macro (14:50–15:10)
- London SB (03:00–04:00)
- PM SB (15:00–16:00)
- Each zone:
- **Tracks high and low dynamically** throughout the session.
- **Draws a consistent grey shaded box** to visualize price boundaries.
- **Displays a label** at the first bar of the session (optional).
- **Optionally extends** the box to the right after the session closes.
### 🧠 **How It Works**
- Uses Pine Script arrays to define each session’s time window, label, and color.
- Detects session entry using `time()` within a New York timezone context.
- High/Low values are updated per bar inside the session window.
- Once a session ends, the box is optionally closed and fixed in place.
- All visual zones use a standardized grey tone for clarity and consistency across charts.
### 🛠️ **Settings**
- **Shade Zone High→Low:** Enable/disable the grey macro box.
- **Extend Box After Session:** Keep the zone visible after it ends.
- **Show Entry Label:** Display a label at the start of each session.
### 🎯 **Why This Script is Unique**
Unlike basic session markers or colored backgrounds, this tool:
- Focuses on **macro moments of liquidity and reversal**, not just open/close times.
- Uses **per-session logic** to individually track price behavior inside key time windows.
- Supports **real-time high/low tracking and clean zone drawing**, ideal for Smart Money and ICT-style strategies.
Perfect — based on your list, here's a **bundle-style description** that not only explains the function of each script but also shows how they **work together** in a Smart Money/ICT workflow. This kind of cross-script explanation is exactly what TradingView wants to see to justify closed-source mashups or interdependent tools.
---
📚 ICT SMC Toolkit — Script Integration Guide
This set of advanced Smart Money Concept (SMC) tools is designed for traders who follow ICT-based methodologies, combining liquidity theory, time-based precision, and engineered confluences for high-probability trades. Each indicator is optimized to work both independently and synergistically, forming a comprehensive trading framework.
---
First FVG Custom Time Range
**Purpose:**
Plots the **first Fair Value Gap (FVG)** that appears within a defined session (e.g., NY Kill Zone, Custom range). Includes optional retest alerts.
**Best Used With:**
- Use with **ICT Macro Zones (Grey Box Version)** to isolate FVGs during high-probability times like AM Macro or PM SB.
- Combine with **Liquidity Levels** to assess whether FVGs form near swing points or liquidity voids.
---
ICT SMC Liquidity Grabs and OB s
**Purpose:**
Detects **liquidity grabs** (stop hunts above/below swing highs/lows) and **bullish/bearish order blocks**. Includes optional Fibonacci OTE levels for sniper entries.
**Best Used With:**
- Use with **ICT Turtle Soup (Reversal)** for confirmation after a liquidity grab.
- Combine with **Macro Zones** to catch order blocks forming inside timed macro windows.
- Match with **Smart Swing Levels** to confirm structure breaks before entry.
ICT SMC Liquidity Levels (Smart Swing Lows)
**Purpose:**
Automatically marks swing highs/lows based on user-defined lookbacks. Tracks whether those levels have been breached or respected.
**Best Used With:**
- Combine with **Turtle Soup** to detect if a swing level was swept, then reversed.
- Use with **Liquidity Grabs** to confirm a grab occurred at a meaningful structural point.
- Align with **Macro Zones** to understand when liquidity events occur within macro session timing.
ICT Turtle Soup (Liquidity Reversal)
**Purpose:**
Implements the classic ICT Turtle Soup model. Looks for swing failure and quick reversals after a liquidity sweep — ideal for catching traps.
Best Used With:
- Confirm with **Liquidity Grabs + OBs** to identify institutional activity at the reversal point.
- Use **Liquidity Levels** to ensure the reversal is happening at valid previous swing highs/lows.
- Amplify probability when pattern appears during **Macro Zones** or near the **First FVG**.
ICT Turtle Soup Ultimate V2
**Purpose:**
An enhanced, multi-layer version of the Turtle Soup setup that includes built-in liquidity checks, OTE levels, structure validation, and customizable visual output.
**Best Used With:**
- Use as an **entry signal generator** when other indicators (e.g., OBs, liquidity grabs) are aligned.
- Pair with **Macro Zones** for high-precision timing.
- Combine with **First FVG** to anticipate price rebalancing before explosive moves.
---
## 🧠 Workflow Example:
1. **Start with Macro Zones** to focus only on institutional trading windows.
2. Look for **Liquidity Grabs or Swing Sweeps** around key highs/lows.
3. Check for a **Turtle Soup Reversal** or **Order Block Reaction** near that level.
4. Confirm confluence with a **Fair Value Gap**.
5. Execute using the **OTE level** from the Liquidity Grabs + OB script.
---
Let me know which script you want to publish first — I’ll tailor its **individual TradingView description** and flag its ideal **“Best Used With” partners** to help users see the value in your ecosystem.

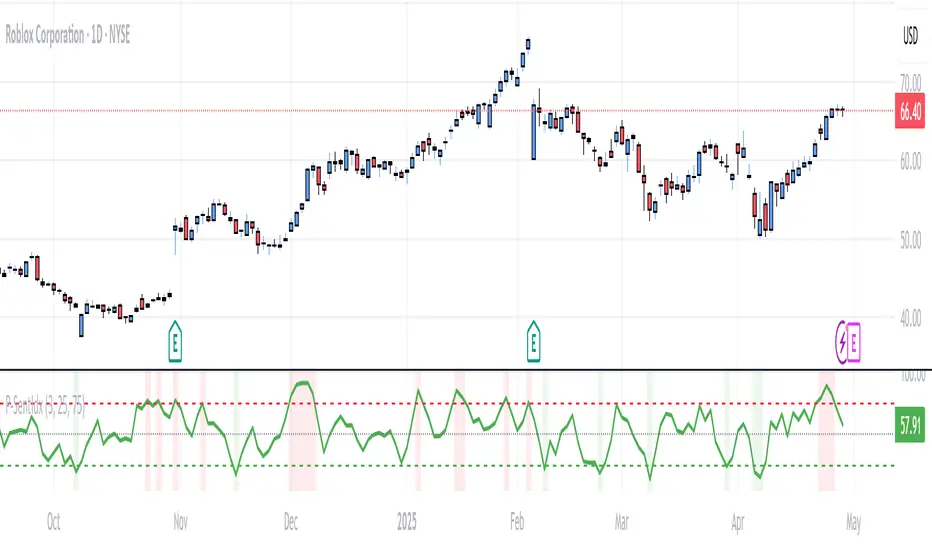
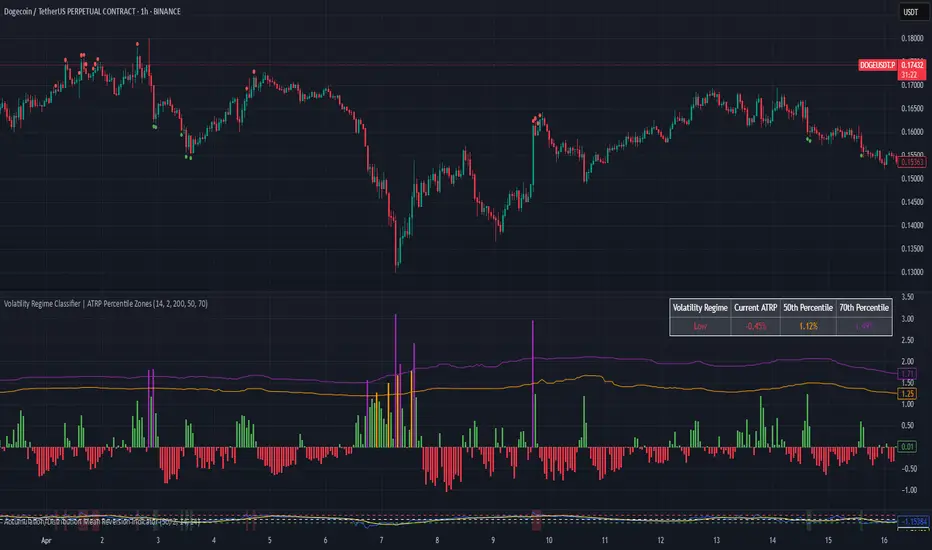
Volatility Regime Classifier | ATRP Percentile ZonesThis indicator helps you understand the current volatility environment of any asset by comparing recent ATR-based values to its historical range.
It defines four regimes:
🔴 Low Volatility: Volatility is decreasing
🟢 Normal: Volatility is increasing but still below average
🟠 High: Volatility is elevated
🟣 Extreme: Volatility is very high compared to recent history
⚙️ How it works
We calculate the Average True Range (ATR) as a percentage of price (ATRP), then compare a short-term ATR to a longer-term one. Their difference shows whether volatility is picking up or slowing down.
To make the signal more adaptive, we look at the distribution of recent volatility over a rolling window. We compute the 50th and 70th percentiles of that history to set dynamic thresholds.
About distribution & percentiles
Volatility in financial markets doesn't follow a normal (Gaussian) distribution, it's often skewed, with sudden spikes and fat tails. That means fixed thresholds (like "ATR > 20") can be misleading or irrelevant across assets and timeframes.
Using percentiles solves this:
The 50th percentile marks the middle of the recent volatility range.
The 70th percentile captures a zone where volatility is unusually high, but not too rare, which keeps the signal usable and not overly sensitive.
These levels offer a balance:
⚖️ not too reactive, not too slow — just enough to highlight meaningful shifts.
✅ Use cases
Spot changes in market conditions
Filter or adapt strategies depending on the regime
Adjust position sizing and risk dynamically
LRC FISHE20 RANGE ALERTSauto range calculation based on high low of last 14 bar keep entry candle high low as sl on closing basis

Full Breakout + Breakdown Signal with 5 LabelsThis script is a comprehensive breakout and breakdown detector designed for traders who want to monitor both long and short opportunities. It identifies when price breaks above resistance (bullish breakout) or below support (bearish breakdown), using volume confirmation and optional multi-timeframe validation for higher accuracy.
Five distinct signal states are visually displayed directly on the chart as color-coded labels: Breakout, Near Breakout, Neutral, Near Breakdown, and Breakdown. Bullish signals appear above the price bar, while bearish signals are plotted below, making chart interpretation fast and intuitive.
Alerts are integrated for confirmed breakouts and breakdowns, with webhook-ready JSON messages. This makes it ideal for use with automated systems, email alerts, or daily summary scripts.
Market sentiment overlays based on the S&P 500 and Bitcoin trend provide broader context to filter trades during bullish or bearish macro conditions. These are shown via background color shifts based on 50-day moving average crossovers.
All parameters—lookback periods, volume thresholds, and sentiment settings—are fully customizable. Whether you’re trading momentum breakouts or anticipating reversals, this tool provides a clear, visual edge for decision-making.

3-Day Breakout Strategy with Trend Change Exit//@version=5
strategy("3-Day Breakout Strategy with Trend Change Exit", overlay=true, default_qty_type=strategy.percent_of_equity, default_qty_value=100)
// === Calculate 3-day high/low (excluding current bar) ===
high3 = ta.highest(high , 3)
low3 = ta.lowest(low , 3)
// === Entry conditions ===
longEntry = close > high3
shortEntry = close < low3
// === Track position state ===
isLong = strategy.position_size > 0
isShort = strategy.position_size < 0
wasLong = nz(strategy.position_size > 0)
wasShort = nz(strategy.position_size < 0)
// === Exit conditions ===
// Exit on trend reversal (new signal)
longExit = shortEntry // Exit long position when a short signal occurs
shortExit = longEntry // Exit short position when a long signal occurs
// === Execute entries ===
buySignal = longEntry and not isLong and not isShort
sellSignal = shortEntry and not isLong and not isShort
if (buySignal)
strategy.entry("Long", strategy.long)
if (sellSignal)
strategy.entry("Short", strategy.short)
// === Execute exits on opposite signal (trend change) ===
if (isLong and longExit)
strategy.close("Long")
if (isShort and shortExit)
strategy.close("Short")
// === Exit markers (on actual exit bar only) ===
exitLongSignal = wasLong and not isLong
exitShortSignal = wasShort and not isShort
// === Plot entry signals only on the entry bar ===
plotshape(buySignal, title="Buy Signal", location=location.belowbar, color=color.green, style=shape.labelup, text="BUY")
plotshape(sellSignal, title="Sell Signal", location=location.abovebar, color=color.red, style=shape.labeldown, text="SELL")
// === Plot exit signals only on the exit bar ===
plotshape(exitLongSignal, title="Exit Long", location=location.abovebar, color=color.orange, style=shape.labeldown, text="EXIT")
plotshape(exitShortSignal, title="Exit Short", location=location.belowbar, color=color.orange, style=shape.labelup, text="EXIT")

Liquidity Levels Clone - Smart Money v2Smart Money Liquidity Levels indicator, now live in your canvas.
💡 Features:
Detects equal highs/lows (stop clusters)
Plots dashed liquidity lines
Highlights sweeps (when price grabs that liquidity)

MACD Multi-Timeframe x4 (Custom Params)■About this indicator
・This indicator can display 4 MACD lines for different time frames. (Multi-time framework)
・The color of the MACD line changes when the MACD has a golden or dead cross.
All MACDs can be set individually for long time period, short time period, and signal smoothing.
All MACDs can show/hide MACD lines, signal lines, histograms, and select colors.
■Explanation of effective usage
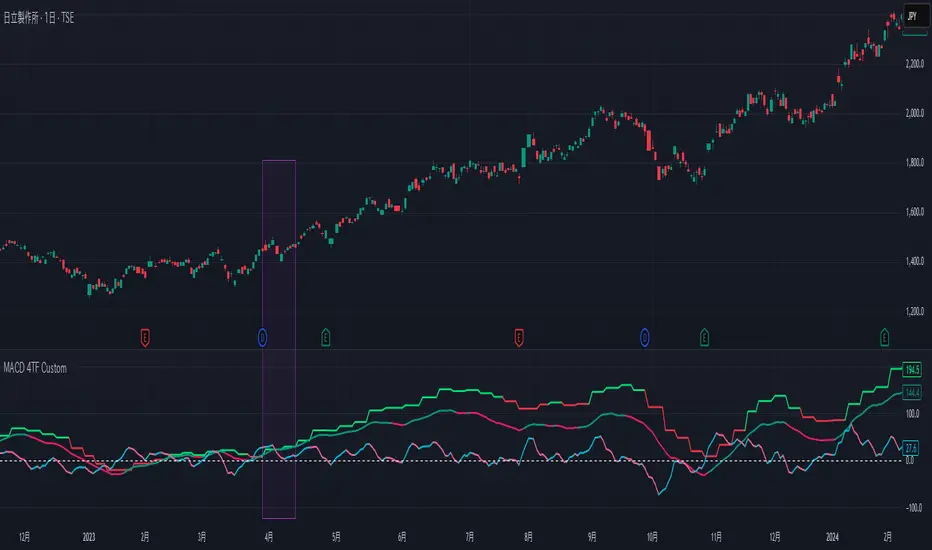
By displaying MACDs in multiple time frames, you can time the push.
For example, let's say you have three MACDs: one weekly, one daily, and one hour.
With the weekly and daily MACDs continuing to golden cross, the timing for the hourly MACD to golden cross is considered a push opportunity.
An example chart is attached below for your reference.
The area circled vertically is a push-buying opportunity.
Yellow-green: Weekly Green: Daily Light blue: Hourly
-------------------------------------------------------------------------------------------------------------
■このインジケーターについて
・このインジケーターは別の時間軸の4本のMACDを表示させることが出来ます。(マルチタイムフレームワーク)
・MACDがゴールデンクロス・デッドクロスした場合にMACDラインの色が変化します。
・全てのMACDについて個別に長期の期間・短期の期間・シグナルの平滑化を設定できます。
・全てのMACDはMACDライン・シグナルライン・ヒストグラムの表示/非表示、色の選択ができます。
■有効な使い方の説明
マルチタイムフレームでMACDを表示することで、押し目のタイミングを計ることが出来ます。
例えば、3本のMACDを1週間・1日・1時間とします。
週足と日足のMACDがゴールデンクロスを継続した状態で、1時間足のMACDがゴールデンクロスしてくるタイミングは押し目買いのチャンスと考えられます。
以下に例題のチャートを付けますので、参考にしてください。
縦に囲った辺りが押し目買いのチャンスになります。
黄緑:週足 緑:日足 水色:1時間足
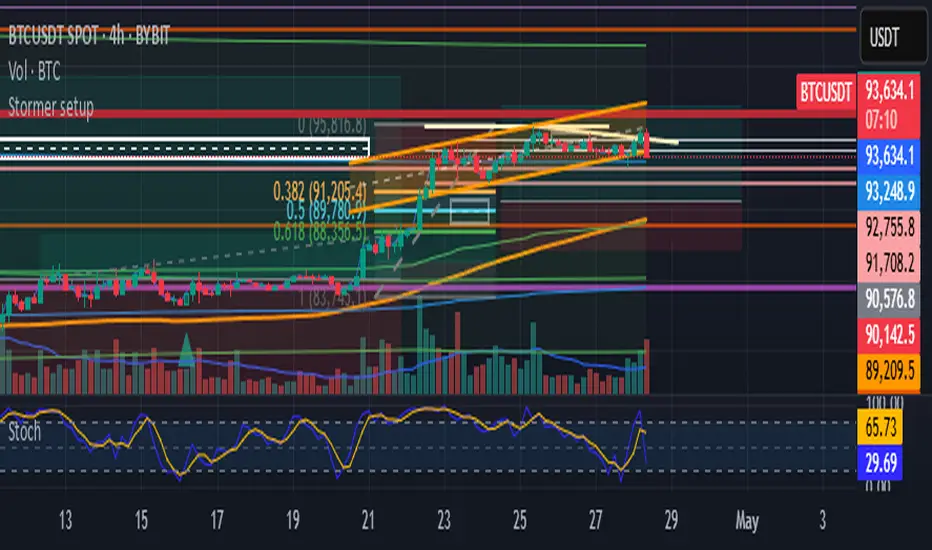
Stormer setupHere's a trading setup with reversal candle coloring and simple market structure analysis:
Based on the experienced trader Stormer (Alexandre Wolwacz), to be used with combined price action.
Key improvements added:
1. **Smart Reversal Candles**:
- Detects hammer/shooting star patterns and engulfing candles
- Colors candles based on confluence with market structure
- Teal for bullish reversals, Maroon for bearish reversals
2. **Dynamic Confluence System**:
- Uses MA trend direction to determine if SR levels should be prioritized
- Adjustable sensitivity threshold for SR proximity
- Combines price action with stochastic position
3. **Enhanced Market Structure**:
- Improved trend detection using ROC instead of slope
- Adaptive logic that uses SR levels when MA is flat
4. **Advanced Visualization**:
- Semi-transparent candle coloring preserves original colors
- Dotted SR lines with automatic cleanup
- Clear triangle markers for entries
5. **Efficiency Improvements**:
- Limited historical SR storage for better performance
- Automatic line management to prevent chart clutter
To use this enhanced version:
1. Bullish reversal candles appear teal when:
- Hammer/engulfing pattern forms
- Near support (if MA flat) or stochastic oversold
- Price above MA
2. Bearish reversal candles appear maroon when:
- Shooting star/engulfing pattern forms
- Near resistance (if MA flat) or stochastic overbought
- Price below MA
3. Signals combine all elements (MA position, stochastic, SR levels, and candle patterns) for higher probability trades
RSI + EMA + Stoch RSI ComboDescription:
This indicator combines three powerful momentum tools — RSI, EMA, and Stochastic RSI — to provide more refined entry and exit signals.
What it does:
• Calculates Relative Strength Index (RSI) and applies an Exponential Moving Average (EMA) to it for smoother trend confirmation.
• Adds Stochastic RSI (Stoch RSI) with adjustable %K and %D settings.
• Generates Buy signals when:
• Stoch RSI %K crosses above %D,
• %K is below 20,
• RSI is below 40,
• and RSI is above its EMA.
• Generates Sell signals when:
• %K crosses below %D,
• %K is above 80,
• RSI is above 60,
• and RSI is below its EMA.
• Visual elements include RSI EMA line, overbought/oversold levels, and Stoch RSI plots.
Use case:
Perfect for traders looking for a multi-indicator confirmation system. Best used on 1H or 4H timeframes, but works across all timeframes.
Alerts for Buy and Sell signals are included.
Feel free to tweak the parameters for your own strategy and market conditions!

MACD Divergence IndicatorThis MacD Divergence (redundant?) Indicator identifies bearish and bullish divergence via the histogram of the MacD relative to the price action. This is very useful for using at key levels to identify reversal opportunities. Pair's well with my "Rally Sweep...." scripts.
View my youtube for more information - www.youtube.com

IMPOSSIBLE IS INMy Curiosity about all the trading Strategies and mindset came to an end. It has cost me a lot more than money to reach to this point, but with no regrets I present you the unbeatable🚩 inevitable dream strategy that could create unbelievable a
& catastrophic changes in your whole lifetime. This has cost me far more than any material value. A taste of lost luck and merely only my passion for my trading journey. I never stopped. Thank you.
And remember one thing age is just a number. I made this being a 23 year old Guy, whose was just dreaming along Situations that were totally depressing but life has its own ways
Try these setting on one hour time frame=
🎴BB Length 27
🎴BB StdDev 1.2
🎴Basis MA Type@ SMMA (…)
🎴Source: close
🎴Offset: 3
🕦Start Date: 2018-01-01🏁05:30
🕦End Date: 2069-12-31🏁23:59
🎴ATR Length🚩10
🎴ATR Multiplier for Trailing Stop🚩1.7
🤝Properties-
🎴Initial capital- 100000
🎴Base currency USD💵
👉🏻Order size: 25% of equity
👉🏻Pyramiding: 1
🎴 COST SIMULATION:
👉🏻Commission: 0.05
🎴MARGIN:
👉🏻Margin for long positions: 25%
👉🏻Margin for short positions: 25%
🎴RECALCULATE:
👉🏻 After order is filled:✅
👉🏻On every tick:✅
🎴FILL ORDERS:
👉🏻On bar close:✅
👉🏻 Using standard OHLC✅

Synthesized Ichimoku + Global M2 DeltaCombined my point tangent ichimoku indicator with my global M2 time lag delta indicator.
How it works:
(1) select time lag range for M2 (Lag 1 & Lag 2)
(2) select width of M2 range (Scalar Multiplier)
(3) select ichimoku values: tenkan, kijun, senkou, time displacement, smoothing
Default values are what I use to track BTCUSD on the daily chart.
If you want to track other assets I recommend tinkering with the variables until it makes sense.
Coloration is determined by whether:
m2_diff > 0 or m2_diff < 0
senkou_a_new > senkou_b_new
Bright green: strong accumulation zone
Bright red: strong sell zone
Dim green: weak accumulation zone
Dim red: weak sell zone


RVOL Relative Volume – Intraday (v5 with Zones)RVOL Relative Volume – Intraday (v4)
Traffic light colour system allows Trade/No trade decision making at a glance!
Quickly spot the volume spikes that matter on your intraday charts
What it is
This indicator measures the current bar’s volume against its historical average for the same minute-of-day over the past N_ days. It helps you see at a glance whether today’s volume is below average, “cautionary,” or truly elevated—so you can focus only on the bars that matter for high-probability setups.
How it works
1.Historical buffer
Collects cumulative volume for each minute-of-day across the last N_ full trading days (plus the current session).
2.Relative Volume (rvol)
rvol = (volume so far this minute) / (average volume seen at this minute over prior N days).
3.Color coding
-Red (bar skipped) = rvol < 0.60 × average
-Yellow (caution) = 0.60 ≤ rvol < 1.25 × average
-Green (go) = rvol ≥ 1.25 × average
How to use
-Green bars are your actionable volume spikes—ideal for entries on breakouts, reversals, or key levels.
-Yellow bars flag mild pickup in activity—treat them as “watch and wait.”
-Red bars indicate low-interest periods; best to sit out until volume returns.
Inputs
Lookback Days (N) – how many prior full trading days to average (1–60).
DST Adjustment – ±1 if daylight-saving shift occurred last weekend (usually 0).
Display
Plots a histogram of rvol in its own pane.
Horizontal guides at 1.0× (average) and 2.0×.
Why it’s useful
Filters out noise during thin volume periods.
Highlights true “fuel injection” moments.
Works on any intraday timeframe (1 min–<1 day).

