FVG Zones (5-Bar Extension)FVG identifier, Only extends the FVG 5 bars to the right to keep the clutter down!
Indicators and strategies

Advanced Crypto Scalper ComboIncluded Tools (Advanced Combo):
MACD with Histogram Reversal Detection – momentum shift entry
Bollinger Band Squeeze Breakout – pre-breakout warning
ATR-Based Dynamic TP/SL – for volatility-based risk
RSI/MACD Divergence Detection – reversal confirmation
Order Block / Supply & Demand Zones – smart money zones
Features You’ll See on Chart:
Bollinger Bands and Squeeze background
MACD Cross signals with histogram confirmation
Bullish/Bearish RSI divergence detection
Dynamic Take-Profit / Stop-Loss using ATR
Visual markers for simple demand/supply zones

Key Levels (4H and Daily)Key Levels (4H and Daily)
This indicator highlights important key price levels derived from the 4-hour (4H) and daily (D) timeframes, providing traders with critical support and resistance areas. The levels are calculated using the highest highs and lowest lows over a customizable lookback period, offering a dynamic view of significant price points that could influence market movement.
Key Features:
Key Levels for 4H and Daily Timeframes:
The indicator calculates and displays the highest high and lowest low over a user-defined period for both the 4-hour and daily timeframes. This helps traders identify key support and resistance levels that could dictate the market's behavior.
Customizable Lookback Period:
Traders can adjust the lookback period (in days) for both the 4-hour and daily timeframes to reflect different market conditions. This flexibility ensures the levels are tailored to your preferred trading style and market conditions.
Horizontal Lines:
The indicator plots horizontal lines at the high and low levels for both timeframes. These levels serve as dynamic support and resistance areas and help traders monitor price action near these critical points.
Real-Time Updates:
The lines adjust automatically with each new bar, providing up-to-date key levels based on the most recent price action and trading session.
Alert Conditions:
Alerts are built-in to notify traders when the price breaks above or below these key levels. Traders can set up notifications to stay informed when significant market moves occur.
How to Use:
Support and Resistance: Use the levels as potential support and resistance areas where price could reverse. Price often reacts at these levels, providing potential trading opportunities.
Breakouts: Pay attention to breakouts above the high or below the low of these levels. A break above the 4H or daily high could indicate bullish momentum, while a break below could signal bearish trends.
Trend Confirmation: Combine these levels with other technical analysis tools to confirm the overall market trend and enhance your trading strategy.
Perfect for:
Day Traders: Use the 4-hour levels for intraday trading setups, such as potential reversals or breakouts.
Swing Traders: The daily levels provide longer-term insights, helping to identify key zones where price might pause, reverse, or break out.
Market Context: Ideal for those who want to contextualize their trades within broader timeframes, helping to understand the market’s structure at multiple time scales.
This description conveys the utility and functionality of the indicator, focusing on how it helps traders identify and monitor key levels that influence market action.
Aetherius Trend"Support indicator for trend-following with 6 configurable moving averages and a Hilo Activator for potential entry and exit points."

Ultimate Scalping DashboardIncluded Tools (Combo Strategy):
EMA 9 / 21 / 50 – for trend direction and momentum
VWAP – for intraday bias
Stochastic RSI – for overbought/oversold + reversals
Volume Spike Detector – for entry confirmation
SuperTrend – to simplify entry/exit decisions
You’ll see:
EMAs for trend
VWAP to confirm bias
SuperTrend trail
Buy/Sell signals based on momentum + volume + trend alignment

📈 RX Swing This Pine Script strategy is designed for trading Nifty options on a 4-hour chart. Here’s a breakdown of how it works:
Timeframe Enforcement: The strategy is designed to only work on a 4-hour chart. If you try to run it on any other timeframe, it will throw an error.
Inputs:
RSI length: Determines the length for the Relative Strength Index (RSI) indicator.
RSI MA Length: Determines the moving average length for smoothing the RSI.
MA Type: Allows you to choose between SMA or EMA for the RSI moving average.
Stop Loss & Take Profit: These define the exit points in percentage terms.
Capital per Trade: Defines how much capital is allocated per trade.
Lot Size: Specifies the number of Nifty options contracts to trade.
Trailing Stop-Loss Points: Defines how many points the price has to move against the position before the trailing stop is triggered.
Trading Logic:
RSI & Moving Average: The strategy generates buy (call) and sell (put) signals based on the crossover and crossunder of RSI and its moving average.
Position Size: The position size is based on capital allocated and the current price of the Nifty.
Stop Loss/Take Profit: The strategy uses both percentage-based stop loss and take profit levels, as well as a trailing stop mechanism to lock profits.
Exit Conditions:
The strategy has several exit triggers:
Trailing Stop-Loss: When the price moves against the trade by a certain number of points, it exits.
Reversal Exit: The strategy will exit a position if the opposite signal (long vs. short or vice versa) occurs.
TP/SL Exit: The strategy will also exit the position when the target profit or stop loss levels are hit.
Loss Count: The strategy tracks the number of consecutive losing trades, and if the count exceeds two, no new trades are allowed until the count resets.
Reset Loss Count: The loss count resets every day at 9:15 AM.
Plotting:
Entry signals (long/short) are marked with green (buy call) and red (buy put) triangles.
Exit signals for TP, SL, Reversal, and Trailing SL are marked with respective shapes (crosses, circles, squares).
This strategy is designed to manage risk with a stop loss and take profit system, while also incorporating a trailing stop-loss mechanism to lock in profits. It ensures that the strategy works only on the 4-hour chart, and limits trading activity after consecutive losses to maintain discipline.

Ultimate Scalping DashboardWhat This Dashboard Includes (Visually Compact):
Trend: EMA 9/21/50 alignment
Momentum: MACD + Stochastic RSI direction
Bias: VWAP position (above/below)
Volume: Spike status
Squeeze: Bollinger Band squeeze
SuperTrend: Bullish/Bearish
Divergence: RSI/MACD signal
Buy/Sell Signal Summary
It gives you a clean table-style display at the top or bottom of the screen — super useful for 15m scalping.
Real-time dashboard at the bottom-right of your chart
Color-coded cells for instant visual clarity
Final signal to tell you: BUY, SELL, or WAIT

RSI Divergence Strategy - AliferCryptoStrategy Overview
The RSI Divergence Strategy is designed to identify potential reversals by detecting regular bullish and bearish divergences between price action and the Relative Strength Index (RSI). It automatically enters positions when a divergence is confirmed and manages risk with configurable stop-loss and take-profit levels.
Key Features
Automatic Divergence Detection: Scans for RSI pivot lows/highs vs. price pivots using user-defined lookback windows and bar ranges.
Dual SL/TP Methods:
- Swing-based: Stops placed a configurable percentage beyond the most recent swing high/low.
- ATR-based: Stops placed at a multiple of Average True Range, with a separate risk/reward multiplier.
Long and Short Entries: Buys on bullish divergences; sells short on bearish divergences.
Fully Customizable: Input groups for RSI, divergence, swing, ATR, and general SL/TP settings.
Visual Plotting: Marks divergences on chart and plots stop-loss (red) and take-profit (green) lines for active trades.
Alerts: Built-in alert conditions for both bullish and bearish RSI divergences.
Detailed Logic
RSI Calculation: Computes RSI of chosen source over a specified period.
Pivot Detection:
- Identifies RSI pivot lows/highs by scanning a lookback window to the left and right.
- Uses ta.barssince to ensure pivots are separated by a minimum/maximum number of bars.
Divergence Confirmation:
- Bullish: Price makes a lower low while RSI makes a higher low.
- Bearish: Price makes a higher high while RSI makes a lower high.
Entry:
- Opens a Long position when bullish divergence is true.
- Opens a Short position when bearish divergence is true.
Stop-Loss & Take-Profit:
- Swing Method: Computes the recent swing high/low then adjusts by a percentage margin.
- ATR Method: Uses the current ATR × multiplier applied to the entry price.
- Take-Profit: Calculated as entry price ± (risk × R/R ratio).
Exit Orders: Uses strategy.exit to place bracket orders (stop + limit) for both long and short positions.
Inputs and Configuration
RSI Settings: Length & price source for the RSI.
Divergence Settings: Pivot lookback parameters and valid bar ranges.
SL/TP Settings: Choice between Swing or ATR method.
Swing Settings: Swing lookback length, margin (%), and risk/reward ratio.
ATR Settings: ATR length, stop multiplier, and risk/reward ratio.
Usage Notes
Adjust the Pivot Lookback and Range values to suit the volatility and timeframe of your market.
Use higher ATR multipliers for wider stops in choppy conditions, or tighten swing margins in trending markets.
Backtest different R/R ratios to find the balance between win rate and reward.
Disclaimer
This script is for educational purposes only and does not constitute financial advice. Trading carries significant risk and you may lose more than your initial investment. Always conduct your own research and consider consulting a professional before making any trading decisions.

Trend Breakout Strategy with Separated Alertshz, nado denygi zarabatuvaty, onoto i xoposho i ploxo sho tak trudno, no po drugomy nikak

Gold Certificate vs Gram Gold – Price Difference📌 Gold Certificate vs Gram Gold – Price Deviation Indicator
✅ Overview
This indicator is designed to analyze and visualize the price discrepancy between the Turkish Gold Certificate (BIST:ALTIN) and the international Gram Gold price (FX_IDC:XAUTRYG).
It helps investors identify whether the certificate is overvalued (premium) or undervalued (discount) compared to its theoretical price.
📐 What Does It Calculate?
In theory:
1 BIST Gold Certificate = 1/100 of Gram Gold price
However, in practice, this parity is rarely exact due to:
Local supply & demand
Limited liquidity in BIST
Investor sentiment
Timezone differences and market hours
This indicator calculates:
The % difference between actual certificate price and its theoretical value
The 100-day average of that difference for baseline comparison
🔍 Why Is This Useful?
Understanding the premium/discount level is crucial for:
Gold investors in Turkey who want to avoid buying overpriced certificates
Arbitrage traders seeking deviation opportunities between spot gold and certificate price
Long-term holders who want to enter at fair value or during discounts
Fundamental analysts who evaluate local sentiment divergence from international price
📊 What Does It Display?
% Price Difference
How much the certificate is trading above or below its theoretical price
100-Day Moving Average of the Difference
Historical baseline to understand if the current gap is excessive
Status Tag (Color-coded):
🔶 Expensive → Current difference is higher than 100-day average
🟢 Cheap → Current difference is below 0%
🔸 Normal → Within average range
Market Warning
A reminder to switch to a 24-hour chart like XAUTRYG when BIST is closed, as stale data may lead to misleading signals.
Multi-language Support
All interface text can be displayed in either Turkish or English, based on user selection in the settings.
⚙️ How to Use
Add the indicator to any chart
For the most accurate readings, open it on a 24/7 active symbol (e.g., XAUTRYG)
Watch the table in the top-right corner to track:
Current % Difference
100-Day Average
Market Status (Expensive, Cheap, Normal)
Pay attention to overbought conditions (e.g. +10%) as a signal to avoid buying
💡 Practical Example:
If:
Gram Gold = 2000 TRY
Theoretical ALTIN = 2000 / 100 = 20 TRY
But BIST:ALTIN is trading at 22.50 TRY → +12.5% premium
This tool would mark the certificate as 🔶 Expensive, showing that local traders are paying significantly more than the real value of gold.
🚨 Note:
Values may temporarily distort when BIST is closed and global gold continues to move.
This is not a buy/sell signal tool, but a valuation tool to assist in decision-making and timing.
🙌 Final Words
This indicator is ideal for:
Retail traders
Portfolio managers
Gold ETF analysts
Long-term investors
Use it to avoid overpaying during high-premium periods and to detect favorable buying windows.
If you find it useful, please like, save, and share!
Feel free to leave feedback or suggestions in the comments.

Bollinger Band Expansion with EMAsCall Entry above Purple Candle's High, Stop loss previous candle low.
Sell Entry Below Grey Candle's Low, Stop loss previous candle High.

NEO Super 1The main changes include:
Added parameters from the second indicator
Expanded the MA function to support types from both indicators
Integrated moving average calculations
Added new signal logic using conditions:
MA Fast/Slow crossover 2 bars ago
Checking the close of the previous candle
Definition of the Hull Ribbon zone
Added new arrows and alerts
Kept all original visuals and alerts
All controls from both indicators are available in the script settings. You can enable/disable individual components via parameters.

💥 Early Breakout Detector (Penny Stocks)Early Breakout Detector – Penny Stocks Edition"
This script is designed to detect early breakout signals in low-priced stocks (penny stocks) before the actual breakout happens. It combines multiple technical indicators to spot high-probability setups where a price explosion may be imminent.
🔍 Included logic:
– Unusual relative volume (volume > 2x 20-period average)
– RSI momentum turning bullish (RSI > 50)
– Price trading above the 20-period moving average
– Price approaching recent resistance (within 3%) but not yet breaking it
📈 When all conditions align, a "PRE" label appears on the chart, and an alert can be triggered to catch the move before it happens.
💡 Ideal for traders looking to enter positions before breakouts occur, especially in momentum-driven penny stocks.
🚨 Alerts included. Works on any timeframe. Best results observed on 5min–1H for intraday setups.
🛠 You can modify volume thresholds, RSI period, or resistance distance to suit your strategy.
— Built by AI

DC - Volatility ZigZag Support/ResistanceThis indicator combines advanced Volatility ZigZag detection, SMA 200 trend analysis, and dynamic support/resistance zones based on volume and price pivots. It's designed to help traders visually identify trend reversals, key price levels, and potential breakouts or bounces with clarity and precision.
What It Does
Volatility ZigZag: Uses price volatility (standard deviation, ATR, true range) to plot ZigZag lines and identify significant trend changes. Labels provide reversal price, price/percentage change, and volume data between pivots.
SMA 200: Plots the 200-period Simple Moving Average to indicate the long-term trend direction.
Support/Resistance Zones: Automatically detects price levels based on pivot highs/lows confirmed by volume conditions. Boxes are color-coded and dynamically update based on breakout or retest behavior.
⚙️ Key Features
Fully customizable ZigZag settings: deviation %, pivot confirmation, std dev factor, and lookback length.
Configurable visuals: pivot markers (⦿), alert points (◯), and labeled statistics between pivots.
Volume-sensitive support/resistance zones that react to breakouts or bounces.
Alerts for new ZigZag pivots.
Data window feedback on trend status and deviation metrics.
✅ Ideal For
Swing traders tracking reversals or continuation patterns.
Trend followers using SMA 200 and pivot points for confirmation.
Volume-based traders looking for support/resistance backed by meaningful volume spikes or drops.

PRO SMC Full Suite BY Mashrur“PRO SMC Full Suite BY Mashrur”
A Pine Script (v5) indicator for TradingView, focused on Smart Money Concepts (SMC). It overlays on price charts and provides visual tools for identifying key institutional trading behaviors.
🎯 Purpose
This script is designed to help traders analyze and trade using SMC principles by automatically detecting:
Order Blocks (OBs)
Fair Value Gaps (FVGs)
Breaks of Structure (BoS)
Liquidity Sweeps (Buy/Sell Side Liquidity Grabs)
Mitigation Entries
⚙️ Inputs / Settings
Show Fair Value Gaps: Toggle FVGs on/off
Higher Timeframe (HTF): Choose HTF for OB analysis
Use HTF OBs: Switch between current TF OBs and HTF OBs
Show Order Blocks: Toggle OBs on/off
Show OB Mitigation Entries: Toggle mitigation entry signals on/off
🧠 Core Logic Overview
🔹 1. Swing Points Detection
Identifies swing highs/lows using a 3-bar pattern (pivot-based structure).
🔹 2. Break of Structure (BoS)
A bullish BoS happens when price closes above the last swing high.
A bearish BoS occurs when price closes below the last swing low.
🔹 3. Order Block Detection
Upon BoS, the script marks the previous candle as the Order Block.
Uses either:
Current TF OBs (based on price action)
HTF OBs (based on candle body direction)
🔹 4. Mitigation Entry Logic
A mitigation occurs when price returns to the OB and reacts with confirmation:
Bullish: price dips into OB and closes above
Bearish: price wicks into OB and closes below
Plots entry markers for these mitigations.
🔹 5. Liquidity Sweeps
Detects equal highs/lows (liquidity zones)
Marks Buy SL when price dips below an equal low then closes above
Marks Sell SL when price breaks above an equal high then closes below
🔹 6. Fair Value Gaps (FVGs)
FVG Up: Gap between candle 3 and candle 1 (low > high )
FVG Down: Gap between candle 3 and candle 1 (high < low )
Plots highlighted boxes on these gaps
📊 Visual Elements
Boxes: For OB zones and FVGs
Shapes:
Labels: OB Buy/Sell entries
Triangles: Buy SL / Sell SL liquidity sweeps
Lines: Equal Highs and Lows
🔔 Alerts
Built-in alerts to notify when:
OB entries are confirmed
Liquidity sweeps happen
Helps in automation or active monitoring
✅ Ideal For
Traders using SMC, ICT concepts, Wyckoff, or institutional trading models
Anyone wanting to automate detection of structural elements on their chart

Umair Volume-Based Buy/Sell SignalsA volume-based indicator is a technical analysis tool that utilizes trading volume data to assess market activity and predict potential price movements. By analyzing the number of shares or contracts traded over a specific period, these indicators help confirm trends, identify reversals, or spot divergence between volume and price. Examples include On-Balance Volume (OBV), Volume Weighted Average Price (VWAP), and Chaikin Money Flow. They provide insights into market strength, liquidity, and investor sentiment, aiding traders in validating whether price changes are supported by market participation or likely to reverse. High volume often reinforces trend legitimacy, while low volume may signal weak momentum.

PRO SMC Full Suite BY Mashrur“PRO SMC Full Suite BY Mashrur”
A Pine Script (v5) indicator for TradingView, focused on Smart Money Concepts (SMC). It overlays on price charts and provides visual tools for identifying key institutional trading behaviors.
🎯 Purpose
This script is designed to help traders analyze and trade using SMC principles by automatically detecting:
Order Blocks (OBs)
Fair Value Gaps (FVGs)
Breaks of Structure (BoS)
Liquidity Sweeps (Buy/Sell Side Liquidity Grabs)
Mitigation Entries
⚙️ Inputs / Settings
Show Fair Value Gaps: Toggle FVGs on/off
Higher Timeframe (HTF): Choose HTF for OB analysis
Use HTF OBs: Switch between current TF OBs and HTF OBs
Show Order Blocks: Toggle OBs on/off
Show OB Mitigation Entries: Toggle mitigation entry signals on/off
🧠 Core Logic Overview
🔹 1. Swing Points Detection
Identifies swing highs/lows using a 3-bar pattern (pivot-based structure).
🔹 2. Break of Structure (BoS)
A bullish BoS happens when price closes above the last swing high.
A bearish BoS occurs when price closes below the last swing low.
🔹 3. Order Block Detection
Upon BoS, the script marks the previous candle as the Order Block.
Uses either:
Current TF OBs (based on price action)
HTF OBs (based on candle body direction)
🔹 4. Mitigation Entry Logic
A mitigation occurs when price returns to the OB and reacts with confirmation:
Bullish: price dips into OB and closes above
Bearish: price wicks into OB and closes below
Plots entry markers for these mitigations.
🔹 5. Liquidity Sweeps
Detects equal highs/lows (liquidity zones)
Marks Buy SL when price dips below an equal low then closes above
Marks Sell SL when price breaks above an equal high then closes below
🔹 6. Fair Value Gaps (FVGs)
FVG Up: Gap between candle 3 and candle 1 (low > high )
FVG Down: Gap between candle 3 and candle 1 (high < low )
Plots highlighted boxes on these gaps
📊 Visual Elements
Boxes: For OB zones and FVGs
Shapes:
Labels: OB Buy/Sell entries
Triangles: Buy SL / Sell SL liquidity sweeps
Lines: Equal Highs and Lows
🔔 Alerts
Built-in alerts to notify when:
OB entries are confirmed
Liquidity sweeps happen
Helps in automation or active monitoring
✅ Ideal For
Traders using SMC, ICT concepts, Wyckoff, or institutional trading models
Anyone wanting to automate detection of structural elements on their chart

Clenow MomentumClenow Momentum Method
The Clenow Momentum Method, developed by Andreas Clenow, is a systematic, quantitative trading strategy focused on capturing medium- to long-term price trends in financial markets. Popularized through Clenow’s book, Stocks on the Move: Beating the Market with Hedge Fund Momentum Strategies, the method leverages momentum—an empirically observed phenomenon where assets that have performed well in the recent past tend to continue performing well in the near future.
Theoretical Foundation
Momentum investing is grounded in behavioral finance and market inefficiencies. Investors often exhibit herding behavior, underreact to new information, or chase trends, causing prices to trend beyond fundamental values. Clenow’s method builds on academic research, such as Jegadeesh and Titman (1993), which demonstrated that stocks with high returns over 3–12 months outperform those with low returns over similar periods.
Clenow’s approach specifically uses **annualized momentum**, calculated as the rate of return over a lookback period (typically 90 days), annualized to reflect a yearly percentage. The formula is:
Momentum=(((Close N periods agoCurrent Close)^N252)−1)×100
- Current Close: The most recent closing price.
- Close N periods ago: The closing price N periods back (e.g., 90 days).
- N: Lookback period (commonly 90 days).
- 252: Approximate trading days in a year for annualization.
This metric ranks stocks by their momentum, prioritizing those with the strongest upward trends. Clenow’s method also incorporates risk management, diversification, and volatility adjustments to enhance robustness.
Methodology
The Clenow Momentum Method involves the following steps:
1. Universe Selection:
- A broad universe of liquid stocks is chosen, often from major indices (e.g., S&P 500, Nasdaq 100) or global exchanges.
- Filters should exclude illiquid stocks (e.g., low average daily volume) or those with extreme volatility.
2. Momentum Calculation:
- Stocks are ranked based on their annualized momentum over a lookback period (typically 90 days, though 60–120 days can be common tests).
- The top-ranked stocks (e.g., top 10–20%) are selected for the portfolio.
3. Volatility Adjustment (Optional):
- Clenow sometimes adjusts momentum scores by volatility (e.g., dividing by the standard deviation of returns) to favor stocks with smoother trends.
- This reduces exposure to erratic price movements.
4. Portfolio Construction:
- A diversified portfolio of 10–25 stocks is constructed, with equal or volatility-weighted allocations.
- Position sizes are often adjusted based on risk (e.g., 1% of capital per position).
5. Rebalancing:
- The portfolio is rebalanced periodically (e.g., weekly or monthly) to maintain exposure to high-momentum stocks.
- Stocks falling below a momentum threshold are replaced with higher-ranked candidates.
6. Risk Management:
- Stop-losses or trailing stops may be applied to limit downside risk.
- Diversification across sectors reduces concentration risk.
Implementation in TradingView
Key features include:
- Customizable Lookback: Users can adjust the lookback period in pinescript (e.g., 90 days) to align with Clenow’s methodology.
- Visual Cues: Background colors (green for positive, red for negative momentum) and a zero line help identify trend strength.
- Integration with Screeners: TradingView’s stock screener can filter high-momentum stocks, which can then be analyzed with the custom indicator.
Strengths
1. Simplicity: The method is straightforward, relying on a single metric (momentum) that’s easy to calculate and interpret.
2. Empirical Support: Backed by decades of academic research and real-world hedge fund performance.
3. Adaptability: Applicable to stocks, ETFs, or other asset classes, with flexible lookback periods.
4. Risk Management: Diversification and periodic rebalancing reduce idiosyncratic risk.
5. TradingView Integration: Pine Script implementation enables real-time visualization, enhancing decision-making for stocks like NVDA or SPY.
Limitations
1. Mean Reversion Risk: Momentum can reverse sharply in bear markets or during sector rotations, leading to drawdowns.
2. Transaction Costs: Frequent rebalancing increases trading costs, especially for retail traders with high commissions. This is not as prevalent with commission free trading becoming more available.
3. Overfitting Risk: Over-optimizing lookback periods or filters can reduce out-of-sample performance.
4. Market Conditions: Underperforms in low-momentum or highly volatile markets.
Practical Applications
The Clenow Momentum Method is ideal for:
Retail Traders: Use TradingView’s screener to identify high-momentum stocks, then apply the Pine Script indicator to confirm trends.
Portfolio Managers: Build diversified momentum portfolios, rebalancing monthly to capture trends.
Swing Traders: Combine with volume filters to target short-term breakouts in high-momentum stocks.
Cross-Platform Workflow: Integrate with Python scanners to rank stocks, then visualize on TradingView for trade execution.
Comparison to Other Strategies
Vs. Minervini’s VCP: Clenow’s method is purely quantitative, while Minervini’s Volatility Contraction Pattern (your April 11, 2025 query) combines momentum with chart patterns. Clenow is more systematic but less discretionary.
Vs. Mean Reversion: Momentum bets on trend continuation, unlike mean reversion strategies that target oversold conditions.
Vs. Value Investing: Momentum outperforms in bull markets but may lag value strategies in recovery phases.
Conclusion
The Clenow Momentum Method is a robust, evidence-based strategy that capitalizes on price trends while managing risk through diversification and rebalancing. Its simplicity and adaptability make it accessible to retail traders, especially when implemented on platforms like TradingView with custom Pine Script indicators. Traders must be mindful of transaction costs, mean reversion risks, and market conditions. By combining Clenow’s momentum with volume filters and alerts, you can optimize its application for swing or position trading.

RSI Candlestick Oscillator [LuxAlgo]The RSI Candlestick Oscillator displays a traditional Relative Strength Index (RSI) as candlesticks. This indicator references OHLC data to locate each candlestick point relative to the current RSI Value, leading to a more accurate representation of the Open, High, Low, and Close price of each candlestick in the context of RSI.
In addition to the candlestick display, Divergences are detected from the RSI candlestick highs and lows and can be displayed over price on the chart.
🔶 USAGE
Translating candlesticks into the RSI oscillator is not a new concept and has been attempted many times before. This indicator stands out because of the specific method used to determine the candlestick OHLC values. When compared to other RSI Candlestick indicators, you will find that this indicator clearly and definitively correlates better to the on-chart price action.
Traditionally, the RSI indicator is simply one running value based on (typically) the close price of the chart. By introducing high, low, and open values into the oscillator, we can better gauge the specific price action throughout the intrabar movements.
Interactions with the RSI levels can now take multiple forms, whether it be a full-bodied breakthrough or simply a wick test. Both can provide a new analysis of price action alongside RSI.
An example of wick interactions and full-bodied interactions can be seen below.
As a result of the candlestick display, divergences become simpler to spot. Since the candlesticks on the RSI closely resemble the candlesticks on the chart, when looking for divergence between the chart and RSI, it is more obvious when the RSI and price are diverging.
The divergences in this indicator not only show on the RSI oscillator, but also overlay on the price chart for clearer understanding.
🔹 Filtering Divergence
With the candlesticks generating high and low RSI values, we can better sense divergences from price, since these points are generally going to be more dramatic than the (close) RSI value.
This indicator displays each type of divergence:
Bullish Divergence
Bearish Divergence
Hidden Bullish Divergence
Hidden Bearish Divergence
From these, we get many less-than-useful indications, since every single divergence from price is not necessarily of great importance.
The Divergence Filter disregards any divergence detected that does not extend outside the RSI upper or lower values.
This does not replace good judgment, but this filter can be helpful in focusing attention towards the extremes of RSI for potential reversal spotting from divergence.
🔶 DETAILS
In order to get the desired results for a display that resembles price action while following RSI, we must scale. The scaling is the most important part of this indicator.
To summarize the process:
Identify a range on Price and RSI
Consider them as equal to create a scaling factor
Use the scaling factor to locate RSI's "Price equivalent" Upper, Lower, & Mid on the Chart
Use those prices (specifically the RSI Mid) to check how far each OHLC value lies from it
Use those differences to translate the price back to the RSI Oscillator, pinning the OHLC values at their relative location to our anchor (RSI Mid)
🔹 RSI Channel
To better understand, and for your convenience, the indicator includes the option to display the RSI Channel on the chart. This channel helps to visualize where the scaled RSI values are relative to price.
If you analyze the RSI channel, you are likely to notice that the price movement throughout the channel matches the same movement witnessed in the RSI Oscillator below. This makes sense since they are the exact same thing displayed on different scales.
🔹 Scaling the Open
While the scaling method used is important, and provides a very close view of the real price bar's relative locations on the RSI oscillator… It is designed for a single purpose.
The scaling does NOT make the price candles display perfectly on the RSI oscillator.
The largest place where this is noticeable is with the opening of each candle.
For this reason, we have included a setting that modifies the opening of each RSI candle to be more accurate to the chart's price candles.
This setting positions the current bar's opening RSI candlestick value accurately relative to the price's open location to the previous closing price. As seen below.
🔶 SETTINGS
🔹 RSI Candles
RSI Length: Sets the Length for the RSI Oscillator.
Overbought/Oversold Levels: Sets the Overbought and Oversold levels for the RSI Oscillator.
Scale Open for Chart Accuracy: As described above, scales the open of each candlestick bar to more accurately portray the chart candlesticks.
🔹 Divergence
Show on Chart: Choose to display divergence line on the chart as well as on the Oscillator.
Divergence Length: Sets the pivot width for divergence detection. Normal Fractal Pivot Detection is used.
Divergence Style: Change color and line style for Regular and Hidden divergences, as well as toggle their display.
Divergence Filter: As described above, toggle on or off divergence filtering.
🔹 RSI Channel
Toggle: Display RSI Channel on Chart.
Color: Change RSI Channel Color

EMA Crossover StrategyEma crossover with ovtlyer exit criteria. If price is over 50 EMA enter, if price drops below 10 ema at any point exit. Inversed if bearish

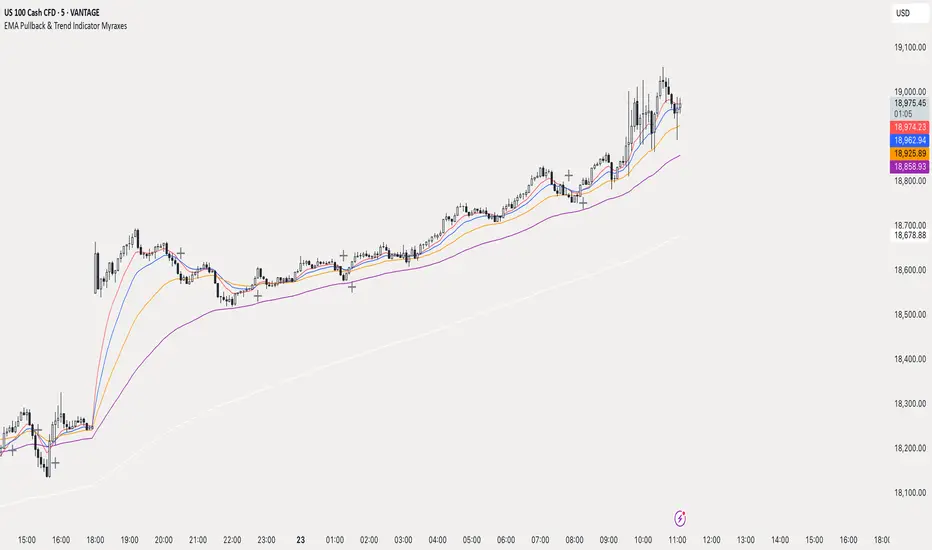
EMA Pullback & Trend Indicator MyraxesEMA Pullback & Trend Indicator by Max Retri
Plots five EMAs—9, 15, 30, 65 and 200—and draws clean, easy-to-interpret signals when the fast EMAs cross in the direction of the longer-term trend. No other indicators or overlays are required; simply add it to your chart and watch for the arrows and crosses.
⸻
What It Does & How It Works
1. EMAs & Colors
• Red (EMA 9) – Fast signal line
• Blue (EMA 15) – Confirmation line
• Orange (EMA 30) – Pullback zone 1
• Purple (EMA 65) – Pullback zone 2 & mid-term trend
• White (EMA 200) – Long-term trend
2. Trend Filter
• Bullish regime when price is above both EMA 65 and EMA 200.
• Bearish regime when price is below both EMA 65 and EMA 200.
3. Pullback Requirement
• Only consider a signal if price has retraced into the EMA 30 or EMA 65 zone.
4. Signal Logic
Long Entry ▲: EMA 9 (red) crosses above EMA 15 (blue) while in a bullish regime and after a pullback into EMA 30/65.
Short Entry ▼: EMA 9 crosses below EMA 15 while in a bearish regime and after a retracement up to EMA 30/65.
Exit ✖: Opposite EMA 9/15 crossover marks the close of the position.
⸻
How to Use
1. Add the indicator to any chart/timeframe.
2. Identify trend: make sure price is aligned above or below the 65 and 200 EMAs.
3. Watch for pullbacks into the orange or purple EMAs.
4. Enter on the black ▲ or ▼ arrow.
5. Exit when you see the gray ✖ cross.
Because it’s a pure‐EMA indicator (no heavy calculations), it runs quickly even on lower-end machines.

Xpips Trade TrendLooking to boost your trend-following strategy? Discover this ultra-precise indicator, designed to deliver fast and responsive trend signals with zero lag. By combining a no-lag EMA (ZLEMA), adaptive volatility bands, and dynamic alerts, you'll gain a clear, real-time view of the market—no matter your trading timeframe. 🔍
🔹 Lag-free analysis: Smooth price action using ZLEMA for fast and fluid trend readings.
🔹 Multi-timeframe view: Track up to 5 timeframes simultaneously (from intraday to daily) in a clean, intuitive panel.
🔹 Adaptive volatility bands: Spot reversals with greater accuracy and reduced false signals.
🔹 Smart alerts: Get instantly notified when trend shifts occur—no need to constantly monitor your chart.
🔹 Optimized visuals: Clear color-coded signals help you instantly identify bullish and bearish trends.
🔹 Fully customizable: Tweak EMA length, band settings, colors, and timeframes to perfectly fit your strategy.
To set an alert, simply create an alert on the indicator:
- For a sell alert: select the indicator and choose *bearish trend*
- For a buy alert: select the indicator and choose *bullish trend*
"You can also create alerts on the small triangles after the label.
It’s the same thing."
- For a sell alert: select the indicator and choose *bearish entry signal*
- For a buy alert: select the indicator and choose *bullish entry signal*

Global M2 Money Supply // Days Offset =Implementation of Colin Crypto M2 money supply indicator which seems to lead BTC movement.
