CandleLibraryLibrary "CandleLibrary"
f_isGreen(c)
Parameters:
c (candle)
f_isRed(c)
Parameters:
c (candle)
f_isBullishEngulfing(arr, i)
Parameters:
arr (array)
i (int)
f_isDragonflyDoji(arr, i)
Parameters:
arr (array)
i (int)
is_dragonfly_doji(c0)
Parameters:
c0 (candle)
f_isHammer(arr, i)
Parameters:
arr (array)
i (int)
f_isDoji(arr, i)
Parameters:
arr (array)
i (int)
f_isDoji(can)
Parameters:
can (candle)
f_isOutsideBar(arr, i)
Parameters:
arr (array)
i (int)
f_isInsideBar(arr, i)
Parameters:
arr (array)
i (int)
f_is2up(arr, i)
Parameters:
arr (array)
i (int)
f_is2down(arr, i)
Parameters:
arr (array)
i (int)
f_isDojiStar(arr, i)
Parameters:
arr (array)
i (int)
f_isSmallGreenCandle_80(can)
Parameters:
can (candle)
f_isTinyGreenCandle(can)
Parameters:
can (candle)
f_isSmallRedCandle(can)
Parameters:
can (candle)
f_isTinyRedCandle_30(can)
Parameters:
can (candle)
f_isLessThanATR_90(can)
Parameters:
can (candle)
f_isSmallCandle(can)
Parameters:
can (candle)
f_candlePercentATR(can)
Parameters:
can (candle)
f_isTinyCandle(can)
Parameters:
can (candle)
f_isSmallBody(can)
Parameters:
can (candle)
f_isTinyBody(can)
Parameters:
can (candle)
f_isDojiStarReversal(arr, n)
Parameters:
arr (array)
n (int)
numConsecutive2down(arr)
Parameters:
arr (array)
numConsecutive2up(arr)
Parameters:
arr (array)
numConsecutiveLH(arr)
Parameters:
arr (array)
f_numLLorLH(htf_array)
Parameters:
htf_array (array)
f_numHigherLows(arr)
Parameters:
arr (array)
f_isMorningStar(arr)
Parameters:
arr (array)
f_lowerHighSeriesReversalSetup(arr, n)
Parameters:
arr (array)
n (int)
redSeriesDojiAlert2(arr)
Parameters:
arr (array)
f_isEveningStar(arr, i)
Parameters:
arr (array)
i (int)
candle
Fields:
open_next (series float)
open_ (series float)
high_ (series float)
low_ (series float)
close_ (series float)
volume_ (series float)
rsi_ (series float)
atr_ (series float)
candle_size (series float)
body_size (series float)
upperwick (series float)
lowerwick (series float)
rsi_candle
Fields:
rsiopen (series float)
rsihigh (series float)
rsilow (series float)
rsiclose (series float)
Indicators and strategies

Forex Overwiew True Strenght IndexNew oscillator for all currencies—I’m about to add NOK, SEK, and other lower-volume currencies that are interesting due to their lack of correlation with the major ones.


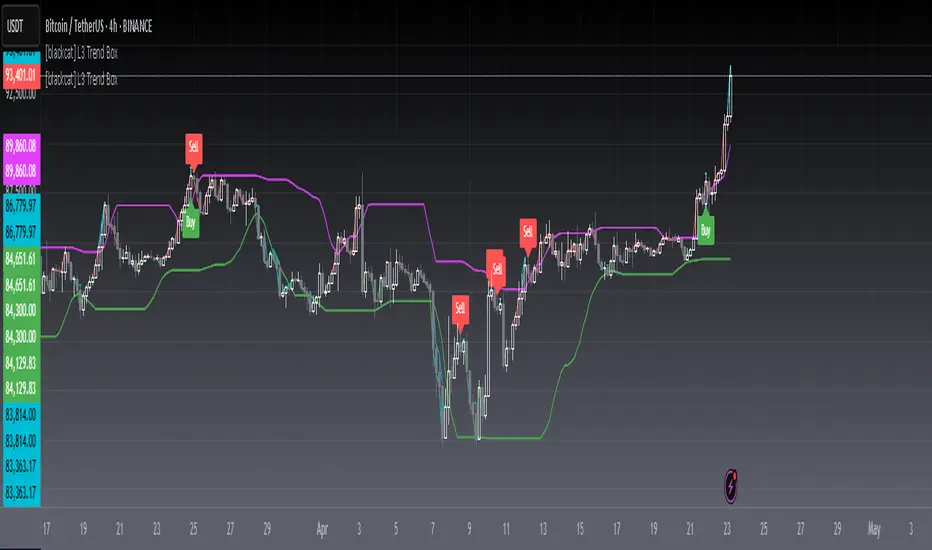
[blackcat] L3 Trend BoxOVERVIEW
The L3 Trend Box indicator is a sophisticated technical analysis tool designed to assist traders in identifying trends and pinpointing potential entry and exit points within the market. By leveraging multiple moving averages and price level analyses, this indicator provides a detailed view of market dynamics. It plots several key lines and labels directly onto the chart, offering clear visual signals for both bullish and bearish scenarios. Its adaptability through customizable parameters makes it suitable for various trading strategies and market conditions 📊✅.
FEATURES
Comprehensive Parameter Customization: Tailor the indicator to match specific trading preferences:
High Length: Defines the period over which the highest prices are considered.
Low Length: Specifies the period for evaluating the lowest prices.
Upper Box Length: Smoothes out the upper boundary of the trend box using a specified period.
Lower Box Length: Smoothes out the lower boundary of the trend box similarly.
Trend Line Length: Determines the period for calculating the overall trend line.
Fast EMA Length: Sets the period for the fast-moving exponential moving average (EMA), crucial for capturing short-term movements.
MA15 EMA Length: Configures the period for the medium-term moving average (MA15 EMA) to provide a balanced perspective.
Short Spirit Length: Influences how quickly the indicator responds to recent price changes.
Golden EMA Length: Fine-tunes the long-term EMA for stability and reliability.
Buy Price Length: Establishes the lookback period for determining optimal buy prices.
Var1 Length & Var2 Length: Adjusts periods for variance calculations, enhancing the accuracy of trend detection.
Detailed Chart Plots:
Upper Box Top: A fuchsia-colored line representing the smoothed highest prices, marking resistance levels.
Lower Box Bottom: A green-colored line showing the smoothed lowest prices, highlighting support zones.
MA15 Up/Down: Dynamic red and green lines illustrating the directionality of the 15-period EMA, helping gauge momentum shifts.
Conditional Plots: Multiple lines based on intricate price actions and computed values, such as closing below the lower box while also closing at or above/below the opening price, ensuring nuanced insights into market behavior.
Buy/Sell Labels: Clearly marked 'Buy' and 'Sell' labels positioned strategically on the chart, facilitating quick decision-making without missing critical signals 🎯.
Alert System: Automatically generates alerts based on predefined buy and sell conditions, enabling timely responses to market changes 🛎️.
HOW TO USE
Adding the Indicator: Start by adding the L3 Trend Box to your TradingView chart via the indicators menu.
Parameter Configuration: Adjust each parameter according to your trading style and market volatility. For instance, increasing the High Length can make the indicator less sensitive to minor fluctuations but more responsive to significant trends.
Monitoring Signals: Keep an eye on the plotted lines and labels. Pay special attention to the crossover events between the fast EMA and the lower box bottom, as these often signify strong buy signals.
Setting Alerts: Configure alerts based on the buy/sell conditions provided by the indicator. This ensures you never miss an opportunity due to inattention.
Combining Strategies: While powerful on its own, combining this indicator with others like RSI or Bollinger Bands can enhance its predictive power and reduce false positives.
LIMITATIONS
Market Volatility: In extremely volatile or sideways-trending markets, the indicator might produce false signals. Always verify with additional confirmations.
Asset-Specific Performance: Different assets and timeframes will yield varying results; thorough backtesting across diverse instruments is recommended.
Over-Reliance Risk: Avoid relying solely on this indicator. Integrate it into a broader analytical framework that includes fundamental analysis and other technical indicators.
NOTES
Data Sufficiency: Ensure ample historical data is available for precise computations. Lack of data can skew results and lead to inaccurate signals.
Demo Testing: Before deploying the indicator in real trades, rigorously test it on demo accounts under varied market conditions to understand its strengths and weaknesses.
Customization Flexibility: Feel free to tweak the parameters continuously until they align perfectly with your unique trading approach and risk tolerance.

cc AJGB START/END OF ALGO TIMES 29, 35, 71, 77Finds UTC+2 Time Based Points on the Chart based on the ideas from AJAY.
Swing points are found at found a several specific "TIMES" of the day based on the concept of using the 24 HH:MM minute portion, the minute plus the hour and the minute minus the hour.
The numbers being sought on the chart are plotted based just on time.
Enjoy!

Volume Aggression Monitor📌 Volume Aggression Monitor — Overview
This indicator helps identify buying and selling pressure (aggression) in real-time by analyzing how market participants are executing trades. It is composed of three main components:
🔍 What Does It Show?
🧭 1. The Thermometer (Above Candles)
🟢 Green Arrow (▲) → Buy Aggression: Buyers are lifting the ask.
🔴 Red Arrow (▼) → Sell Aggression: Sellers are hitting the bid.
⚪ Gray Square (■) → Neutral: No significant price movement or aggression.
💡 Neutral in this context means:
The price barely moved during the candle (open-close % change < direction_threshold, default 0.05%).
No clear buyer or seller dominance. It often appears during low volatility, equilibrium, or market indecision periods. This prevents noise and false directional readings due to random micro-movements.
📊 2. Percentage Panel
A table displaying recent trades or candle data (from a lower timeframe). Colored arrows indicate the direction of aggression (buy/sell). Shows volume, delta, and aggression %.
✅ Use it to:
Track clusters of buy/sell aggression. Spot momentum builds.
⏱️ 3. Cumulative Times & Sales Bar
A horizontal progress bar representing cumulative aggression.
Positive = Buy Aggression dominates.
Negative = Sell Aggression dominates.
📉 Even in sideways price movement, this bar shows who is winning the fight under the surface.
---
🧠 How to Use It:
🔹 Confirm Trades
Use the thermometer and aggression signals to confirm your strategy entries (e.g., breakouts, pullbacks, support/resistance).
🔹 Detect Dominance
Observe who is in control: buyers or sellers? Are they pressing or hesitating?
🔹 Filter Market Noise
The neutral state avoids misinterpreting small, meaningless movements as strong signals.
---
Component | Meaning
🌡️ Thermometer (▲ ▼ ■) | Who’s in control in each candle
📊 Percentage Panel | Trade details: direction, delta, aggression
📈 Cumulative T&S Bar | Overall aggression bias over time
---

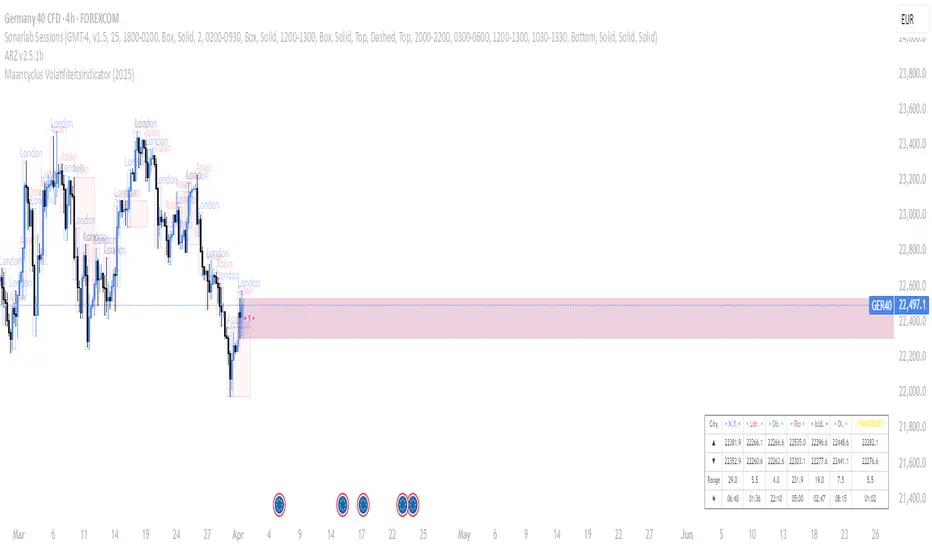
Maancyclus Volatiliteitsindicator (2025)This Moon Cycle Volatility Indicator for TradingView is designed to help traders track and analyze market volatility around specific lunar phases, namely the Full Moon and New Moon. The indicator marks the dates of these moon phases on the chart and measures volatility using the Average True Range (ATR) indicator, which gauges market price fluctuations.
Key Features:
Moon Phase Markers: The indicator marks the Full Moon and New Moon on the chart using labels. Blue labels are placed below bars for Full Moons, while red labels are placed above bars for New Moons. These markers are based on a manually curated list of moon phase dates for the year 2025.
Volatility Calculation: The indicator calculates market volatility using the ATR (14), which provides a sense of market movement and potential risk. Volatility is plotted as histograms, with blue histograms representing volatility around Full Moons and red histograms around New Moons.
Comparative Analysis: By comparing the volatility around these moon phases to the average volatility, traders can spot potential patterns or heightened market movements. This can inform trading strategies, such as anticipating increased market activity around specific lunar events.
In essence, this tool helps traders identify potential high-volatility periods tied to lunar cycles, which could impact market sentiment and price action.
MA backgroundAllows you to use various MAs with % bands set as a background. What it does is divides the % range selected into 1/4's and colors the bottom 1/4 green (your choice) and the top 1/4 red (your choice) then it stacks these ranges above and below the initial selected range. Screenshot is sma 16 but you can do session vwap with .1% measured moves, etc. I use it as a background under some other indicators but you can use it standalone for a pretty clean chart. It's an experiment...

M2 Global Liquidity Index X Days DeltaCapture the delta between different global M2 time lags, and utilize width to increase or decrease the span between the two.

Anpassbarer SMA mit Prozent-VersatzPlots the SMA with an adjustable number of time units and a percentage that draws another line below the SMA as slippage.

EMA & WMA 20 - 50 - 100 - 200EN/ It shows 20 / 50 / 100 / 200 Daily EMA's,
Also it shows 50 / 100 / 200 Weekly EMA's but no 20 Weekly EMA because it is equal to 100 Daily EMA already. Same rules apply to WMA.

1H 200 EMA with Custom Bounce Signal1 Hour 200 EMA with signals
No complication, as simple as possible

2 EMA Crossover Strategy (scalping)9 & 21 EMA and cross-over
Best for 5min Scalping
in the most Easy and Simple way Possible


Sweep Reversal 5M PRO – by [TuNombre]🔹 **Sweep Reversal 5M PRO – by ** 🔹
This indicator is built to detect high-probability *Institutional Sweeps* using Swing Failure Patterns (SFP), fully filtered with Smart Money Concepts (SMC) logic and volume confirmation.
✅ Identifies key liquidity grabs
✅ Confirms with strong impulse candle + increasing volume
✅ Filters out false signals (doji, weak zones, low volume)
✅ Optimized for the 5-minute timeframe (5M)
✅ Compatible with push alerts to your mobile
---
**How to use it:**
1. Wait for a “BUY” or “SELL” signal on the chart
2. Only enter if the next candle confirms with momentum
3. Place a tight stop just beyond the sweep
4. Recommended Take Profit: 1:1 minimum / 2:1 ideal
---
💡 Inspired by institutional trading (SMC, ICT-style setups)
🔒 Developed by – private or team-based use
📲 Activate alerts to get real-time trade opportunities on your phone
---
⚠️ This script does not repaint.
Built for serious traders who want precision, not noise.

MTF Stoch RSI Confluence + Combined AlertMTF STOCH RSI CONFLUENCE INDICATOR 1m/5m/15m ( Scalping Indicator added on SRSI 1H)
IF all three Stoch are overbought(above 80) the indicator creates a red vertical line. If all Stoch are oversold(below 20) the indicator creates a green vertical line.
RULES!!!!
NEVER TRADE AGAINST THE TREND!!! This is super important!!!!
If 1H SRSI is above 80 with MTF overbouht and ZC is red (Downtrend) then we open a MR Short- (Prefered at PA Spikes) The same for opposites MR Longs.
If 1H SRSI is above 80 with the MTF oversold and ZC green then we can open a Long position. Prefered Momo Long. The same applies for opposite, hence momo short.

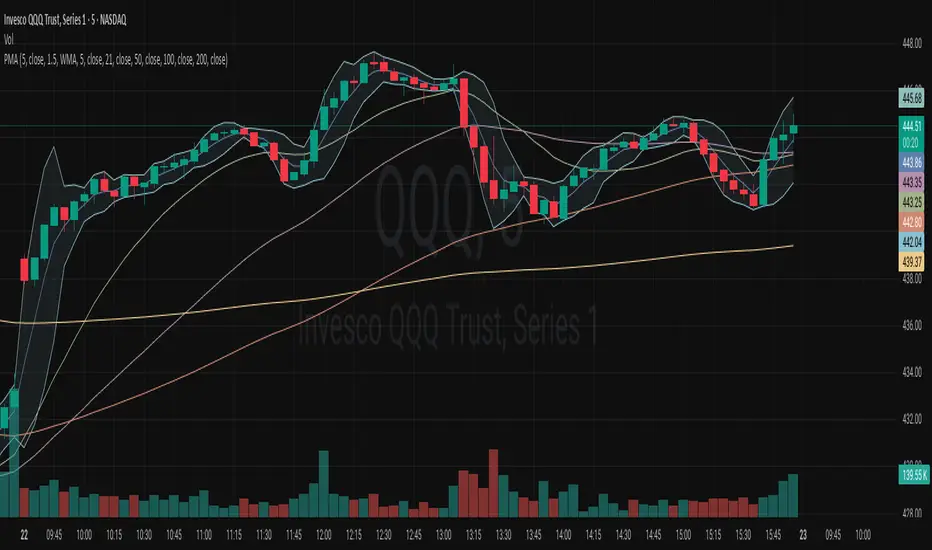
Polygot Moving AveragesDescription
This is essentially a source merger of Bollinger Bands by Trading View and Simple Moving Averages by stoxxinbox. My additions and subtractions are minimal. There is the BB MA, which I default at 5d, and the other 4 averages are the standard 21, 50, 100, 200, day moving averages. I default the averaging method to WMA (Weighted Moving Average). The method of averaging can be changed as also can the lengths of the inputs to match user preferences. This is what I wanted for an indicator and didn't find.
Usage
The same as you would use any other BB or MA indicator. The benefit of this one is that it has 4 MAs, one MA with the Bollinger Bands attached, and the colours adjusted to be easy on the eyes when using high contrast themes, to be discernible yet sit quietly in the background with lines and candle sticks everywhere shouting for attention. I use it as a base first indicator which I can hide easily (imagine hiding five MA indicators individually constantly) when the more serious indicators come into play.
Multi EMA/SMA inkl. TimeframeThis simple indicator shows:
4 different SMAs
4 different EMAs
You can chose an independent timeframe for the moving averages.

Midnight Open (UTC - 5) - Until NoonMidnight Opening
Default to UTC -5
Adjust Timezone in Timestamp variable.

Vacuum Candles [XrayAlgo]The Vacuum Candles indicator helps traders identify inefficient price movements—where the price moves significantly but lacks sufficient volume to support it. These inefficiencies may signal weak trends, potential reversals, or false breakouts/breakdowns.
Inefficient candles are visually marked with a darker / black body to indicate when the price movement is disproportionate to the volume.
1. Spotting Potential Reversals
When the indicator marks an inefficient candle, it signals that the price movement may be unsustainable.
In an uptrend: A inefficient bullish candle suggests that the uptrend is losing momentum, potentially leading to a downward reversal.
In a downtrend: A inefficient bearish candle signals that the downtrend may be weakening, with a potential bullish reversal.
2. Identifying Breakout and Breakdown Failures
This indicator is useful for recognizing false breakouts or false breakdowns.
If price breaks resistance but the candle is inefficient, the breakout may be weak and could fail quickly.
If price breaks support with an inefficient bearish candle, the breakdown could be a false signal, with price reverting back above support.
3. Recognizing Weak Trends
Inefficient candles help you spot when a trend is losing strength and could soon reverse or consolidate.
In an uptrend: A series of dark body bullish candles suggests that the uptrend may be weakening, signaling a potential correction or trend reversal.
In a downtrend: A series of dark body bearish candles suggests that the selling pressure is weakening, indicating a potential bullish reversal.
4. Fine-Tuning Entries and Exits
Inefficient candles offer an opportunity to fine-tune your entries and exits based on weak price moves.
Entering a trade: An inefficient candle near key support or resistance can indicate a reversal, making it a good entry point for a counter-trend position.
Exiting a trade: If you're already in a trend, and an inefficient candle appears, it suggests the trend is losing strength, indicating it may be a good time to exit before a potential reversal.
5. Fine-Tuning with Inputs
The Vacuum Candles indicator includes two key inputs:
Length: The number of candles used to calculate the average price movement and volume. A longer length (e.g., 20-30) smooths out the inefficiencies, while a shorter length (e.g., 10-15) makes the indicator more sensitive to recent price moves.
Multiplier: Controls the threshold for what is considered an inefficient candle:
A higher Multiplier (e.g., 1.5–3) filters out smaller inefficiencies and focuses on large discrepancies.
A lower Multiplier (e.g., 0.1–0.9) captures even smaller inefficiencies in highly efficient markets.

Moving AveragesUseful moving averages packed in a single indicator:
- 50 and 200 Simple Moving Averages
- 8, 13, 21, and 34 Exponential Moving Averages

Advanced Order Flow Indicatorbest order flow indicator can be used with i types of indicators and is best with 1 hour time frame

Sweep After Rally w/ TP + Overnight High/Low (Unbiased)Rally into a sweeping candle with volume. Used for reversals - pair this with MacD Divergence after a sweep of a prior day value area high/low or overnight high/low
