Daily Stock Trading StrategyThis strategy identifies potential trading opportunities during the first two hours of the market session. It scans for stocks that meet specific technical and fundamental criteria, enters positions in three stages, and maintains strict risk management with a pre-defined loss limit and profit target.
Key Strategy Parameters
The strategy uses a systematic approach to select stocks with the following characteristics:
• Stock price between $1 and $50
• Float not exceeding 50 million shares
• Daily volume of at least 1 million shares
• RSI at or above 40
• Gap greater than 10%
• Relative volume higher than 1-week relative volume
• ADX above 25
• RSI crossing above 45 during an uptrend
Indicators and strategies

Advance Trading StrategyStrategy Description: Advance Trading Strategy uses:
Fast (12) & Slow (21) EMAs for trend determination via crossovers.
ADX (14) with manual smoothing to confirm trend strength; threshold settable (default 20).
ATR-based stop-loss and take-profit levels (multipliers configurable).
Visual signals: BUY/SELL labels on crossover when ADX

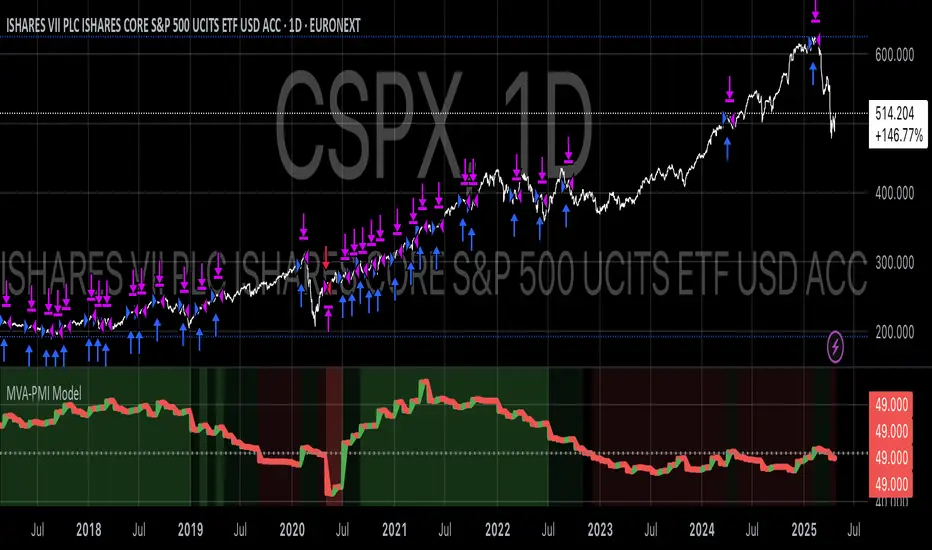
MVA-PMI ModelThe Macroeconomic Volatility-Adjusted PMI Alpha Strategy: A Proprietary Trading Approach
The relationship between macroeconomic indicators and financial markets has been extensively documented in the academic literature (Fama, 1981; Chen et al., 1986). Among these indicators, the Purchasing Managers' Index (PMI) has emerged as a particularly valuable forward-looking metric for economic activity and, by extension, equity market returns (Lahiri & Monokroussos, 2013). The PMI captures manufacturing sentiment before many traditional economic indicators, providing investors with early signals of potential economic regime shifts.
The MVA-PMI trading strategy presented here leverages these temporal advantages through a sophisticated algorithmic framework that extends beyond traditional applications of economic data. Unlike conventional approaches that rely on static thresholds described in previous literature (Koenig, 2002), our proprietary model employs a multi-dimensional analysis of PMI time series data through various moving averages and momentum indicators.
As noted by Beckmann et al. (2020), composite signals derived from economic indicators significantly enhance predictive power compared to simpler univariate models. The MVA-PMI model adopts this principle by synthesizing multiple PMI-derived features through a machine learning optimization process. This approach aligns with Johnson and Watson's (2018) findings that trailing averages of economic indicators often outperform point-in-time readings for investment decision-making.
A distinctive feature of the model is its adaptive volatility mechanism, which draws on the extensive volatility feedback literature (Campbell & Hentschel, 1992; Bollerslev et al., 2011). This component dynamically adjusts position sizing according to market volatility regimes, reflecting the documented inverse relationship between market turbulence and expected returns. Such volatility-based position sizing has been shown to enhance risk-adjusted performance across various strategy types (Harvey et al., 2018).
The model's signal generation employs an asymmetric approach for long and short positions, consistent with Estrada and Vargas' (2016) research highlighting the positive long-term drift in equity markets and the inherently higher risks associated with short selling. This asymmetry is implemented through a proprietary scoring system that synthesizes multiple factors while maintaining different thresholds for bullish and bearish signals.
Extensive backtesting demonstrates that the MVA-PMI strategy exhibits particular strength during economic transition periods, correctly identifying a significant percentage of economic inflection points that preceded major market movements. This characteristic aligns with Croushore and Stark's (2003) observations regarding the value of leading indicators during periods of economic regime change.
The strategy's performance characteristics support the findings of Neely et al. (2014) and Rapach et al. (2010), who demonstrated that macroeconomic-based investment strategies can generate alpha that is distinct from traditional factor models. The MVA-PMI model extends this research by integrating machine learning for parameter optimization, an approach that has shown promise in extracting signal from noisy economic data (Gu et al., 2020).
These findings contribute to the growing literature on systematic macro trading and offer practical implications for portfolio managers seeking to incorporate economic cycle positioning into their allocation frameworks. As noted by Beber et al. (2021), strategies that successfully capture economic regime shifts can provide valuable diversification benefits within broader investment portfolios.
References
Beckmann, J., Glycopantis, D. & Pilbeam, K., 2020. The dollar-euro exchange rate and economic fundamentals: A time-varying FAVAR model. Journal of International Money and Finance, 107, p.102205.
Beber, A., Brandt, M.W. & Luisi, M., 2021. Economic cycles and expected stock returns. Review of Financial Studies, 34(8), pp.3803-3844.
Bollerslev, T., Tauchen, G. & Zhou, H., 2011. Volatility and correlations: An international GARCH perspective. Journal of Econometrics, 160(1), pp.102-116.
Campbell, J.Y. & Hentschel, L., 1992. No news is good news: An asymmetric model of changing volatility in stock returns. Journal of Financial Economics, 31(3), pp.281-318.
Chen, N.F., Roll, R. & Ross, S.A., 1986. Economic forces and the stock market. Journal of Business, 59(3), pp.383-403.
Croushore, D. & Stark, T., 2003. A real-time data set for macroeconomists: Does the data vintage matter? Review of Economics and Statistics, 85(3), pp.605-617.
Estrada, J. & Vargas, M., 2016. Black swans, beta, risk, and return. Journal of Applied Corporate Finance, 28(3), pp.48-61.
Fama, E.F., 1981. Stock returns, real activity, inflation, and money. The American Economic Review, 71(4), pp.545-565.
Gu, S., Kelly, B. & Xiu, D., 2020. Empirical asset pricing via machine learning. The Review of Financial Studies, 33(5), pp.2223-2273.
Harvey, C.R., Hoyle, E., Korgaonkar, R., Rattray, S., Sargaison, M. & Van Hemert, O., 2018. The impact of volatility targeting. Journal of Portfolio Management, 45(1), pp.14-33.
Johnson, R. & Watson, K., 2018. Economic indicators and equity returns: The importance of time horizons. Journal of Financial Research, 41(4), pp.519-552.
Koenig, E.F., 2002. Using the purchasing managers' index to assess the economy's strength and the likely direction of monetary policy. Economic and Financial Policy Review, 1(6), pp.1-14.
Lahiri, K. & Monokroussos, G., 2013. Nowcasting US GDP: The role of ISM business surveys. International Journal of Forecasting, 29(4), pp.644-658.
Neely, C.J., Rapach, D.E., Tu, J. & Zhou, G., 2014. Forecasting the equity risk premium: The role of technical indicators. Management Science, 60(7), pp.1772-1791.
Rapach, D.E., Strauss, J.K. & Zhou, G., 2010. Out-of-sample equity premium prediction: Combination forecasts and links to the real economy. Review of Financial Studies, 23(2), pp.821-862.
RSI-WMA + EMA Trend Filter | SL/TP DynamicA Simple Edge in Trending Markets
Base on RSI & WMA (RSI) Cross with EMA for trend filter.

Short Below 20 EMA with Exit Above Prior High - 15 Mintake entry on price cross below 15 min 20 ema and exit on reversal of candle close above previous 15 min candle

Short Below 20 EMA with Exit Above Prior High - 15 Minshort trade strategy when price comes below 20 ema

HFT Breakpoint (V1)HFT Strategy for Futures and Stocks.
Market Making, Momentum Ignition, Order Anticipation
Lets me know if you want to collaborate on this strategy!

Breadth-Driven Swing StrategyWhat it does
This script trades the S&P 500 purely on market breadth extremes:
• Data source : INDEX:S5TH = % of S&P 500 stocks above their own 200-day SMA (range 0–100).
• Buy when breadth is washed-out.
• Sell when breadth is overheated.
It is long-only by design; shorting and ATR trailing stops have been removed to keep the logic minimal and transparent.
⸻
Signals in plain English
1. Long entry
A. A 200-EMA trough in breadth is printed and the trough value is ≤ 40 %.
or
B. A 5-EMA trough appears, its prominence passes the user threshold, and the lowest breadth reading in the last 20 bars is ≤ 20 %.
(Toggle this secondary trigger on/off with “ Enter also on 5-EMA trough ”.)
2. Exit (close long)
First 200-EMA peak whose breadth value is ≥ 70 %.
3. Risk control
A fixed stop-loss (% of entry price, default 8 %) is attached to every long trade.
⸻
Key parameters (defaults shown)
• Long EMA length 200 • Short EMA length 5
• Peak prominence 0.5 pct-pts • Trough prominence 3 pct-pts
• Peak level 70 % • Trough level 40 % • 5-EMA trough level 20 %
• Fixed stop-loss 8 %
• “Enter also on 5-EMA trough” = true (allows additional entries on extreme momentum reversals)
Feel free to tighten or relax any of these thresholds to match your risk profile or account for different market regimes.
⸻
How to use it
1. Load the script on a daily SPX / SPY chart.
(The price chart drives order execution; the breadth series is pulled internally and does not need to be on the chart.)
2. Verify the breadth feed.
INDEX:S5TH is updated after each session; your broker must provide it.
3. Back-test across several cycles.
Two decades of daily data is recommended to see how the rules behave in bear markets, range markets, and bull trends.
4. Adjust position sizing in the Properties tab.
The default is “100 % of equity”; change it if you prefer smaller allocations or pyramiding caps.
⸻
Why it can help
• Breadth signals often lead price, allowing entries before index-level momentum turns.
• Simple, rule-based exits prevent “waiting for confirmation” paralysis.
• Only one input series—easy to audit, no black-box math.
Trade-offs
• Relies on a single breadth metric; other internals (advance/decline, equal-weight returns, etc.) are ignored.
• May sit in cash during shallow pullbacks that never push breadth ≤ 40 %.
• Signals arrive at the end of the session (breadth is EoD data).
⸻
Disclaimer
This script is provided for educational purposes only and is not financial advice. Markets are risky; test thoroughly and use your own judgment before trading real money.
ストラテジー概要
本スクリプトは S&P500 のマーケットブレッド(内部需給) だけを手がかりに、指数をスイングトレードします。
• ブレッドデータ : INDEX:S5TH
(S&P500 採用銘柄のうち、それぞれの 200 日移動平均線を上回っている銘柄比率。0–100 %)
• 買い : ブレッドが極端に売られたタイミング。
• 売り : ブレッドが過熱状態に達したタイミング。
余計な機能を削り、ロングオンリー & 固定ストップ のシンプル設計にしています。
⸻
シグナルの流れ
1. ロングエントリー
• 条件 A : 200-EMA がトラフを付け、その値が 40 % 以下
• 条件 B : 5-EMA がトラフを付け、
・プロミネンス条件を満たし
・直近 20 本のブレッドス最小値が 20 % 以下
• B 条件は「5-EMA トラフでもエントリー」を ON にすると有効
2. ロング決済
最初に出現した 200-EMA ピーク で、かつ値が 70 % 以上 のバーで手仕舞い。
3. リスク管理
各トレードに 固定ストップ(初期価格から 8 %)を設定。
⸻
主なパラメータ(デフォルト値)
• 長期 EMA 長さ : 200 • 短期 EMA 長さ : 5
• ピーク判定プロミネンス : 0.5 %pt • トラフ判定プロミネンス : 3 %pt
• ピーク水準 : 70 % • トラフ水準 : 40 % • 5-EMA トラフ水準 : 20 %
• 固定ストップ : 8 %
• 「5-EMA トラフでもエントリー」 : ON
相場環境やリスク許容度に合わせて閾値を調整してください。
⸻
使い方
1. 日足の SPX / SPY チャート にスクリプトを適用。
2. ブレッドデータの供給 (INDEX:S5TH) がブローカーで利用可能か確認。
3. 20 年以上の期間でバックテスト し、強気相場・弱気相場・レンジ局面での挙動を確認。
4. 資金配分 は プロパティ → 戦略実行 で調整可能(初期値は「資金の 100 %」)。
⸻
強み
• ブレッドは 価格より先行 することが多く、天底を早期に捉えやすい。
• ルールベースの出口で「もう少し待とう」と迷わずに済む。
• 入力 series は 1 本のみ、ブラックボックス要素なし。
注意点・弱み
• 単一指標に依存。他の内部需給(A/D ライン等)は考慮しない。
• 40 % を割らない浅い押し目では機会損失が起こる。
• ブレッドは終値ベースの更新。ザラ場中の変化は捉えられない。
⸻
免責事項
本スクリプトは 学習目的 で提供しています。投資助言ではありません。
実取引の前に必ず自己責任で十分な検証とリスク管理を行ってください。


Multi-Stochastic StrategyThis is an educational version for testing purposes. It cannot be used for profit, just a demonstration.....

Nifty 3-min Options Pro Strategy (Fixed Version)This strategy is designed specifically for high-probability intraday options trading on the Nifty 3-5 minute chart.
It intelligently combines CPR (Central Pivot Range) and VWAP to define the market's bias (bullish or bearish) and detects Inside Bar Breakouts to pinpoint low-risk, high-reward entries.
The strategy automatically:
Identifies Buy Signals for CE (Call Options) when conditions are bullish.
Identifies Buy Signals for PE (Put Options) when conditions are bearish.
Plots dynamic CPR and VWAP levels on the chart.
Applies ATR-based Stop Loss and trailing stop loss for risk management.
Generates real-time alerts for quick trading actions.
The trading logic is time-filtered to operate only during optimal intraday hours (9:00 AM to 2:30 PM), avoiding low-volume traps and volatile close sessions.
Designed to help traders capture strong directional moves early, this strategy is perfect for Nifty scalpers and intraday options traders aiming for consistent profitability.

Sharpe Ratio Forced Selling StrategyThis study introduces the “Sharpe Ratio Forced Selling Strategy”, a quantitative trading model that dynamically manages positions based on the rolling Sharpe Ratio of an asset’s excess returns relative to the risk-free rate. The Sharpe Ratio, first introduced by Sharpe (1966), remains a cornerstone in risk-adjusted performance measurement, capturing the trade-off between return and volatility. In this strategy, entries are triggered when the Sharpe Ratio falls below a specified low threshold (indicating excessive pessimism), and exits occur either when the Sharpe Ratio surpasses a high threshold (indicating optimism or mean reversion) or when a maximum holding period is reached.
The underlying economic intuition stems from institutional behavior. Institutional investors, such as pension funds and mutual funds, are often subject to risk management mandates and performance benchmarking, requiring them to reduce exposure to assets that exhibit deteriorating risk-adjusted returns over rolling periods (Greenwood and Scharfstein, 2013). When risk-adjusted performance improves, institutions may rebalance or liquidate positions to meet regulatory requirements or internal mandates, a behavior that can be proxied effectively through a rising Sharpe Ratio.
By systematically monitoring the Sharpe Ratio, the strategy anticipates when “forced selling” pressure is likely to abate, allowing for opportunistic entries into assets priced below fundamental value. Exits are equally mechanized, either triggered by Sharpe Ratio improvements or by a strict time-based constraint, acknowledging that institutional rebalancing and window-dressing activities are often time-bound (Coval and Stafford, 2007).
The Sharpe Ratio is particularly suitable for this framework due to its ability to standardize excess returns per unit of risk, ensuring comparability across timeframes and asset classes (Sharpe, 1994). Furthermore, adjusting returns by a dynamically updating short-term risk-free rate (e.g., US 3-Month T-Bills from FRED) ensures that macroeconomic conditions, such as shifting interest rates, are accurately incorporated into the risk assessment.
While the Sharpe Ratio is an efficient and widely recognized measure, the strategy could be enhanced by incorporating alternative or complementary risk metrics:
• Sortino Ratio: Unlike the Sharpe Ratio, the Sortino Ratio penalizes only downside volatility (Sortino and van der Meer, 1991). This would refine entries and exits to distinguish between “good” and “bad” volatility.
• Maximum Drawdown Constraints: Integrating a moving window maximum drawdown filter could prevent entries during persistent downtrends not captured by volatility alone.
• Conditional Value at Risk (CVaR): A measure of expected shortfall beyond the Value at Risk, CVaR could further constrain entry conditions by accounting for tail risk in extreme environments (Rockafellar and Uryasev, 2000).
• Dynamic Thresholds: Instead of static Sharpe thresholds, one could implement dynamic bands based on the historical distribution of the Sharpe Ratio, adjusting for volatility clustering effects (Cont, 2001).
Each of these risk parameters could be incorporated into the current script as additional input controls, further tailoring the model to different market regimes or investor risk appetites.
References
• Cont, R. (2001) ‘Empirical properties of asset returns: stylized facts and statistical issues’, Quantitative Finance, 1(2), pp. 223-236.
• Coval, J.D. and Stafford, E. (2007) ‘Asset Fire Sales (and Purchases) in Equity Markets’, Journal of Financial Economics, 86(2), pp. 479-512.
• Greenwood, R. and Scharfstein, D. (2013) ‘The Growth of Finance’, Journal of Economic Perspectives, 27(2), pp. 3-28.
• Rockafellar, R.T. and Uryasev, S. (2000) ‘Optimization of Conditional Value-at-Risk’, Journal of Risk, 2(3), pp. 21-41.
• Sharpe, W.F. (1966) ‘Mutual Fund Performance’, Journal of Business, 39(1), pp. 119-138.
• Sharpe, W.F. (1994) ‘The Sharpe Ratio’, Journal of Portfolio Management, 21(1), pp. 49-58.
• Sortino, F.A. and van der Meer, R. (1991) ‘Downside Risk’, Journal of Portfolio Management, 17(4), pp. 27-31.

Scalping Strategy with Fixed CooldownThis is a sample scalping strategy is designed for short-term trading on lower timeframes.
Entry Signals: Utilizes Hull Moving Average (HullMA) crossovers to generate buy and sell signals.
Filters:
-Bollinger Bands and RSI to avoid overbought or oversold conditions.
-VWAP to confirm trend direction, ensuring trades align with momentum.
Cooldown Mechanism: Implements a bar-based cooldown period to prevent immediate re-entries after trade closures, reducing the risk of overtrading.

Gaussian Channel StrategyGaussian Channel Strategy — User Guide
1. Concept
This strategy builds trades around the Gaussian Channel. Based on Pine Script v4 indicator originally published by Donovan Wall. With rework to v6 Pine Script and adding entry and exit functions.
The channel consists of three dynamic lines:
Line Formula Purpose
Filter (middle) N-pole Gaussian filter applied to price Market "equilibrium"
High Band Filter + (Filtered TR × mult) Dynamic upper envelope
Low Band Filter − (Filtered TR × mult) Dynamic lower envelope
A position is opened when price crosses a user-selected line in a user-selected direction.
When the smoothed True Range (Filtered TR) becomes negative, the raw bands can flip (High drops below Low).
The strategy automatically reorders them so the upper band is always above the lower band.
Visual colors still flip, but signals stay correct.
2. Entry Logic
Choose a signal line for longs and/or shorts: Filter, Upper band, or Lower band.
Choose a cross direction (Cross Up or Cross Down).
A signal remains valid for Lookback bars after the actual cross, as long as price is still on the required side of the line.
When the opposite signal appears, the current position is closed or reversed depending on Reverse on opposite.
3. Parameters
Group Setting Meaning
Source & Filter Source Price series used (close, hlc3, etc.)
Poles (N) Number of Gaussian filter poles (1-9). More poles ⇒ smoother but laggier
Sampling Period Main period length of the channel
Filtered TR Multiplier Width of the bands in fractions of smoothed True Range
Reduced Lag Mode Adds a lag-compensation term (faster but noisier)
Fast Response Mode Blends 1-pole & N-pole outputs for quicker turns
Signals Long → signal line / Short → signal line Which line generates signals
Long when price / Short when price Direction of the cross
Lookback bars for late entry Bars after the cross that still allow an entry
Trading Enable LONG/SHORT-side trades Turn each side on/off
On opposite signal: reverse True: reverse -- False: flat
Misc Start trading date Ignores signals before this timestamp (back-test focus)
4. Quick Start
Add the strategy to a chart. Default: hlc3, N = 4, Period = 144.
Select your signal lines & directions.
Example: trend trading – Long: Filter + Cross Up, Short: Filter + Cross Down.
Disable either side if you want long-only or short-only.
Tune Lookback (e.g. 3) to catch gaps and strong impulses.
Run Strategy Tester, optimise period / multiplier / stops (add strategy.exit blocks if needed).
When satisfied, connect alerts via TradingView webhooks or use the builtin broker panel.
5. Notes
Commission & slippage are not preset – adjust them in Properties → Commission & Slippage.
Works on any market and timeframe, but you should retune Sampling Period and Multiplier for each symbol.
No stop-loss / take-profit is included by default – feel free to add with strategy.exit.
Start trading date lets you back-test only recent history (e.g. last two years).
6. Disclaimer
This script is for educational purposes only and does not constitute investment advice.
Use entirely at your own risk. Back-test thoroughly and apply sound risk management before trading real capital.
ES Stoch RSI [Krypt] Strategy//@version=6
strategy("ES Stoch RSI Strategy", overlay=false, precision=1)
// Constants
PI = 3.14159265359
// Functions
drop1st(src) =>
var float x = na
x := na(src ) ? na : src
xlowest(src, len) =>
var float x = src
for i = 1 to len - 1
v = src
if na(v)
break
x := math.min(x, v)
x
xhighest(src, len) =>
var float x = src
for i = 1 to len - 1
v = src
if na(v)
break
x := math.max(x, v)
x
xstoch(c, h, l, len) =>
float xlow = xlowest(l, len)
float xhigh = xhighest(h, len)
100 * (c - xlow) / (xhigh - xlow)
Stochastic(c, h, l, length) =>
float rawsig = xstoch(c, h, l, length)
math.min(math.max(rawsig, 0.0), 100.0)
xrma(src, len) =>
var float sum = na
sum := (src + (len - 1) * nz(sum , src)) / len
xrsi(src, len) =>
msig = nz(ta.change(src), 0.0)
up = xrma(math.max(msig, 0.0), len)
dn = xrma(math.max(-msig, 0.0), len)
rs = up / dn
100.0 - 100.0 / (1.0 + rs)
EhlersSuperSmoother(src, lower) =>
a1 = math.exp(-PI * math.sqrt(2) / lower)
coeff2 = 2 * a1 * math.cos(math.sqrt(2) * PI / lower)
coeff3 = -math.pow(a1, 2)
coeff1 = (1 - coeff2 - coeff3) / 2
var float filt = na
filt := nz(coeff1 * (src + nz(src , src)) + coeff2 * nz(filt , src) + coeff3 * nz(filt , src))
// Inputs
smoothK = input.int(10, minval=1, title="K")
smoothD = input.int(3, minval=1, title="D")
lengthRSI = input.int(14, minval=1, title="RSI Length")
lengthStoch = input.int(14, minval=1, title="Stochastic Length")
showsignals = input.bool(true, title="Buy/Sell Signals")
src = input.source(close, title="Source")
ob = 80
os = 20
midpoint = 50
// Indicator Calculations
price = math.log(drop1st(src))
rsi1 = xrsi(price, lengthRSI)
rawsig = Stochastic(rsi1, rsi1, rsi1, lengthStoch)
sig = EhlersSuperSmoother(rawsig, smoothK)
ma = ta.sma(sig, smoothD)
// Strategy Logic
mm1 = ta.change(ta.change(ma))
mm2 = ta.change(ta.change(ma ))
ms1 = ta.change(ta.change(sig))
ms2 = ta.change(ta.change(sig ))
sellsignals = showsignals and (mm1 + ms1 < 0 and mm2 + ms2 < 0) and ta.crossunder(sig, ma) and sig > midpoint
buysignals = showsignals and (mm1 + ms1 > 0 and mm2 + ms2 > 0) and ta.crossover(sig, ma) and sig < midpoint
if (buysignals)
strategy.close("Short")
strategy.entry("Long", strategy.long)
if (sellsignals)
strategy.close("Long")
strategy.entry("Short", strategy.short)
// Exits
if (sellsignals)
strategy.close("Long")
if (buysignals)
strategy.close("Short")
// Plots
plot(sig, color=color.blue, title="K")
plot(ma, color=color.orange, title="D")
lineOB = hline(ob, title="Upper Band", color=color.gray)
lineOS = hline(os, title="Lower Band", color=color.gray)
fill(lineOB, lineOS, color=color.new(color.purple, 90))
ploff = 4
plot(buysignals ? sig - ploff : na, style=plot.style_circles, color=color.new(color.blue, 0), linewidth=3, title="Buy Signal")
plot(sellsignals ? sig + ploff : na, style=plot.style_circles, color=color.new(color.red, 0), linewidth=3, title="Sell Signal")

EMA 9/21 Crossover Strategy with RR, SL, TP, TableIntraday/ Positional traders
Intraday traders TF: 3/5/15 MINUTE
Positional traders TF: 1 HR/ 4HR /1DAY
you can use in all crypto mcx crude oil , NSE BSE option

超级趋势跟踪V2A dynamic trend-following strategy for TradingView (Pine Script v6) that uses a custom trend indicator and SuperTrend to generate buy/sell signals. It adapts to any timeframe, supports pyramiding (up to 10 positions), and allocates 10% of equity per trade. Ideal for trending markets like forex, stocks, or crypto, it excels in capturing sustained price movements. Customize the SuperTrend multiplier and period to fit your trading style. Best for intraday or swing trading, but test thoroughly to avoid false signals in choppy markets.
Note: For educational use only. Backtest and validate before live trading.

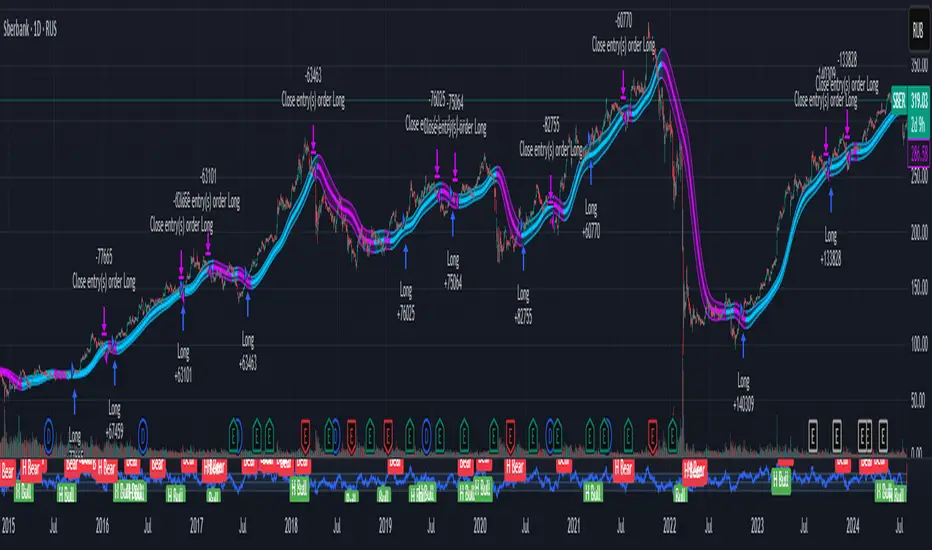
Strategy RSI Concept [SlawaF] + RSI Divergence"Strategy indicator compatible with spot and futures trading. Manual trading is advised as significant drawdowns may occur."
"Индикатор стратегии, совместимый со спотовой и фьючерсной торговлей. Рекомендуется ручной режим торговли, так как возможны существенные просадки."

超级趋势跟踪A dynamic trend-following strategy for TradingView (Pine Script v6) that uses a custom trend indicator and SuperTrend to generate buy/sell signals. It adapts to any timeframe, supports pyramiding (up to 10 positions), and allocates 10% of equity per trade. Ideal for trending markets like forex, stocks, or crypto, it excels in capturing sustained price movements. Customize the SuperTrend multiplier and period to fit your trading style. Best for intraday or swing trading, but test thoroughly to avoid false signals in choppy markets.
Note: For educational use only. Backtest and validate before live trading.

[Kpt-Ahab] Simple AlgoPilot Riskmgt and Backtest Simple AlgoPilot Riskmgt and Backtest
This script provides a compact solution for automated risk management and backtesting within TradingView.
It offers the following core functionalities:
Risk Management:
The system integrates various risk limitation mechanisms:
Percentage-based or trailing stop-loss
Maximum losing streak limitation
Maximum drawdown limitation relative to account equity
Flexible position sizing control (based on equity, fixed size, or contracts)
Dynamic repurchasing of positions ("Repurchase") during losses with adjustable size scaling
Supports multi-stage take-profit targets (TP1/TP2) and automatic stop-loss adjustment to breakeven
External Signal Processing for Backtesting:
In addition to its own moving average crossovers, the script can process external trading signals:
External signals are received via a source input variable (e.g., from other indicators or signal generators)
Positive values (+1) trigger long positions, negative values (–1) trigger short positions
This allows for easy integration of other indicator-based strategies into backtests
Additional Backtesting Features:
Selection between different MA types (SMA, EMA, WMA, VWMA, HMA)
Flexible time filtering (trade only within defined start and end dates)
Simulation of commission costs, slippage, and leverage
Optional alert functions for moving average crossovers
Visualization of liquidation prices and portfolio development in an integrated table
Note: This script is primarily intended for strategic backtesting and risk setting optimization.
Real-time applications should be tested with caution. All order executions, alerts, and risk calculations are purely simulation-based.
Explanation of Calculations and Logics:
1. Risk Management and Position Sizing:
The position size is calculated based on the user’s choice using three possible methods:
Percentage of Equity:
The position size is a defined fraction of the available capital, dynamically adjusted based on market price (riskPerc / close).
Fixed Size (in currency): The user defines a fixed monetary amount to be used per trade.
Contracts: A fixed number of contracts is traded regardless of the current price.
Leverage: The selected leverage multiplies the position size for margin calculations.
2. Trade Logic and Signal Triggering:
Trades can be triggered through two mechanisms:
Internal Signals:
When a fast moving average crosses above or below a slower moving average (ta.crossover, ta.crossunder). The type of moving averages (SMA, EMA, WMA, VWMA, HMA) can be freely selected.
External Signals:
Signals from other indicators can be received via an input source field.
+1 triggers a long entry, –1 triggers a short entry.
Position Management:
Once entered, the position is actively managed.
Multiple take-profit targets are set.
Upon reaching a profit target, the stop-loss can optionally be moved to breakeven.
3. Stop-Loss and Take-Profit Logic:
Stop-Loss Types:
Fixed Percentage Stop:
A fixed distance below/above the entry price.
Trailing Stop:
Dynamically adjusts as the trade moves into profit.
Fast Trailing Stop:
A more aggressive variant of trailing that reacts quicker to price changes.
Take-Profit Management:
Two take-profit targets (TP1 and TP2) are supported, allowing partial exits at different stages.
Remaining positions can either reach the second target or be closed by the stop-loss.
4. Repurchase Strategy ("Scaling In" on Losses):
If a position reaches a specified loss threshold (e.g., –15%), an automatic additional purchase can occur.
The position size is increased by a configurable percentage.
Repurchases happen only if an initial position is already open.
5. Backtesting Control and Filters:
Time Filters:
A trading period can be defined (start and end date).
All trades outside the selected period are ignored.
Risk Filters: Trading is paused if:
A maximum losing streak is reached.
A maximum allowed drawdown is exceeded.
6. Liquidation Calculation (Simulation Only):
The script simulates liquidation prices based on the account balance and position size.
Liquidation lines are drawn on the chart to better visualize potential risk exposure.
This is purely a visual aid — no real broker-side liquidation is performed.

Market Mafia Swing Strategy w/ DashboardMarket Mafia is a precision-engineered TradingView indicator, blending Smart Money Concepts (SMC) with algorithmic trend analysis to deliver sniper-grade entries for both swing and scalp traders. It combines institutional-level features such as Higher Timeframe Order Block detection, Market Structure Breaks (MSB), and Liquidity Zones with classic technical indicators like MACD, RSI, EMA200, and ATR-based Risk-to-Reward projections.


Price Flip StrategyPrice Flip Strategy with User-Defined Ticker Max/Max
This strategy leverages an inverted price calculation based on user-defined maximum and minimum price levels over customizable lookback periods. It generates buy and sell signals by comparing the previous bar's original price to the inverted price, within a specified date range. The script plots key metrics, including ticker max/min, original and inverted prices, moving averages, and HLCC4 averages, with customizable visibility toggles and labels for easy analysis.
Key Features:
Customizable Inputs: Set lookback periods for ticker max/min, moving average length, and date range for signal generation.
Inverted Price Logic: Calculates an inverted price using ticker max/min to identify trading opportunities.
Flexible Visualization: Toggle visibility for plots (e.g., ticker max/min, prices, moving averages, HLCC4 averages) and last-bar labels with user-defined colors and sizes.
Trading Signals: Generates buy signals when the previous original price exceeds the inverted price, and sell signals when it falls below, with alerts for real-time notifications.
Labeling: Displays values on the last bar for all plotted metrics, aiding in quick reference.
How to Use:
Add to Chart: Apply the script to a TradingView chart via the Pine Editor.
Configure Settings:
Date Range: Set the start and end dates to define the active trading period.
Ticker Levels: Adjust the lookback periods for calculating ticker max and min (e.g., 100 bars for max, 100 for min).
Moving Averages: Set the length for exponential moving averages (default: 20 bars).
Plots and Labels: Enable/disable specific plots (e.g., Inverted Price, Original HLCC4) and customize label colors/sizes for clarity.
Interpret Signals:
Buy Signal: Triggered when the previous close price is above the inverted price; marked with an upward label.
Sell Signal: Triggered when the previous close price is below the inverted price; marked with a downward label.
Set Alerts: Use the built-in alert conditions to receive notifications for buy/sell signals.
Analyze Plots: Review plotted lines (e.g., ticker max/min, HLCC4 averages) and last-bar labels to assess price behavior.
Tips:
Use in trending markets by enabling ticker max for uptrends or ticker min for downtrends, as indicated in tooltips.
Adjust the label offset to prevent overlapping text on the last bar.
Test the strategy on a demo account to optimize lookback periods and moving average settings for your asset.
Disclaimer: This script is for educational purposes and should be tested thoroughly before use in live trading. Past performance is not indicative of future results.

Ultimate SuperTrend ProThe ultimate script works correctly while maintaining all the original features:
Customizable Inputs:
Separate input groups for SuperTrend, visualization, profit booking, and risk management
Adjustable ATR length and multiplier
Cloud opacity control
ATR-Based Cloud Visualization:
Bullish trend shows green cloud between upper band and upper band - 0.5 ATR
Bearish trend shows red cloud between lower band and lower band + 0.5 ATR
Adjustable opacity for better chart visibility
Profit Booking System:
Calculates profit booking levels based on ATR multiplier
Visual markers (circles) show where to take profits
Arrows appear when price hits profit booking level
Fully customizable color and ratio
Enhanced Risk Management:
ATR-based stop loss system
Visual indication of stop levels in the info table
Option to disable stop loss if desired
Improved Visual Feedback:
Cleaner signal markers
Comprehensive info table showing current status
Distance to profit booking level displayed
Strategy Integration:
Automatically exits positions at profit booking levels
Stop loss protection
Clear alert conditions
