Trading Sessions [BigBeluga]
This indicator brings Smart Money Concept (ICT) session logic to life by plotting key global trading sessions with volume and delta analytics. It not only highlights session ranges but also tracks their midpoints — which often act as intraday support/resistance levels.
🔵 KEY FEATURES
Visual session boxes: Plots boxes for Tokyo, London, New York, and Sydney sessions based on user-defined UTC+0 time ranges.
Volume & delta metrics: Displays total volume and delta volume (buy–sell difference) within each session.
Mid, High & Low Range Extension: Once a session ends, the high, low, and midpoint levels automatically extend — ideal for detecting SR zones.
Session labels: Each box includes a label with session name, time, volume, and delta for quick reference.
Custom session control: Enable or disable sessions individually and configure start/end times.
Clean aesthetics: Transparent shaded boxes with subtle borders make it easy to overlay without clutter.
Sessions Dashboard: Shows the time range of each session and tells you whether the session is currently active.
🔵 USAGE
Enable the sessions you want to monitor (e.g., New York or Tokyo) from the settings.
Use session volume and delta values to gauge the strength and direction of institutional activity.
Watch for price interaction with the extended range — it often acts as dynamic support/resistance after the session ends.
Overlay it with liquidity tools or breaker blocks for intraday strategy alignment.
🔵 EXAMPLES
Extended Future Range acted as resistance/support.
Delta value helped confirm bullish pressure during New York open.
Multiple sessions helped identify kill zone overlaps and high-volume turns.
Trading Sessions is more than just a visual scheduler — it's a precision tool for traders who align with session-based volume dynamics and ICT methodology. Use it to define high-probability zones, confirm volume shifts, and read deeper into the true intent behind market structure.
Indicators and strategies

Relative ATRThis indicator enhances the standard Average True Range (ATR) by providing context about current volatility relative to its recent historical average. It highlights periods where ATR is significantly higher or lower than its own recent norm.

Volume & Price Counter**User Guide for Volume & Price Counter (Candle Structure)**
### 1. Introduction to Volume & Price Counter
The **Volume & Price Counter** (Candle Structure) is a momentum analysis indicator that helps identify which side—buyers or sellers—is dominating the market by counting candles based on the combination of volume and price movement.
The indicator classifies candles into 4 groups:
- **Volume Up, Price Up (Vol ↑ & Price ↑)** – Indicates strong buying pressure.
- **Volume Down, Price Up (Vol ↓ & Price ↑)** – Price is rising but buying momentum is weakening.
- **Volume Up, Price Down (Vol ↑ & Price ↓)** – Indicates strong selling pressure.
- **Volume Down, Price Down (Vol ↓ & Price ↓)** – Price is falling but selling momentum is weakening.
---
### 2. How the Indicator Works
The Volume & Price Counter calculates the number of each candle type over a specific time period to determine which side is currently in control:
- **Green Background**: When the total of (Vol ↑ & Price ↑) + (Vol ↓ & Price ↑) is greater than the total of (Vol ↑ & Price ↓) + (Vol ↓ & Price ↓) → Buyers are in control.
- **Red Background**: When the total of (Vol ↑ & Price ↓) + (Vol ↓ & Price ↓) is greater than the total of (Vol ↑ & Price ↑) + (Vol ↓ & Price ↑) → Sellers are in control.
---
### 3. How to Use the Indicator in Trading
**a) When the background is green**:
- The market is in an uptrend; consider buying during pullbacks to support zones.
- If the green background continues and the number of (Vol ↑ & Price ↑) candles dominates, the price may continue to rise.
- If the green background is present but there are many (Vol ↓ & Price ↑) candles, be cautious as buying strength may be fading.
**b) When the background is red**:
- The downtrend is prevailing; it's better to stay out or look for selling opportunities during pullbacks.
- If the red background continues with a high number of (Vol ↑ & Price ↓) candles, the price may continue to fall.
- If there are many (Vol ↓ & Price ↓) candles during a red background, selling pressure may be weakening—watch for reversal signals.
**c) When the background shifts from red to green**:
- This is a positive signal, indicating buyers are returning to the market.
- Additional volume confirmation is needed to validate a true uptrend.
**d) When the background shifts from green to red**:
- This warns of a potential trend reversal to the downside.
- If volume spikes during the red shift, consider closing long positions.
---
### 4. Combining Volume & Price Counter with Other Indicators
**Combine with support/resistance levels**:
If a green background appears at a strong support zone, it may signal a potential buying opportunity.

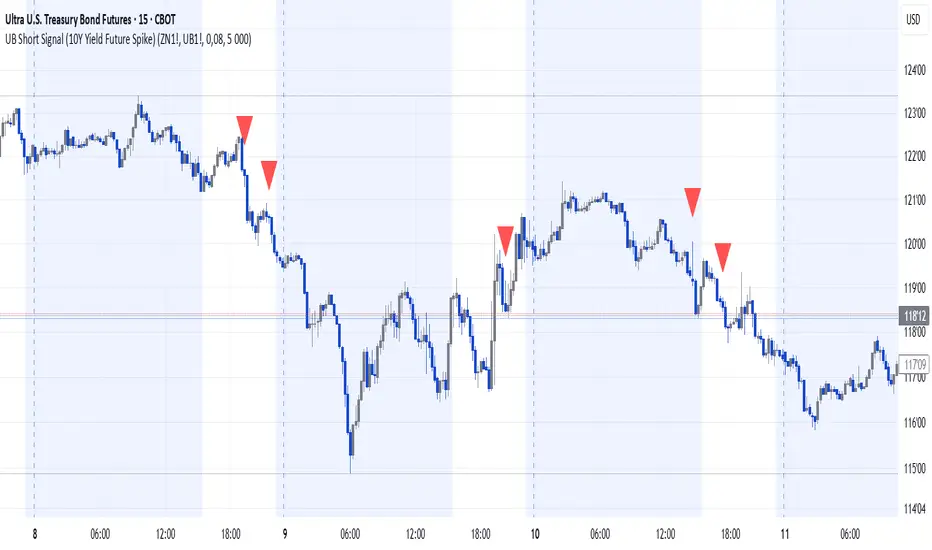
UB Short Signal (10Y Yield Future Spike)"This indicator identifies short opportunities on UB futures based on inverse correlation with 10Y Yield Futures. A macro trading tool to be used with additional confirmations."
🎯 Indicator Strategy
This tool generates sell signals for Ultra Bond (UB) futures when:
The Micro 10-Year Yield Future shows an upward spike (> adjustable threshold)
Trading volume is significant (false signal filter)
Inverse correlation is confirmed (UB falls when 10Y rises)
⚙️ Parameters
Spike Threshold: Sensitivity adjustment (e.g., 0.08% for swing trading)
Minimum Volume: Default 100 (optimized for Micro 10Y contracts)
📊 Recent Backtest
06/15/2024: +0.10% spike → UB dropped -0.3% within 15 minutes
06/18/2024: Valid signal post-CPI release
⚠️ Disclaimer
Analytical tool only – not financial advice
Must be combined with proper risk management
RSI HeartHere's an introduction you can use for your RSI Heart indicator:
---
### RSI Heart Indicator
The **RSI Heart Indicator** provides a visually engaging way to monitor and track the **Relative Strength Index (RSI)** across multiple timeframes (10m, 15m, 30m, and 1H). It not only shows the RSI value but also uses heart-shaped symbols to reflect the current market condition based on RSI levels, making it easier to understand the strength and momentum of a given asset at a glance.
### Key Features:
- **Multi-Timeframe Support**: The indicator pulls the RSI values from multiple timeframes (10 minutes, 15 minutes, 30 minutes, and 1 hour) so you can analyze market strength at different intervals in one view.
- **Heart Symbols**: RSI values are displayed alongside heart emojis (❤️, 💛, 💚) that provide a visual cue for the market condition:
- **❤️ (Overbought or Oversold)**: When RSI is below 27 or above 73.
- **💛 (Near Oversold/Overbought)**: When RSI is between 27-30 or 70-73.
- **💚 (Neutral)**: When RSI is between 30 and 70.
- **Customizable Visibility**: Toggle visibility for each timeframe's RSI using simple on/off settings, giving you control over which timeframes are displayed in your chart.
### How it Can Help:
- **Quick Market Sentiment Analysis**: The heart symbols and RSI values allow you to quickly assess whether an asset is in an overbought or oversold condition.
- **Multi-Timeframe RSI**: By viewing RSI across multiple timeframes, you can gain a more comprehensive understanding of market momentum and strength.
- **Personalized to Your Preferences**: Adjust the settings to only show the timeframes that matter most to you, creating a customized and clean chart view.
This indicator helps traders make more informed decisions by providing a clear, easy-to-read representation of market conditions across various timeframes, all within one indicator.
---
This introduction explains what the indicator does, its features, and how it can benefit traders in a concise and easy-to-understand way.

Key Financial index**Basic Indicators** (updates may be delayed by a few weeks after dividend distribution):
1. **P/E Ratio**: *Price-to-Earnings*. This ratio shows the price investors are willing to pay for each unit of profit the company generates.
- A P/E below 8 is considered good, meaning the company yields a 12.5% annual profit, which implies a payback period of 8 years.
2. **P/B Ratio**: *Price-to-Book Ratio*. This is used to compare a company's market value with its book value.
- A low P/B (usually below 1): May indicate that the stock is undervalued compared to the company’s net asset value. This can be a good investment opportunity but may also signal financial trouble.
- A high P/B (usually above 3): May suggest the stock is overvalued relative to the company’s net assets. This could reflect high growth expectations or potential overvaluation.
3. **D/E Ratio**: *Debt-to-Equity Ratio* is a financial metric that measures a company’s financial leverage.
D/E Ratio = Total Liabilities / Shareholders' Equity.
It compares the total liabilities of a company to its equity to indicate how much debt is used to finance its assets compared to shareholder investments.
- D/E Ratio below 1: Generally considered safe.
- D/E Ratio between 1 and 2: May be acceptable depending on the industry.
- D/E Ratio above 2: May indicate high financial risk.
4. **CR Ratio**: *Current Ratio*, an important liquidity metric used to assess a company’s ability to pay off short-term liabilities using its short-term assets.
- CR Ratio > 1: Indicates the company has enough current assets to pay off its short-term debts. The higher the ratio, the better the liquidity position.
- CR Ratio < 1: Suggests the company may face difficulties in meeting short-term obligations. This can be a red flag for financial stability.
5. **Profit Margin**: A key financial indicator that measures a company’s profitability relative to its revenue. It shows what percentage of revenue remains after all related costs are deducted.
**General significance of Profit Margin**:
- **Operational Efficiency**: A high profit margin indicates efficient cost management and the ability to generate strong profits from revenue.
- **Industry Comparison**: Comparing a company’s profit margin with its industry peers helps assess its competitive position and relative performance.
**Note**:
- There is no single “good” margin across all industries. Each industry has different cost structures and competition levels, leading to varying average margins.
- When analyzing profit margins, one must consider the industry context, the company’s business model, and market trends.
6. **Growth Expectation ↑**: This refers to the expected profit growth. The percentage figure reflects how much growth the market expects the company to achieve in the next financial report based on the current stock price.
- The lower the expected growth rate (typically below 15%), the safer the current price is considered.
- A high expected growth rate may indicate that the market anticipates a profit breakthrough or that the stock is trading above its intrinsic value relative to actual earnings.

Multi-Factor Reversal AnalyzerMulti-Factor Reversal Analyzer – Quantitative Reversal Signal System
OVERVIEW
Multi-Factor Reversal Analyzer is a comprehensive technical analysis toolkit designed to detect market tops and bottoms with high precision. It combines trend momentum analysis, price action behavior, wave oscillation structure, and volatility breakout potential into one unified indicator.
This indicator is not a random mix of tools — each module is carefully selected for a specific purpose. When combined, they form a multi-dimensional view of the market, merging trend analysis, momentum divergence, and volatility compression to produce high-confidence signals.
Why Combine These Modules?
Module Combination Ideas & How to Use Them
Factor A: Trend Detector + Gold Zone
Concept:
• The Trend Detector (light yellow histogram) evaluates market strength:
• Histogram trending downward or staying below 50 → bearish conditions;
• Trending upward or staying above 50 → bullish conditions.
• The Gold Zone identifies areas of volatility compression — typically a prelude to explosive market moves.
Practical Application:
• When the Gold Zone appears and the Trend Detector is bearish → likely downside move;
• When the Gold Zone appears and the Trend Detector is bullish → likely upside breakout.
• Note: The Gold Zone does not mean the bottom is in. It is not a buy signal on its own — always combine it with other modules for directional bias.
Factor B: PAI + Wave Trend
Concept:
• PAI (Price Action Index) is a custom oscillator that combines price momentum with volatility dispersion, displaying strength zones:
• Green area → bullish dominance;
• Red area → bearish pressure.
• Wave Trend offers smoothed crossover signals via the main and signal lines.
Practical Application:
• When PAI is in the green zone and Wave Trend makes a bullish crossover → potential reversal to the upside;
• When PAI is in the red zone and Wave Trend shows a bearish crossover → potential start of a downtrend.
Factor C: Trend Detector + PAI
Concept:
• Combines directional trend strength with price action strength to confirm setups via confluence.
Practical Application:
• Trend Detector histogram bottoms out + PAI enters the green zone → high chance of upward reversal;
• Histogram tops out + PAI in the red zone → increased likelihood of downside continuation.
Multi-Factor Confluence (Advanced Use)
• When Trend Detector, PAI, and Wave Trend all align in the same direction (bullish or bearish), the directional signal becomes significantly more reliable.
• This setup is especially useful for trend-following or swing trade entries.
KEY FEATURES
1. Multi-Layer Reversal Logic
• Combines trend scoring, oscillator divergence, and volatility squeezes for triangulated reversal detection.
• Helps traders distinguish between trend pullbacks and true reversals.
2. Advanced Divergence Detection
• Detects both regular and hidden divergences using pivot-based confirmation logic.
• Customizable lookback ranges and pivot sensitivity provide flexible tuning for different market styles.
3. Gold Zone Volatility Compression
• Highlights pre-breakout zones using custom oscillation models (RSI, harmonic, Karobein, etc.).
• Improves anticipation of breakout opportunities following low-volatility compressions.
4. Trend Direction Context
• PAI and Trend Score components provide top-down insight into prevailing bias.
• Built-in “Straddle Area” highlights consolidation zones; breakouts from this area often signal new trend phases.
5. Flexible Visualization
• Color-coded trend bars, reversal markers, normalized oscillator plots, and trend strength labels.
• Designed for both visual discretionary traders and data-driven system developers.
USAGE GUIDELINES
1. Applicable Markets
• Suitable for stocks, crypto, futures, and forex
• Supports reversal, mean-reversion, and breakout trading styles
2. Recommended Timeframes
• Short-term traders: 5m / 15m / 1H — use Wave Trend divergence + Gold Zone
• Swing traders: 4H / Daily — rely on Price Action Index and Trend Detector
• Macro trend context: use PAI HTF mode for higher timeframe overlays
3. Reversal Strategy Flow
• Watch for divergence (WT/PAI) + Gold Zone compression
• Confirm with Trend Score weakening or flipping
• Use Straddle Area breakout for final trigger
• Optional: enable bar coloring or labels for visual reinforcement
• The indicator performs optimally when used in conjunction with a harmonic pattern recognition tool
4. Additional Note on the Gold Zone
The “Gold Zone” does not directly indicate a market bottom. Since it is displayed at the bottom of the chart, it may be misunderstood as a bullish signal. In reality, the Gold Zone represents a compression of price momentum and volatility, suggesting that a significant directional move is about to occur. The direction of that move—upward or downward—should be determined by analyzing the histogram:
• If histogram momentum is weakening, the Gold Zone may precede a downward move.
• If histogram momentum is strengthening, it may signal an upcoming rebound or rally.
Treat the Gold Zone as a warning of impending volatility, and always combine it with trend indicators for accurate directional judgment.
RISK DISCLAIMER
• This indicator calculates trend direction based on historical data and cannot guarantee future market performance. When using this indicator for trading, always combine it with other technical analysis tools, fundamental analysis, and personal trading experience for comprehensive decision-making.
• Market conditions are uncertain, and trend signals may result in false positives or lag. Traders should avoid over-reliance on indicator signals and implement stop-loss strategies and risk management techniques to reduce potential losses.
• Leverage trading carries high risks and may result in rapid capital loss. If using this indicator in leveraged markets (such as futures, forex, or cryptocurrency derivatives), exercise caution, manage risks properly, and set reasonable stop-loss/take-profit levels to protect funds.
• All trading decisions are the sole responsibility of the trader. The developer is not liable for any trading losses. This indicator is for technical analysis reference only and does not constitute investment advice.
• Before live trading, it is recommended to use a demo account for testing to fully understand how to use the indicator and apply proper risk management strategies.
CHANGELOG
v1.0: Initial release featuring integrated Price Action Index, Trend Strength Scoring, Wave Trend Oscillator, Gold Zone Compression Detection, and dual-type divergence recognition. Supports higher timeframe (HTF) synchronization, visual signal markers, and diversified parameter configurations.

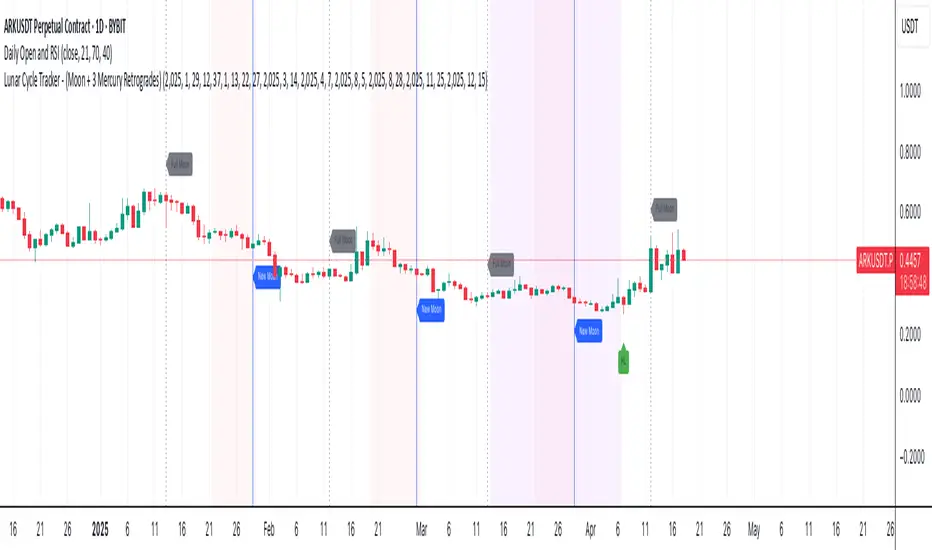
Lunar Cycle Tracker - (Moon + 3 Mercury Retrogrades)This script overlays the lunar and Mercury retrograde cycles directly onto your chart, helping traders visualize natural timing intervals that may influence market behavior.
Key Features:
🌑 New Moon & Full Moon Markers:
Vertical lines and labels indicate new and full moon events each month. You can fully customize their colors.
🌗 Last Quarter Moon Fill:
A soft pink background highlights the last quarter moon phase (from 7.4 days after the full moon to the next new moon).
🪐 Three Mercury Retrograde Zones:
Highlight up to three retrograde periods per year with customizable date inputs and background color. Great for spotting potential reversal or volatility windows.
Customization:
Moon event dates and colors
Manual input for Mercury retrograde periods (year, month, day)
Full compatibility with all timeframes (1H, 4H, daily, etc.)
Great for astro-cycle traders, Gann-based analysts, or anyone who respects time symmetry in the markets.
Fully customizable & works across all timeframes.
This tool was created by AngelArt as part of a larger astro-market model using lunar timing and planetary retrogrades for cycle-based market analysis.
Rolling Beta against SPY📈 Pine Script Showcase: Rolling Beta Against SPY
Understanding how your favorite stock or ETF moves in relation to a benchmark like the S&P 500 can offer powerful insights into risk and exposure. This script calculates and visualizes the rolling beta of any asset versus the SPY ETF (which tracks the S&P 500).
🧠 What Is Beta?
Beta measures the sensitivity of an asset's returns to movements in the broader market. A beta of:
- 1.0 means the asset moves in lockstep with SPY,
- >1.0 indicates higher volatility than the market,
- <1.0 implies lower volatility or possible defensive behavior,
- <0 suggests inverse correlation (e.g., hedging instruments).
🧮 How It Works
This script computes rolling beta over a user-defined window (default = 60 periods) using classic linear regression math:
- Calculates daily returns for both the asset and SPY.
- Computes covariance between the two return streams.
- Divides by the variance of SPY returns to get beta.
⚙️ Customization
You can adjust the window size to control the smoothing:
- Shorter windows capture recent volatility changes,
- Longer windows give more stable, long-term estimates.
📊 Visual Output
The script plots the beta series dynamically, allowing you to observe how your asset’s correlation to SPY evolves over time. This is especially useful in regime-change environments or during major macroeconomic shifts.
💡 Use Cases
- Portfolio construction: Understand how your assets co-move with the market.
- Risk management: Detect when beta spikes—potentially signaling higher market sensitivity.
- Market timing: Use beta shifts to infer changing investor sentiment or market structure.
📌 Pro Tip: Combine this rolling beta with volatility, Sharpe ratio, or correlation tracking for a more robust factor-based analysis.
Ready to add a layer of quantitative insight to your chart? Add the script to your watchlist and start analyzing your favorite tickers against SPY today!

TRAMA - Trend Regularity Adaptive Moving AverageThe TRAMA Line is an advanced, adaptive moving average that adjusts its speed based on market volatility. It’s designed to react quickly to price momentum shifts while filtering out noise — making it perfect for scalping, intraday, and swing trading.
What Makes It Special:
📊 Adaptive Sensitivity: Speeds up during high momentum, slows down during consolidation.
🎯 More responsive than traditional EMAs or SMAs, giving early signals without excessive false alarms.
🔄 Works great as a dynamic trend filter — price staying above = uptrend, below = downtrend.
🧠 Based on price movement regularity, which helps detect clean pullbacks and trend continuations.
In Your Indicator:
TRAMA acts as the main trend line to detect:
Trend direction
Pullbacks
Reversals
Combined with MACD, RSI, and ATR, it helps determine whether a move is likely to continue or reverse.

HMA Breakdown [NLR]Hull Moving Average (HMA) is a great trend-following tool — it's smooth, fast, and more responsive than traditional MAs like EMA or SMA. But the problem?
Sometimes it gives signals that look sharp but are misleading — especially in noisy markets or when the price is chopping around.
This script breaks down the inner mechanics of the HMA to give you more context:
Are the inputs to HMA actually diverging?
Is there momentum behind the move?
Is this trend about to reverse or just a pullback?
By plotting the components of HMA — and layering signal bands, color logic, and optional trend overlays — it gives you a visual breakdown of what's really going on under the hood.
What this indicator shows
HMA Trend (Main Line)
The Hull Moving Average (HMA) is plotted in bold, colored red or green based on internal conditions (not just price slope).
WMA Components (Fast & Slow)
Shows the two WMAs used inside the HMA calculation:
WMA Half (faster) — reacts quickly to price
WMA Full (slower) — smoother, less reactive
Their difference and crossover gives you clues on whether momentum is building or fading.
Signal & Band Structure
A calculated upper band and lower band are used to track when HMA is leading or lagging momentum.
When the HMA is below the band, trend may be weakening - this helps you filter false signals.
TMA Candle (Optional Visual)
A synthetic candle shows whether the smoothed average is rising or falling compared to a few candles back.
This is a simple visual cue to spot inflection points in the trend.
EMA Trend Overlay (Optional)
A pair of short-term EMAs built on a smoothed source helps you catch micro-trends or align your entries with the bigger trend.
Can act as an early heads-up or a trend confirmation layer.
What problem it solves
Noisy Signals: Helps filter out weak or fake trend signals often seen in HMA-only systems.
Visual Breakdown: Lets you see how each component of the HMA is behaving — so you’re not flying blind.
Momentum Confirmation: Adds layered confirmation using fast-vs-slow WMA cross, signal bands, and mini trend overlays.
Best Used For:
Trend-following traders who use HMA or WMA strategies
Filtering entries/exits in momentum-based systems
Visually confirming when a trend is real vs fake

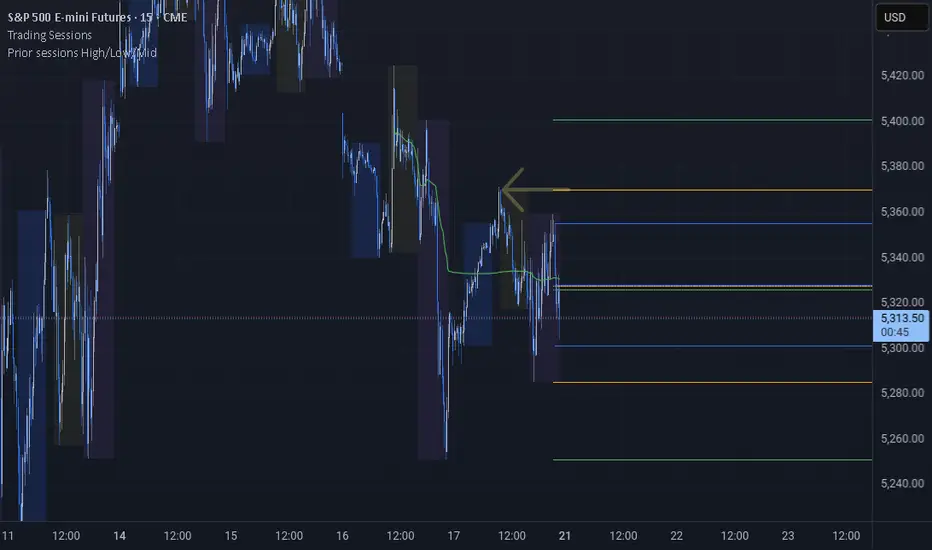
Prior sessions High/Low/MidThis indicator highlights the High, Low, and Midpoint of the most recently completed trading sessions. It helps traders visualize key price levels from the previous session that often act as support, resistance, or reaction zones.
It draws horizontal lines for the high and low of the last completed session, as well as the midpoint, which is calculated as the average of the high and low. These lines extend to the right side of the chart, remaining visible as reference levels throughout the day.
You can independently enable or disable the Tokyo, London, and New York sessions depending on your preferences. Each session has adjustable start and end times, as well as time zone settings, so you can align them accurately with your trading strategy.
This indicator is particularly useful for intraday and swing traders who use session-based levels to define market structure, bias, or areas of interest. Session highs and lows often align with institutional activity and can be key turning points in price action.
Please note that this script is designed to be used only on intraday timeframes such as 1-minute to 4-hour charts. It will not function on daily or higher timeframes.
PG Mean revision price to vwma and MAsHere's a concise breakdown for your users:
- Selection of Moving Average Type:- Choose VWMA, EMA, or SMA, along with the source (e.g., closing price) and length for the calculation.
- Price-MA Difference Calculation:- Calculates the difference between the closing price and the selected moving average.
- Additional Moving Averages:- Applies three customizable moving averages (MA1, MA2, MA3) to the price-MA difference.
- Dynamic Plotting:- Plots the price-MA difference in red, and overlays the moving averages (blue, orange, purple). MA1 can be dynamically colored red/green based on its trend.
- Zero Reference Line:- Includes a horizontal line at zero for easy visual reference.
This tool helps analyze price trends and deviations for better trading decisions!

Vietnamese Stocks: Multi-Ticker Fibonacci AlertThis Pine Script™ indicator is designed specifically for traders monitoring the Vietnamese stock market (HOSE, HNX). Its primary goal is to automate the tracking of Fibonacci retracement levels across a large list of stocks, alerting you when prices breach key support zones.
Core Functionality:
The script calculates Fibonacci retracement levels (23.6%, 38.2%, 50%, 61.8%, 78.6%) for up to 40 tickers simultaneously. The calculation is based on the highest high and lowest low identified since a user-defined Start Time. This allows you to anchor the Fibonacci analysis to a specific market event, trend start, or time period relevant to your strategy.
What it Does For You:
Automated Watchlist Scanning: Instead of drawing Fib levels on dozens of charts, select one of the two pre-configured watchlists (up to 40 symbols each, customizable in settings) populated with popular Vietnamese stocks.
Time-Based Fibonacci: Define a Start Time in the settings. The script uses this date to find the subsequent highest high and lowest low for each symbol in your chosen watchlist, forming the basis for the Fib calculation.
Intelligent Alerts: Get notified via TradingView's alerts when the candle closing price of any stock in your active watchlist falls below the critical 38.2%, 50%, 61.8%, or 78.6% levels relative to its own high/low range since the start time. Alerts are consolidated for efficiency.
Visual Aids:
- Plots the same time-based Fibonacci levels directly on your current chart symbol for quick reference.
- Includes an optional on-chart table showing which monitored stocks are currently below key Fib levels (enable "Show Debug Info").
- Features experimental background coloring to highlight potential bullish signals on the current chart.
Configuration:
Start Time: Crucial input – sets the anchor point for Fib calculations.
WatchList Selection: Choose between WatchList #1 (Bluechip/Midcap focus) or WatchList #2 (Defensive/Other focus) using the boolean toggles.
Symbol Customization: Easily replace the default symbols with your preferred Vietnamese stocks directly in the indicator settings.
Notification Prefix: Add custom text to the beginning of your alert messages.
Alert Setup: Remember to create an alert in TradingView, selecting this indicator and the alert() condition, usually with "Once Per Bar Close" frequency.
This tool is open-source under the MPL 2.0 license. Feel free to use, modify, and learn from it.

tafirstlibGeneral Purpose: Starts by stating it's a collection of utility functions for technical analysis.
Core Functionality Areas: Mentions key categories like:
Extrema detection (isMin, isMax, etc.)
Condition checking over time (isMachedInRange, isContinuous, etc.)
Rate of change analysis (isSlowDown)
Moving average calculation (getMA)
Advanced Features: Highlights the more complex functions:
Visualization helpers (getColorNew)
Moving Regression (mr) for smoothing/trend
Cycle analysis (bpDom)
Overall Goal: Concludes by stating the library's aim – simplifying development and enabling complex analysis.
Library "tafirstlib"
TODO: add library description here
isSlowDown(data)
isSlowDown
Parameters:
data (float) : array of numbers
Returns: boolean
isMin(data, maeLength)
isMin
Parameters:
data (float) : array of numbers
maeLength (int) : number
Returns: boolean
isMax(data, maeLength)
isMax
Parameters:
data (float) : array of numbers
maeLength (int) : number
Returns: boolean
isMinStopped(data, maeLength)
isMinStopped
Parameters:
data (float) : array of numbers
maeLength (int) : number
Returns: boolean
isMaxStopped(data, maeLength)
isMaxStopped
Parameters:
data (float) : array of numbers
maeLength (int) : number
Returns: boolean
isLongMinStopped(data, maeLength, distance)
isLongMinStopped
Parameters:
data (float) : array of numbers
maeLength (int) : number
distance (int) : number
Returns: boolean
isLongMaxStopped(data, maeLength, distance)
isLongMaxStopped
Parameters:
data (float) : array of numbers
maeLength (int) : number
distance (int) : number
Returns: boolean
isMachedInRangeSkipCurrent(data, findRange, findValue)
isMachedInRangeSkipCurrent
Parameters:
data (bool) : array of numbers
findRange (int) : number
findValue (bool) : number
Returns: boolean
isMachedInRange(data, findRange, findValue)
isMachedInRange
Parameters:
data (bool) : array of numbers
findRange (int) : number
findValue (bool) : number
Returns: boolean
isMachedColorInRange(data, findRange, findValue)
isMachedColorInRange isMachedColorInRange(series color data, int findRange, color findValue)
Parameters:
data (color) : series of color
findRange (int) : int
findValue (color) : color
Returns: boolean
countMachedInRange(data, findRange, findValue)
countMachedInRange
Parameters:
data (bool) : array of numbers
findRange (int) : number
findValue (bool) : number
Returns: number
getColor(data)
getColor
Parameters:
data (float) : array of numbers
Returns: color
getColorNew(data)
getColorNew
Parameters:
data (float) : array of numbers
Returns: color
isColorBetter(color_data)
isColorBetter
Parameters:
color_data (color) : array of colors
Returns: boolean
isColorWorst(color_data)
isColorWorst
Parameters:
color_data (color) : array of colors
Returns: boolean
isColorBetter2(color_data)
isColorBetter2
Parameters:
color_data (color) : array of colors
Returns: boolean
isColorWorst2(color_data)
isColorWorst2
Parameters:
color_data (color) : array of colors
Returns: boolean
isDecreased2Bar(data)
isDecreased2Bar
Parameters:
data (float) : array of numbers
Returns: boolean
isContinuousAdvance(targetSeries, range2Find, howManyException)
isContinuousAdvance
Parameters:
targetSeries (bool) : array of booleans
range2Find (int) : number
howManyException (int) : number
Returns: boolean
isContinuous(targetSeries, range2Find, truefalse)
isContinuous
Parameters:
targetSeries (bool) : array of booleans
range2Find (int) : number
truefalse (bool) : boolean
Returns: boolean
isContinuousNotNow(targetSeries, range2Find, truefalse)
isContinuousNotNow
Parameters:
targetSeries (bool) : array of booleans
range2Find (int) : number
truefalse (bool) : boolean
Returns: boolean
isContinuousTwoFactors(targetSeries, range2Find, truefalse)
isContinuousTwoFactors
Parameters:
targetSeries (bool) : array of booleans
range2Find (int) : number
truefalse (bool) : boolean
Returns: boolean
findEventInRange(startDataBarIndex, neededDataBarIndex, currentBarIndex)
findEventInRange
Parameters:
startDataBarIndex (int) : number
neededDataBarIndex (int) : number
currentBarIndex (int) : number
Returns: boolean
findMin(firstdata, secondata, thirddata, forthdata)
findMin
Parameters:
firstdata (float) : number
secondata (float) : number
thirddata (float) : number
forthdata (float) : number
Returns: number
findMax(firstdata, secondata, thirddata, forthdata)
findMax
Parameters:
firstdata (float) : number
secondata (float) : number
thirddata (float) : number
forthdata (float) : number
Returns: number
getMA(src, length, mav)
getMA
Parameters:
src (float) : number
length (simple int) : number
mav (string) : string
Returns: number
mr(mrb_src, mrb_window, mrb_degree)
Parameters:
mrb_src (float)
mrb_window (int)
mrb_degree (int)
bpDom(maeLength, bpw, mult)
Parameters:
maeLength (int)
bpw (float)
mult (float)

Ultimate Moving Average Crossover Indicator by SAMQUANT📈 Ultimate Moving Average Crossover Indicator | All-in-One MA Strategy
Unlock the power of multiple moving averages in one versatile indicator designed to give you clear, actionable signals in any market condition.
📌 Key Features:
- Supports **all major moving averages**:
- **SMA, EMA, WMA, HMA, RMA, DEMA, TEMA**, and more.
- Each MA is **fully customizable** with different lengths and types for ultimate flexibility.
- **Binary Long/Short signals** based on crossover logic—perfect for alerts, strategies, or discretionary trading.
- **Dynamic background coloring**:
- **Green** for bullish trends
- **Red** for bearish trends
Quickly gauge market direction at a glance.
---
🚀 Why Use This Indicator?
✅ Combines the strength of all major MA types
✅ Customizable to fit any trading style—scalping, swing, or trend following
✅ Built-in alerts ready for your next trade
✅ Visually intuitive with built-in signal clarity
✅ Excellent tool for **confluence-based** strategies
---
Great trades start with great tools. Clarity, precision, and flexibility—this indicator brings it all to your charts. Trade smarter, not harder.
---
> ⚠️ **Disclaimer:**
This script is intended for **educational and informational purposes only**. It does not constitute financial advice. Past performance is not indicative of future results. Always practice sound risk management and test strategies thoroughly before using real capital.
