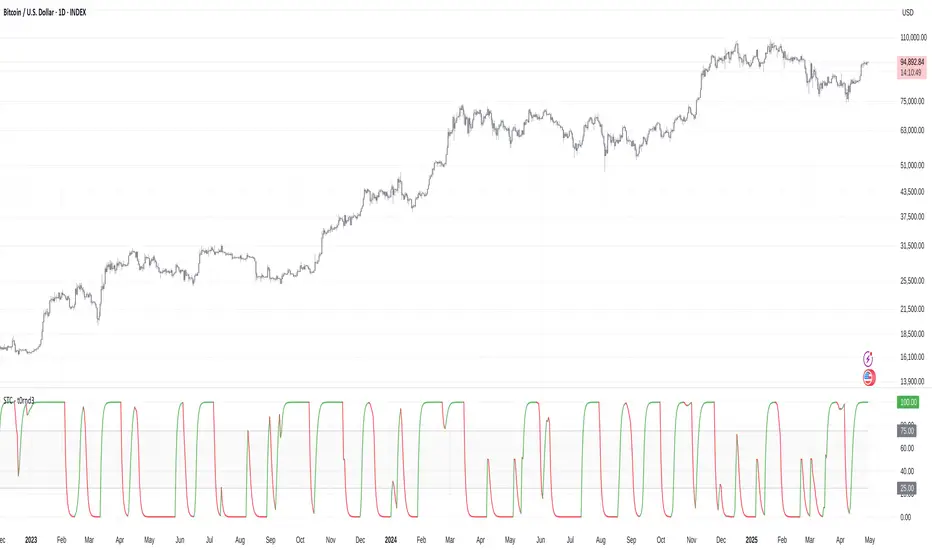
Schaff Trend Cycle (STC) - t0rdn3Schaff Trend Cycle (STC)
By t0rdn3 (original STC by , now with more descriptive naming)
Description
The Schaff Trend Cycle (STC) is a momentum-based oscillator that combines the speed of a fast EMA crossover with cyclical normalization. Developed by Doug Schaff, it identifies market turning points more responsively than MACD or RSI.
How It Works
1. EMA Difference : Calculates the difference between two EMAs of the source series (default: close).
2. Cycle Percentage : Normalizes that difference to a 0–100 range over the cycle period.
3. Smoothing : Applies exponential smoothing twice—first to the cycle percentage, then to its normalized cycles—to reduce noise.
4. Final STC Line : Produces a smoothed oscillator oscillating between 0 and 100.
Alerts
- "STC turned down above 75" : Fires once when STC makes a local peak above the upper threshold ( 75 ).
- "STC turned up below 25" : Fires once when STC makes a local trough below the lower threshold ( 25 ).
Inputs
Cycle Period : 12 — Lookback in bars for normalization
Fast EMA Length : 26 — Period of the fast EMA
Slow EMA Length : 50 — Period of the slow EMA
Smoothing Factor : 0.5 — Exponential smoothing coefficient (0–1)
Usage
Readings above 75 indicate an overbought cycle; readings below 25 indicate an oversold cycle. Crossings of the 50 midline can confirm trend direction:
- STC rising through 50 → bullish shift
- STC falling through 50 → bearish shift
Combine STC with price action or other trend filters to improve signal quality. You can adjust the cycle period and EMA lengths to match different timeframes or instruments.
Indicators and strategies
Tokyo Scalping Trend/Range + BB Squeeze [背景色保証版]
### **Indicator Title(タイトル)**
**Tokyo Scalping Trend/Range Detector + BB Squeeze**
---
### **Indicator Short Description
> A scalping tool optimized for the Tokyo session.
> Detects trend, range, and squeeze phases based on ADX, moving average slope, and Bollinger Band width.
> Suitable for 1m to 5m charts.
---
### **Full Explanation
---
## 📈 Overview
This indicator is specifically designed for scalping during the **Tokyo trading session (Japan Standard Time 9:00–15:00)**.
It automatically detects the market condition — **trend**, **range**, or **squeeze** — using a combination of:
- ADX (trend strength)
- Moving Average slope (price momentum)
- Bollinger Band width (volatility compression)
The background color of the chart will change accordingly to help traders quickly understand the current market environment without hesitation.
---
## 🧠 Logic
- **Trend (Green background)**
ADX is higher than the threshold and the moving average has a positive or negative slope.
➔ Indicates strong directional movement. Suitable for trend-following scalping.
- **Squeeze (Yellow background)**
Market is ranging, and Bollinger Band width is significantly narrower than usual.
➔ Indicates volatility contraction. A breakout is likely to occur soon.
- **Range (Blue background)**
Market is ranging with normal volatility (no squeeze detected).
➔ Low probability zone. Avoid aggressive trading or consider counter-trend strategies carefully.
- **Loading (Gray background)**
Data is not yet sufficient (early bars) or unstable.
➔ No trading recommended.
---
## 🕒 Tokyo Session Filtering
This indicator automatically filters the time zone:
It only activates between **9:00 AM and 3:00 PM Japan Standard Time (GMT+9)**.
You can adjust the time zone offset manually if your chart is set to UTC or other time zones.
---
## ⚙️ Adjustable Settings
- Moving Average period
- ADX period and threshold
- Bollinger Band period and multiplier
- Local timezone offset from UTC
---
## 🎯 Recommended Usage
- **Chart Timeframes**: 1-minute to 5-minute scalping charts
- **Main Focus**:
- Trade during green (trend) phases
- Watch carefully during yellow (squeeze) phases for breakouts
- Avoid random entries during blue (range) phases
- **Pro Tip**:
Enter on pullbacks during green zones, or breakout confirmation after yellow squeeze zones.
---
## 🚀 Future Upgrades (Optional)
This indicator is designed to be lightweight.
Future upgrades (not included yet) could add:
- Arrow markers on squeeze breakouts
- Sound alerts on trend start
- Volatility explosion warnings
---
# ✅ Notes
- Ensure your chart's timezone is correctly set if needed.
- Always combine technical indicators with price action confirmation for higher probability setups.
---
# 📚 Final Line
> **Simple visualizations. Precise Tokyo session scalping support.**

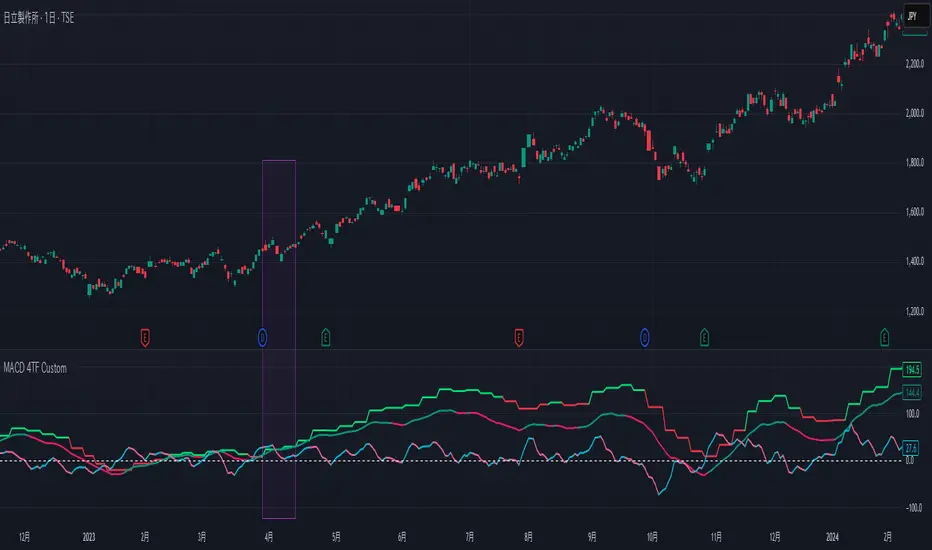
MACD Multi-Timeframe x4 (Custom Params)■About this indicator
・This indicator can display 4 MACD lines for different time frames. (Multi-time framework)
・The color of the MACD line changes when the MACD has a golden or dead cross.
All MACDs can be set individually for long time period, short time period, and signal smoothing.
All MACDs can show/hide MACD lines, signal lines, histograms, and select colors.
■Explanation of effective usage
By displaying MACDs in multiple time frames, you can time the push.
For example, let's say you have three MACDs: one weekly, one daily, and one hour.
With the weekly and daily MACDs continuing to golden cross, the timing for the hourly MACD to golden cross is considered a push opportunity.
An example chart is attached below for your reference.
The area circled vertically is a push-buying opportunity.
Yellow-green: Weekly Green: Daily Light blue: Hourly
-------------------------------------------------------------------------------------------------------------
■このインジケーターについて
・このインジケーターは別の時間軸の4本のMACDを表示させることが出来ます。(マルチタイムフレームワーク)
・MACDがゴールデンクロス・デッドクロスした場合にMACDラインの色が変化します。
・全てのMACDについて個別に長期の期間・短期の期間・シグナルの平滑化を設定できます。
・全てのMACDはMACDライン・シグナルライン・ヒストグラムの表示/非表示、色の選択ができます。
■有効な使い方の説明
マルチタイムフレームでMACDを表示することで、押し目のタイミングを計ることが出来ます。
例えば、3本のMACDを1週間・1日・1時間とします。
週足と日足のMACDがゴールデンクロスを継続した状態で、1時間足のMACDがゴールデンクロスしてくるタイミングは押し目買いのチャンスと考えられます。
以下に例題のチャートを付けますので、参考にしてください。
縦に囲った辺りが押し目買いのチャンスになります。
黄緑:週足 緑:日足 水色:1時間足
ZLEMA + Custom Momentum Cross v6.6 [CP Base]This script uses Zema for 9, 20, 50 which can be configured. Also, displays Zema of 15 min to show the 15min trend.
Also, uses Momentum code from ChartPrime.
When both momentum and zema alignment is there, we can trade.

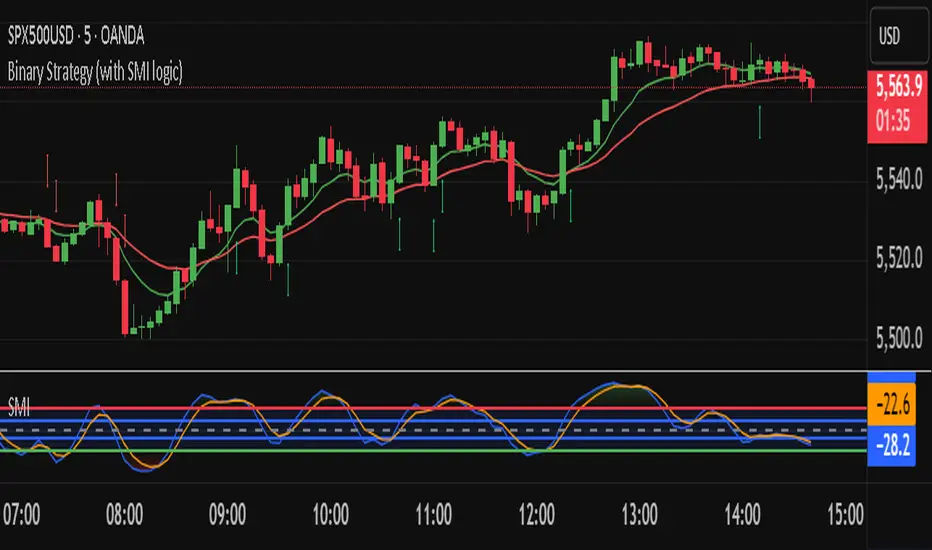
Binary Strategy (with SMI logic)🧠 How to Use:
Chart Timeframe: 5-minute
Setup: Wait for an arrow to appear
Green arrow = BUY a 20-min binary in uptrend with positive momentum
Red arrow = SELL a 20-min binary in downtrend with negative momentum
SMI Logic: Entry only when SMI crosses its signal line in the trend direction and above/below zero
Works for Nadex 20-Minute $&P 500 Binary
If long at 75 get out at 50, or if short at 25 get out at 50. This allow you to be trading at a 1:1 ratio. (Approx.)
🚀 BB+MACD Dip Screener @alptekinkekilli🌟 **What it does**
• Detects deep “dip-and-bounce” setups when price is trading below both the 50EMA and 200EMA
• Ensures the entire Bollinger Band sits beneath those EMAs for optimal risk/reward
• Fires only when price crosses up through the lower BB AND MACD line crosses above its signal line
🔍 **Why use it**
• Quickly scan hundreds of tickers for textbook dip-and-bounce entries
• Filter out noisy false signals by requiring multi-timeframe alignment (EMAs + BB + MACD)
• Perfect for trending markets where retracements offer low-risk entries
⚙️ **How to add the screener filter**
1. Copy & paste this script into Pine Editor → **Save & Add to Chart**
2. Publish as **Public** so it appears in Stock Screener → Technical
3. In **Stock Screener → Filters**, search for **BB+MACD Dip Screener** → select **BB_MACD_Dip > 0**
4. Voilà! You’ll see all symbols flashing “1” when a dip buy emerges.
🚨 **Bonus Alert**
Use the built-in `alertcondition(buyCond, "BB+MACD Dip Buy", "Dip buy confirmed!")` to fire real-time notifications to your phone or email.
Happy scanning & safe trading! 📈💰

Market Sessions Overlay (MSO®)Market Sessions Overlay (MSO®) is a clean, visual indicator that automatically highlights the three major trading sessions — Asia, London, and New York (U.S.A.) — directly on your chart.
For each daily session, MSO® dynamically draws:
- a high–low price range box
- a midline (average of session high and low)
- a label identifying the session
* Designed for precision:
The indicator is built using Dubai time (UTC+4) as a reference, but works with any timezone selected in TradingView, adjusting all sessions correctly. It auto-resets daily and adapts to Daylight Saving Time changes for London and New York.
* Works on all instruments — crypto, forex, stocks, indices — and is optimized for timeframes like 15m, 30m, 1H.
This overlay helps traders:
- understand volatility windows
- isolate session-based price structure
- spot overlaps and transitions with clarity

Simple EMA Cloud (20/50)Simple EMA Cloud 20/50.
The objective of this indicator is to give a directional bias.
You can change the EMA values and colors.
This works well by default on the 30-minute CME_MINI:ES1! and CME_MINI:NQ1! NQ.
Pro Tip:
Lower the EMA values if you're trading lower time frames.
If you see a move above or below the cloud in the opposite direction of the trend, and then the price immediately recovers and switches to the trending side of the cloud, this can be a nice entry.

Bollinger + EMA Strategy with Statssharpe_window = input.int(252, "Sharpe Lookback")sharpe_window = input.int(252, "Sharpe Lookback")sharpe_window = input.int(252, "Sharpe Lookback")sharpe_window = input.int(252, "Sharpe Lookback")sharpe_window = input.int(252, "Sharpe Lookback")sharpe_window = input.int(252, "Sharpe Lookback")sharpe_window = input.int(252, "Sharpe Lookback")sharpe_window = input.int(252, "Sharpe Lookback")sharpe_window = input.int(252, "Sharpe Lookback")sharpe_window = input.int(252, "Sharpe Lookback")sharpe_window = input.int(252, "Sharpe Lookback")sharpe_window = input.int(252, "Sharpe Lookback")sharpe_window = input.int(252, "Sharpe Lookback")

Small Cap Momentum Entry System✅ Features Included:
Momentum entry detection
Trailing stop overlay
Alert for entry and exit
Pre-market high line (optional display toggle)

15-Min Candlestick StrategyThis strategy combines the MACD (Moving Average Convergence Divergence) indicator with the 200 EMA (Exponential Moving Average) to identify trend-confirmed entry signals on the 15-minute timeframe.
📊 Logic:
The 200 EMA acts as a trend filter:
Only long trades are taken when price is above the EMA
Only short trades are taken when price is below the EMA
MACD crossovers provide the trade signals:
Bullish crossover (MACD crosses above Signal) = Long entry (if above 200 EMA)
Bearish crossover (MACD crosses below Signal) = Short entry (if below 200 EMA)
Trades are exited when the MACD crosses in the opposite direction or price closes on the wrong side of the 200 EMA.
✅ Features:
Simple trend-following logic with momentum confirmation
Works on any asset (Forex, Crypto, Stocks) and optimized for 15m charts
Backtestable and compatible with PineConnector for live algo trading
Ideal for traders seeking a clean and effective MACD-based strategy that avoids counter-trend setups.

Williams Vix Fix ShortsSo if you haven't already, add the normal "Williams Vixx Fixx" indicator to your chart twice,
Then open the settings on one of them and click the "highs not lows" option. and uncheck the "Highlight Bars For Simple Entry" option.
That will be the histogram for your shorts. The other Vixx Fixx indicator you added can be left as is.
Then add my indicator, either by just searching it in Tradigview or by using the pinescript above. This will act as your "white" candle for your short setups aligning with volitility and your histogram. So then you will have a black candle when the shorts Vixx Fixx triggers and a white while the long Vixx Fixx triggers.

Bot Institucional - EMAs + Volumen + SR InternoThis script is a technical trading tool that combines three main features:
EMA Cross Alerts
Uses two Exponential Moving Averages (EMAs): a short-term (default 9) and a long-term (default 21).
Generates alerts and labels when the fast EMA crosses above (bullish) or below (bearish) the slow EMA.
Institutional Volume Detection
Highlights bars where volume exceeds a user-defined multiple (default: 2×) of the 20-bar average volume.
These spikes are marked as potential signs of institutional activity.
Support/Resistance Level Detection (internal only)
Automatically identifies significant pivot highs/lows to estimate strong support/resistance zones.
These levels are tracked internally but not displayed on the chart to keep visuals clean.
The script provides clear visual labels and alert conditions, making it useful for momentum traders, scalpers, and volume-based strategies.

RSI EMA Candle Size Strategy//@version=5
strategy("RSI EMA Candle Size Strategy", overlay=true)
// Indikator teknikal
emaFast = ta.ema(close, 10)
emaSlow = ta.ema(close, 50)
rsiValue = ta.rsi(close, 14)
candleSize = math.abs(close - open)
// Kondisi Buy
buyCondition = rsiValue < 51 and emaFast < emaSlow and candleSize < 0.00025
if buyCondition
strategy.entry("BUY", strategy.long)
alert("BUY", alert.freq_once_per_bar_close)
// Kondisi Sell
sellCondition = rsiValue > 49 and emaFast > emaSlow and candleSize < 0.00025
if sellCondition
strategy.entry("SELL", strategy.short)
alert("SELL", alert.freq_once_per_bar_close)
// Plot
plot(emaFast, title="EMA 10", color=color.orange)
plot(emaSlow, title="EMA 50", color=color.blue)

Multi-Timeframe EMAs with Cross Alerts (Up & Down)📌 Indicator Name:
Multi-Timeframe EMAs with Cross Alerts (Up & Down)
🛠️ Core Features:
✅ 1. Multi-Timeframe EMA Display
The script calculates and displays 6 different Exponential Moving Averages (EMAs).
Each EMA has:
Custom length input (e.g., 9, 21, etc.).
Custom timeframe selection (e.g., 1H, 4H, 1D).
Custom color for easy identification on the chart.
✅ 2. EMA Visualization
Each of the six EMAs is plotted on the chart using the selected color and thickness.
They respond dynamically to different timeframes (current or higher/lower).
✅ 3. Cross Detection Logic
The script can detect crossover and crossunder between EMA pairs:
EMA 1 and EMA 2
EMA 3 and EMA 4
EMA 5 and EMA 6
(Optional: can be extended to other combinations.)
✅ 4. Alert Toggles
Users can enable or disable alerts for each pair independently:
Alert: EMA 1 crosses EMA 2
Alert: EMA 3 crosses EMA 4
Alert: EMA 5 crosses EMA 6
(You added an additional option for EMA 4 vs EMA 6 later.)
✅ 5. Visual Alert Markers
The script uses alert() function to send alert messages when:
An EMA crosses above another (crossover)
An EMA crosses below another (crossunder)
Alerts include clear icons like 🔼 and 🔽 in the messages.
🔔 Use Case Scenarios
Swing traders: Identify longer-term cross signals on higher timeframes.
Scalpers: Use lower-timeframe EMAs with fast alert reactions.
Multi-timeframe analysis: Spot alignment between trend-following EMAs across different periods.
✅ Bonus
Fully customizable — great for adapting to your own strategy, whether it's trend confirmation, re-entry signals, or early reversals
📌 اسم المؤشر:
المتوسطات المتحركة الأسية (EMA) متعددة الفريمات مع تنبيهات تقاطع صاعدة وهابطة
🛠️ الميزات الأساسية:
✅ 1. دعم متعدد للفريمات الزمنية
يقوم السكربت بحساب وعرض 6 متوسطات متحركة أسية (EMA) مختلفة.
يمكن تخصيص كل EMA من حيث:
الطول (مثل: 9، 21...).
الفريم الزمني (مثل: الساعة، الأربع ساعات، اليومي...).
اللون، لتسهيل التمييز بين الخطوط على الشارت.
✅ 2. عرض المتوسطات على الرسم البياني
يتم رسم كل من المتوسطات الستة باستخدام اللون والتنسيق الذي تختاره.
المتوسطات تتفاعل تلقائيًا مع التغييرات في الفريم الزمني.
✅ 3. كشف التقاطعات
يمكن للسكربت كشف تقاطعات (صعودًا أو هبوطًا) بين أزواج المتوسطات التالية:
EMA 1 و EMA 2
EMA 3 و EMA 4
EMA 5 و EMA 6
(ويمكنك إضافة المزيد مثل EMA 4 مع EMA 6 حسب الحاجة)
✅ 4. التحكم في التنبيهات
يمكن للمستخدم تفعيل أو تعطيل التنبيهات لكل زوج من المتوسطات على حدة:
تنبيه عند تقاطع EMA 1 و EMA 2
تنبيه عند تقاطع EMA 3 و EMA 4
تنبيه عند تقاطع EMA 5 و EMA 6
(وأي أزواج إضافية يتم إضافتها لاحقًا)
✅ 5. تنبيهات مرئية برسائل واضحة
السكربت يرسل تنبيهات عبر وظيفة alert() عند حدوث:
تقاطع صاعد (EMA يتقاطع من الأسفل إلى الأعلى).
تقاطع هابط (EMA يتقاطع من الأعلى إلى الأسفل).
التنبيه يحتوي على رموز توضيحية مثل 🔼 و 🔽 ليسهل قراءته.
🎯 مناسب لـ:
المتداولين المتأرجحين (Swing Traders): لاكتشاف تقاطعات على الفريمات الكبرى.
المضاربين (Scalpers): باستخدام EMA سريعة على فريمات صغيرة مع تنبيهات فورية.
محللي الفريمات المتعددة: لتأكيد الاتجاه أو الانعكاس بناءً على تقاطع متوسطات من فريمات مختلفة.
✅ مزايا إضافية:
قابل للتخصيص بشكل كامل حسب استراتيجيتك.
مناسب لعدة أساليب: تأكيد الترند، إعادة الدخول، أو إشارات الانعكاس المبكر.

3 Zero Lag + 3 Moving Averages + 3 RVWAPThe "3 Zero Lag + 3 Moving Averages + 3 RVWAP" (ZMR) indicator combines three groups of tools for technical analysis.
1. Three Customizable Moving Averages (MAs):
Configuration for Each MA:
Choice of 7 types (SMA, EMA, WMA, HMA, VWMA, LSMA, SMMA).
Independent periods and price sources for each line.
Visualization:
MA1 (Blue), MA2 (Red), MA3 (Green).
2. Three Zero Lag EMAs (ZLEMA) with Individual Settings:
Lag Reduction: Corrects traditional EMA lag using:
Adjusted Price = 2 * Current Price - Price .
Flexibility:
Unique lengths (20, 50, 70) and individual price sources for each ZLEMA (HLC3, HL2, Close, etc.).
Colors:
ZLEMA1 (Yellow), ZLEMA2 (Orange), ZLEMA3 (Purple).
3. Three Rolling VWAPs with Custom Parameters:
Volume-Weighted Average Price (VWAP):
Calculated for three periods (20, 50, 100) with dedicated price sources for each VWAP.
Colors:
VWAP1 (Pink), VWAP2 (Light Blue), VWAP3 (Neon Green).

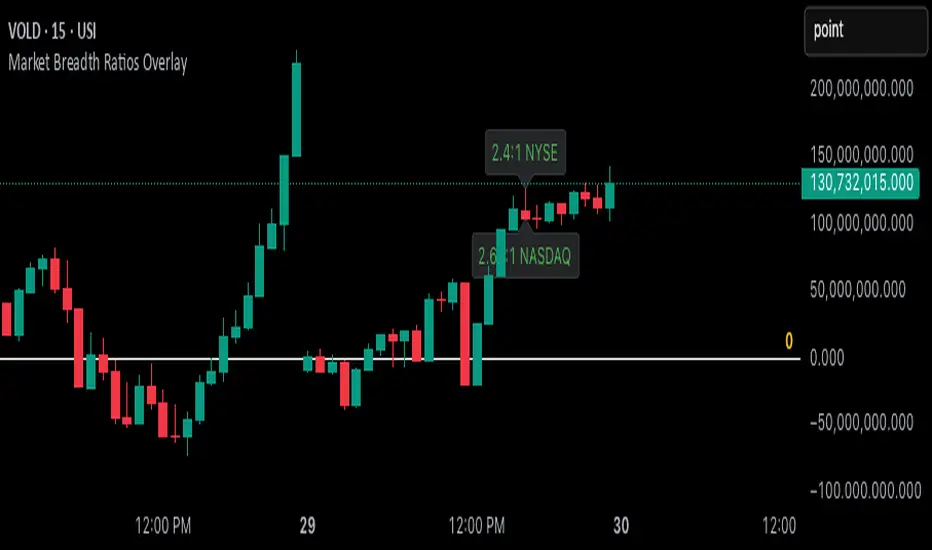
Market Breadth Ratios OverlayThis overlay indicator displays the up/down volume breadth ratio for both the NYSE and NASDAQ directly on your chart.
Ratios are calculated using volume data from:
USI:UVOL, USI:DVOL (NYSE)
USI:UVOLQ, USI:DVOLQ (NASDAQ)
A green label indicates more up volume than down volume (bullish breadth).
A red label indicates more down volume than up volume (bearish breadth).
Labels update every 10 bars and are anchored to the candle’s high (NYSE) and low (NASDAQ).
Negative ratios are inverted and displayed as -D:U to maintain a consistent “X:1” format.
Use this tool to assess whether institutional buying pressure is broad-based across exchanges — a valuable layer of confirmation for directional bias.
🚨 MA Cross Painter Combo + 73/100 Touch + Alerts Candles paint on specified moving average to help you mark off highs and lows and getting in at the right areas. Colors and Moving averages can be changed to preference color.

BELOTTO SCALPER Buy/Sell- A combination of volume + simple averages (fast and long) will determine the direction of the current trend and give buy and sell signals while in trend and/or when the trend changes.
- An optional filter using the convergence and divergence of moving averages can be activated to filter out "false" signals.
- The calculation does not request data of a resolution higher or lower than the resolution of the main chart symbol.
However, the filter function does request if another resolution is chosen for the filter.
- Persistent variables are used for bid and ask prices, allowing color coding of the signal.

sideways market for strangleThis Pine Script is designed to identify **sideways or range-bound markets**, which are often ideal conditions for trading **options strangle strategies**. Here's a breakdown of what the script does:
---
### 🛠 **Purpose:**
To **detect low-volatility, sideways market conditions** where price is not trending strongly in either direction — suitable for **neutral options strategies like short strangles**.
---
### 📌 **Key Components:**
#### 1. **Inputs:**
- `RSI Length`: Default 14 — used for calculating the Relative Strength Index (RSI).
- `ADX Length`: Default 14 — used for calculating the Average Directional Index (ADX), DI+ (positive directional movement), and DI- (negative directional movement).
#### 2. **RSI Calculation:**
- `rsiValue` is calculated using the built-in `ta.rsi(close, rsiLength)`.
- A **sideways market** is expected when RSI is in the **40–60 range**, indicating lack of strong momentum.
#### 3. **ADX and Directional Indicators (DI+ and DI-):**
- `diPlus` and `diMinus` are calculated based on recent price movements and the True Range.
- `dx` (Directional Index) measures the strength of trend direction using the difference between DI+ and DI-.
- `adx` is a smoothed version of `dx` and represents **overall trend strength**.
#### 4. **Sideways Market Conditions:**
- **RSI Condition**: RSI is between 40 and 60.
- **ADX Condition**:
- `adx <= 25` → Weak or no trend.
- `adx < diPlus` and `adx < diMinus` → Confirms ADX is lower than directional components, reducing likelihood of a trending market.
#### 5. **Signal Plot:**
- A **green label below the bar** (`shape.labelup`) is plotted when both conditions are met.
- Indicates potential sideways market conditions.
---
### ✅ **Use Case:**
- This signal can help identify **low-volatility zones** suitable for **short strangles** or **iron condors**, where you profit from time decay while expecting the price to stay within a range.

Lot Size (USD)Calculate lot size and stop loss from the actual price to the stop loss that you enter manually. Only for Forex pairs with USD

KDJ IndicatorThe KDJ indicator is a technical analysis tool used to identify overbought and oversold conditions in the market, as well as potential trend reversals. It consists of three lines: the K line, D line, and J line. The K line is derived from the Exponential Moving Average (EMA) of the Relative Strength Value (RSV), which measures the closing price relative to the high and low over a user-defined period. The D line is the EMA of the K line, smoothing its movements. The J line, calculated as K + (K - D) × 2, amplifies the difference between K and D, making it more sensitive to price changes. Traders often use the KDJ indicator to spot divergences, crossovers, and extreme values (e.g., above 80 for overbought, below 20 for oversold) to make informed trading decisions. All parameters, including the RSV, K, and D periods, are customizable to suit different trading strategies.


SK System Buy/Sell Signals with TargetsCreated by Gamal Asela
will help you to find the buy and sell signals with targets .
Sk system have two alerts for buy and sell notifications
