Indicators and strategies

MFI EMA3 x VWMA21 + Sweep Buy/Sell SignalGo to the buying order when EMA 3 cut to VWMA 21 and then have a bottom scan that EMA 3 is still on VWMA 21

Retail SMFI _ StrategicVault-999Alright, real talk: this is my Retail SMFI — a mashup of volume and price action designed to sniff out when retail traders might be crowding in or out (overbought or oversold zones).
Just kidding… or am I? 😉
What’s going on here?
I took a simple idea: if price and volume move together, the trend might be strong; if they’re out of sync, maybe a reversal’s brewing.
So, I smoothed the price and volume with a 21-period EMA each, then checked how closely they correlate over the last 14 bars. Multiply that by 100 and boom — you get SMFI, a handy signal telling you when the crowd might be pushing too far.
What to expect on your chart:
SMFI line in green when price and volume agree (bullish vibes)
SMFI line in red when they disagree (watch out!)
Clear overbought (default 50) and oversold (-50) lines, so you know when things are getting spicy.
Background flashes red or green in those extreme zones — can’t miss ‘em!
Alerts ready to ping you when SMFI hits those levels. Perfect if you don’t want to stare at the screen all day.
Should you trust it?
Well… it’s a simple but solid tool to catch when retail crowd behavior might be peaking or bottoming out. Not magic, but it’s got your back when combined with other indicators or your own smarts.
If you like this kind of no-nonsense volume+price combo, you’re gonna love it. If not, hey, blame me — but maybe give it a try first? 😄
In short:
I made this for fun — but it’s surprisingly useful.
Use it wisely, don’t blindly follow it, and maybe you’ll catch some juicy reversals.
Need it tweaked? Hit me up!
And hey, if you find a bug, that’s on me too. Just kidding, mostly. 😅

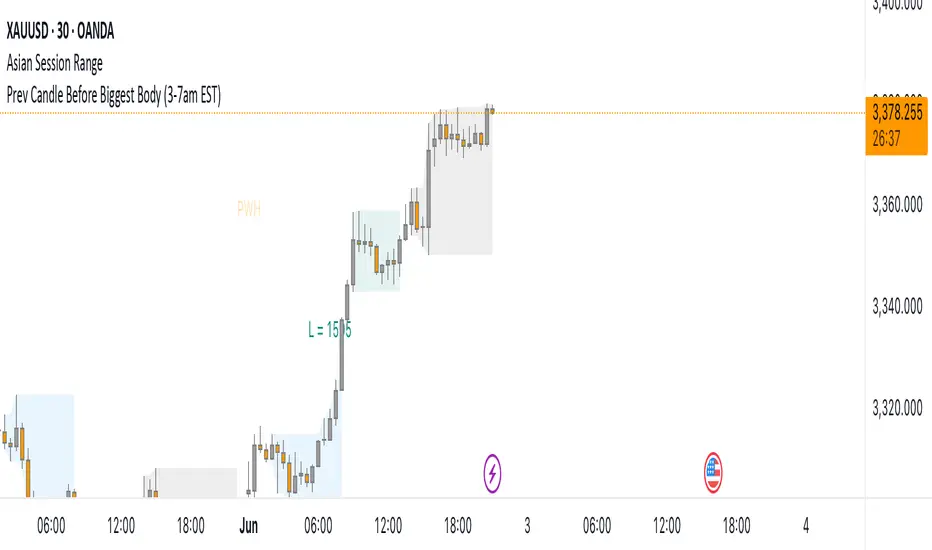
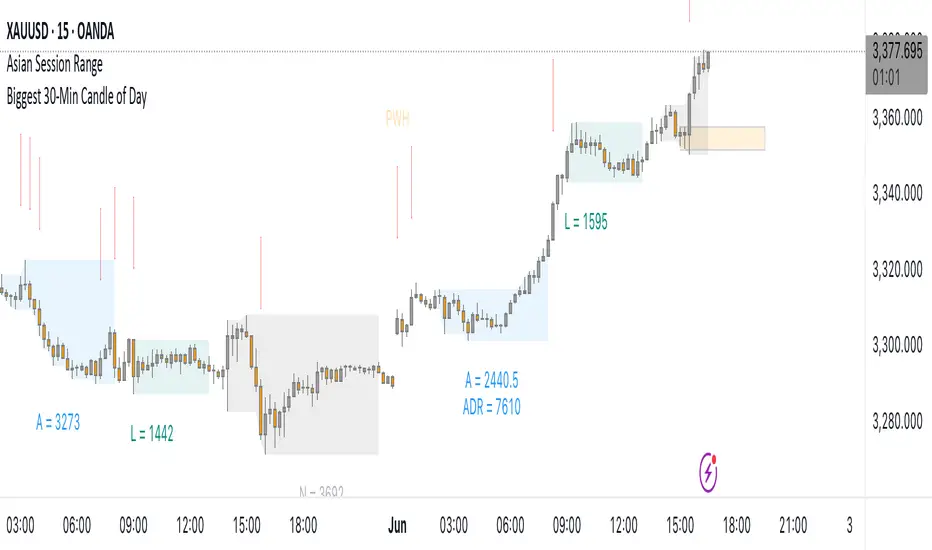
Prev Candle Before Biggest Body (3-7am EST)This indicator automatically identifies and marks, for each trading day, the candle immediately preceding the largest open-to-close movement (in pips) during the key London session window from 3:00am to 7:00am EST (New York time). The largest candle is determined by the absolute difference between its open and close prices, measured in pips. The candle just before this “biggest” move is highlighted with a distinctive pink flag above the bar. This tool is especially useful for traders seeking to analyze pre-breakout price action or to identify key levels and setups that occur right before significant volatility during the early London session.
VIDYA (Chande)This script brings you VIDYA – the Variable Index Dynamic Average, developed by Tushar Chande. It’s not your typical moving average. Unlike the standard SMA or EMA, VIDYA adapts its speed and smoothness based on real-time market momentum using the Chande Momentum Oscillator (CMO).
Think of it like a moving average that gets faster during strong trends and slows down during sideways or choppy markets — just like how a smart trader would!
🧠 What Makes VIDYA Different?
Traditional moving averages use fixed smoothing, so they lag more during big moves or chop during weak trends.
VIDYA fixes that by adapting its behavior dynamically:
When momentum is strong → VIDYA reacts faster 🚀
When momentum is weak → VIDYA smooths out the noise 🧘
⚙️ How It Works (Explained Simply):
1️⃣ CMO Calculation (Chande Momentum Oscillator):
We look at the past cmoLength candles (default 9) and:
i) Add up all the positive price changes (gains)
ii) Add up all the negative price changes (losses)
iii) Use those to compute a normalized momentum score between -100 and +100
📌 CMO = (Gains - Losses) / (Gains + Losses)
• This gives us a momentum reading that powers the next step.
2️⃣ Dynamic Alpha Smoothing:
• We convert the absolute value of the CMO into an alpha — this is the "speed" of the VIDYA.
📌 Higher momentum = higher alpha → faster response
📌 Lower momentum = lower alpha → smoother behavior
3️⃣ VIDYA Formula:
• Finally, we apply the smoothing:
📌 VIDYA = α × Price + (1 - α) × Previous VIDYA
• This equation continuously adapts to market behavior — trending or ranging.
📊 What’s Plotted?
🟠 The VIDYA Line:
A smooth, responsive line plotted on your price chart that adjusts in real-time with price momentum.
🔎 How to Use It:
✅ Use it like a moving average, but smarter:
• Price > VIDYA and rising → Trend is likely up
• Price < VIDYA and falling → Trend is likely down
• Flat VIDYA = Possible consolidation or sideways market
✅ Combine with:
• Breakout strategies (VIDYA confirms momentum)
• Reversal entries (look for price crossing VIDYA)
• Volatility filters (ignore signals when VIDYA flattens)
🧪 Bonus Tip:
Pair this with a volume indicator (like my Volume Confirmation Bars or Volume Strength Highlight) to confirm whether momentum is backed by real participation or just a fakeout.
📩 Want alerts, dual-timeframe overlays, or VIDYA with other base inputs (like typical price or HLC3)? Let me know — happy to expand this for your setup!
Stay adaptive, not reactive — trade smarter with VIDYA! 🧠📉📈

Volume Strength HighlightThis simple script helps you quickly see when volume is strong or weak on the chart — it highlights the candles based on how the current volume compares to the recent average 📊
🔍 Here's what it does:
Calculates a 20-bar average volume
Marks candles green or red if volume is much higher than average (more than 1.5x)
Marks candles gray if volume is very low (less than 0.5x the average)
Normal candles stay unchanged
You can also turn on a basic volume plot in a separate panel if you want to compare visually (just toggle it in settings).
⚠️ It’s not a buy/sell signal — just a helper to see when the market is waking up or going quiet.
Not perfect but works well with other indicators! Let me know if you like it or have ideas to add more 💡

Green Trend and Adjustable Chop Zone Highlightallows for indication of when the indicator is green. Green means out of the chop and trending. Red means choppy and no trend.


atr stop loss for double SMA v6Strategy Name
atr stop loss for double SMA v6
Credit: This v6 update is based on Daveatt’s “BEST ATR Stop Multiple Strategy.”
Core Logic
Entry: Go long when the 15-period SMA crosses above the 45-period SMA; go short on the inverse cross.
Stop-Loss: On entry, compute ATR(14)×2.0 and set a fixed stop at entry ± that amount. Stop remains static until hit.
Trend Tracking: Uses barssince() to ensure only one active long or short position; stop is only active while that trend persists.
Visualization
Plots fast/slow SMA lines in teal/orange.
On each entry bar, displays a label showing “ATR value” and “ATR×multiple” positioned at the 30-bar low (long) or high (short).
Draws an “×” at the stop-price level in green (long) or red (short) while the position is open.
Execution Settings
Initial Capital: $100 000, Size = 100 shares per trade.
Commission: 0.075% per trade.
Pyramiding: 1.
Calculations: Only on bar close (no intra-bar ticks).
Usage Notes
Static ATR stop adapts to volatility but does not trail.
Ideal for trending, liquid markets (stocks, futures, FX).
Adjust SMA lengths or ATR multiple for faster/slower signals.

Pi Cycle IndicatorThe Pi Cycle Top is a timing tool used to spot Bitcoin cycle peaks. It tracks the 111-day Simple Moving Average (SMA) and twice the 350-day SMA. When the faster 111-day SMA crosses above 2× the 350-day SMA, it has historically signaled major Bitcoin tops — often within days.
Core Idea: Measures market euphoria and overheated conditions by blending price and time dynamics. Designed to catch tops when momentum peaks.
Important: High historical accuracy, but not bulletproof. Works best as a macro cycle indicator — not for precise exits.

Low Volatility Breakout Detector)This indicator is designed to visually identify potential breakouts from consolidation during periods of low volatility. It is based on classic Bollinger Bands and relative volume. Its primary purpose is not to generate buy or sell signals but to assist in spotting moments when the market exits a stagnation phase.
Arrows appear only when the price breaks above the upper or below the lower Bollinger Band, the band width is below a specified threshold (expressed in percentage), and volume is above its moving average multiplied by a chosen multiplier (default is 1). This combination may indicate the start of a new impulse following a period of low activity.
The chart background during low volatility is colored based on volume strength—the lower the volume during stagnation, the less transparent the background. This helps quickly spot unusual market behavior under seemingly calm conditions. The background opacity is dynamically scaled relative to the range of volumes over a selected period, which can be set manually (default is 50 bars).
The indicator works best in classic horizontal consolidations, where price moves within a narrow range and volatility and volume clearly decline. It is not intended to detect breakouts from formations such as triangles or wedges, which may not always exhibit low volatility relative to Bollinger Bands.
Settings allow you to adjust:
Bollinger Band length and multiplier,
Volatility threshold (in %),
Background and arrow colors,
Volume moving average length and multiplier,
Bar range used for background opacity scaling.
Note: For reliable results, it’s advisable to tailor the volatility threshold and volume/background ranges to the specific market and timeframe, as different instruments have distinct dynamics. If you want the background color to closely match the color of breakout arrows, you should set the same volume analysis period as the volume moving average length.
Additional note: To achieve a cleaner chart and focus solely on breakout signals, you can disable the background and Bollinger Bands display in the settings. This will leave only the breakout arrows visible on the chart, providing a clearer and more readable market picture.

MFI + EMA3/VWMA21 + Sweep Buy/SellIn the buying order when EMA 3 cut to VWMA 21 and then there is a bottom scan that EMA 3 is still on VWMA 21, selling is the opposite

Steph's Shadow Supplyindicator for steph's strategy "shadow supply"
decluttered by using AI
inspo from @louisq69

SPX to ES/MES**SPX to ES/MES Level Converter**
This indicator is designed for traders who work with SPX price levels but execute trades on ES or MES futures. It allows you to input SPX-based key levels—such as call walls, put walls, vanna/charm zones, volatility triggers, and profit targets—and automatically converts them into their real-time ES/MES equivalents.
### 📌 Features:
- Manual input of SPX levels (e.g. 5900, 5850, etc.)
- Live conversion to ES or MES levels using a dynamic spot ratio
- Plots include:
- 🟢 Call Wall
- 🔴 Put Wall
- 🟠 Vanna
- 🟣 Charm
- 🟡 Volatility Trigger
- ✅ Long Profit Targets
- ❌ Short Profit Targets
- Smoothing parameter to stabilize visual line display
### 🧠 How it Works:
- The indicator calculates a dynamic ratio between the ES/MES price and your manually input SPX spot.
- This ratio is applied to each SPX level to determine its corresponding ES/MES equivalent.
- It plots each line at its translated futures level so your chart reflects accurate futures-aligned decision points.
> Tip: Adjust the `Current SPX Spot` input daily to match live spot values for maximum precision.
This version does not include text labels on the chart. For a labeled version, check out the updated release with `label.new()` annotations for each level.
**Use case:** Great for traders who generate levels off SPX options flow, but execute on ES/MES contracts intraday.
Created by pogchamp99 | Inspired by SPY → ES conversion by ItsAnders81

PER Bands (Auto EPS)PER Bands Indicator - Technical Specification
Function
This PineScript v6 overlay indicator displays horizontal price bands based on Price-to-Earnings Ratio multiples. The indicator calculates price levels by multiplying earnings per share values by user-defined PER multiples, then plots these levels as horizontal lines on the chart.
Data Sources
The script attempts to automatically retrieve earnings per share data using TradingView's `request.financial()` function. The system first queries trailing twelve months EPS data, then annual EPS data if TTM is unavailable. When automatic retrieval fails or returns zero values, the indicator uses manually entered EPS values as a fallback.
Configuration Options
Users can configure five separate PER multiples (default values: 10x, 15x, 20x, 25x, 30x). Each band supports individual color customization and adjustable line width settings from 1 to 5 pixels. The indicator includes toggles for band visibility and optional fill areas between adjacent bands with 95% transparency.
Visual Components
The indicator plots five horizontal lines representing different PER valuation levels. Optional fill areas create colored zones between consecutive bands. A data table in the top-right corner displays current EPS source, EPS value, current PER ratio, and calculated price levels for each configured multiple.
Calculation Method
The indicator performs the following calculations:
- Band Price = Current EPS × PER Multiple
- Current PER = Current Price ÷ Current EPS
These calculations update on each bar close using the most recent available EPS data.
Alert System
The script includes alert conditions for price crossovers above the lowest PER band and crossunders below the highest PER band. Additional alert conditions can be configured for any band level through the alert creation interface.
Debug Features
Debug mode displays character markers on the chart indicating when TTM or annual EPS data is available. This feature helps users verify which data source the indicator is using for calculations.
Data Requirements
The indicator requires positive, non-zero EPS values to function correctly. Stocks with negative earnings or zero EPS will display "N/A" for current PER calculations, though bands will still plot using the manual EPS input value.
Exchange Compatibility
Automatic EPS data availability varies by exchange. United States equity markets typically provide comprehensive fundamental data coverage. International markets may have limited automatic data availability, requiring manual EPS input for accurate calculations.
Technical Limitations
The indicator cannot fetch real-time EPS updates and relies on TradingView's fundamental data refresh schedule. Historical EPS changes are not reflected in past band positions, as the indicator uses current EPS values for all historical calculations.
Display Settings
The information table shows EPS source type (TTM Auto, Annual Auto, Manual, or Manual Fallback), allowing users to verify data accuracy. The table refreshes only on the last bar to optimize performance and reduce computational overhead.
Code Structure
Built using PineScript v6 syntax with proper scope management for plot and fill functions. The script uses global scope for all plot declarations and conditional logic within plot parameters to handle visibility settings.
Version Requirements
This indicator requires TradingView Pine Script version 6 or later due to the use of `request.financial()` functions and updated syntax requirements for plot titles and fill operations.

ChoCH Down/Up + Entry (Guido, matt v2.0)Choch Entry indicator Guido,Matt v2.0
This indicator has a goal to use within a LTF(lower time frame) as a buy or sell signal after a CHOCH

Candle/RSI BUY SELLWhy Use Candlesticks?
They help traders visualize price action
Used in technical analysis and price pattern recognition (e.g., Doji, Engulfing, Hammer)
Assist in determining entry and exit points
Why Traders Use RSI:
To identify potential reversal zones
To confirm trend strength
To detect divergences between price and momentum
Why Combine Candlestick Patterns with RSI?
Using Candlestick patterns together with the Relative Strength Index (RSI) enhances trading decisions by combining price action and momentum analysis.
Conclusion:
Combining RSI with Candlestick patterns allows traders to:
Confirm potential reversals
Filter false signals
Improve entry and exit timing
Make more confident and accurate decisions
How It Works:
RSI Calculation
Custom RSI is calculated manually using Wilder's smoothing technique.
MA or BB Option
User can select whether to apply a smoothing MA or Bollinger Bands to RSI (useful for visual enhancements or custom strategies).
Buy/Sell Logic
check for:
Buy when the current candle is bullish (open <= close) and the previous candle was bearish (open >= close ), AND RSI is ≥ 50.
Sell when current candle is bearish and previous was bullish, AND RSI is ≤ 50.
Plot Buy/Sell Labels
Final Verdict
code is:
Valid (no syntax errors)
Useful (combines candlestick confirmation + RSI strength)
Extendable (can add divergence, alerts, etc.)
This Timeframe 5 min : XAU

ATR Display ShorcutATR Value Display - On-Chart Volatility Monitor
Clean ATR display directly on your price chart - no extra panels needed!
This indicator displays the current Average True Range (ATR) value as a clean table overlay on your price chart, eliminating the need for a separate indicator panel below your main chart.
✨ Key Features:
On-chart display: ATR value shown directly on price chart
Customizable positioning: Choose from 4 corner positions
Clean design: Minimal, non-intrusive table format
Real-time updates: Always shows the latest ATR value
Adjustable period: Default 14-period, fully customizable
🎯 Perfect For:
Position sizing calculations
Stop-loss placement (1x, 1.5x, 2x ATR)
Volatility assessment at a glance
Clean chart setups without extra panels
Quick reference during live trading
📊 How to Use:
Add to chart
Select your preferred table position
Adjust ATR period if needed (default: 14)
The current ATR value displays automatically
💡 Pro Tip:
Use this ATR value to:
Set stop-losses at 1.5x or 2x ATR distance
Determine position size based on account risk
Compare current volatility to historical levels
Clean charts, clear data, better trading decisions.
Compatible with all timeframes and instruments. Pine Script v6.
Feel free to adjust this description to match your style or add any specific features you want to highlight!

ROE % Quarterly By COLDMONEYReturn on Equity % By ColdMoney
this indicator use for check % Equity of stock

Michael's EMA - Original with 200 EMA Filter
This indicator plots a 12-period EMA and a 21-period EMA on the chart, coloring them green when the short EMA is above the long EMA (uptrend) and red when below (downtrend). A signal is generated whenever the 12 EMA crosses the 21 EMA (either upward or downward), indicating a potential trend change. The signal is displayed as a yellow vertical line with a "CROSS" label above the candle. A 200-period EMA is plotted for reference but does not affect the signal. A single "Crossing" alert condition is provided to notify when the 12 EMA crosses the 21 EMA.

Trend Regime with MA & Volatility✅ Trend signal combining: Price (MA), Momentum (RSI), Volatility (ATR)
✅ Bullish = Green background
✅ Neutral = Yellow background
✅ Bearish = Red background
✅ Fast/Slow MA + ATR plots
✅ Entry signal arrows


EMA flow trend buy AnhDuong🎯 1. Indicator Purpose
This indicator combines:
BUY/SELL signals based on crossovers between EMA and LWMA (with some noise filtering).
A multi-timeframe dashboard (M1 → H4) showing trend direction using EMA34 and EMA89.
📈 2. Crossover Signal Logic
BUY signal occurs when:
text
Sao chép
Chỉnh sửa
EMA89 < EMA34 (Bullish crossover)
LWMA45 > EMA34 (Price is rising above the fast EMA)
LWMA45 < EMA89 (Price hasn't broken the long EMA yet)
➡️ Meaning: A bullish move is forming (early stage) → potential entry point.
SELL signal occurs when:
text
Sao chép
Chỉnh sửa
EMA89 > EMA34 (Bearish crossover)
LWMA45 < EMA34 (Price is below the fast EMA)
LWMA45 > EMA89 (Price hasn't broken the long EMA downward)
➡️ Meaning: A bearish move is forming → possible short setup.
📊 3. Multi-Timeframe Dashboard
This dashboard shows trend direction using EMA34 vs EMA89:
UP: EMA34 > EMA89 → uptrend
DOWN: EMA34 < EMA89 → downtrend
Example:
makefile
Sao chép
Chỉnh sửa
DASHBOARD (EMA34/89)
M1: DOWN
M5: DOWN
M15: UP
H1: UP
H4: UP
🟢 Recommended strategy:
BUY when most timeframes show UP
SELL when most timeframes show DOWN
Avoid trades if the trend is mixed (e.g., M1 says UP but H1 says DOWN)
📌 4. Suggested Strategy
For Scalping (e.g., on M5):
Ensure that H1 and H4 are aligned with your direction.
Wait for a BUY/SELL signal on M5.
Check the Dashboard to confirm higher-timeframe trend agreement.
⚠️ 5. Important Notes
Don’t rely solely on BUY/SELL signals — always confirm with the Dashboard.
Consider adding RSI, Bollinger Bands, or SMC levels to improve filtering.
Avoid trading during choppy or sideways conditions — frequent EMA crossovers = many false signals.
