Search in scripts for "Futures"

Futures Risk CalculatorFutures Risk Calculator Script - Description
The Futures Risk Calculator (FRC) is a comprehensive tool designed to help traders effectively manage risk when trading futures contracts. This script allows users to calculate risk/reward ratios directly on the chart by specifying their entry price and stop loss. It's an ideal tool for futures traders who want to quantify their potential losses and gains with precision, based on their trading account size and the number of contracts they trade.
What the Script Does:
1. Risk and Reward Calculation:
The script calculates your total risk in dollars and as a percentage of your account size based on the entry and stop-loss prices you input.
It also calculates two key levels where potential reward (Take Profit 1 and Take Profit 2) can be expected, helping you assess the reward-to-risk ratio for any trade.
2. Customizable Settings:
You can specify the size of your trading account (available $ for Futures trading) and the number of futures contracts you're trading. This allows for tailored risk management that reflects your exact trading conditions.
3. Live Chart Integration:
You add the script to your chart after opening a futures chart in TradingView. Simply click on the chart to set your Entry Price and Stop Loss. The script will instantly calculate and display the risk and reward levels based on the points you set.
Adjusting the entry and stop-loss points later is just as easy: drag and drop the levels directly on the chart, and the risk and reward calculations update automatically.
4. Futures Contract Support:
The script is pre-configured with a list of popular futures symbols (like ES, NQ, CL, GC, and more). If your preferred futures contract isn’t in the list, you can easily add it by modifying the script.
The script uses each symbol’s point value to ensure precise risk calculations, providing you with an accurate dollar risk and potential reward based on the specific contract you're trading.
How to Use the Script:
1. Apply the Script to a Futures Chart:
Open a futures contract chart in TradingView.
Add the Futures Risk Calculator (FRC) script as an indicator.
2. Set Entry and Stop Loss:
Upon applying the script, it will prompt you to select your entry price by clicking the chart where you plan to enter the market.
Next, click on the chart to set your stop-loss level.
The script will then calculate your total risk in dollars and as a percentage of your account size.
3. View Risk, Reward, and (Take Profit):
You can immediately see visual lines representing your entry, stop loss, and the calculated reward-to-risk ratio levels (Take Profit 1 and Take Profit 2).
If you want to adjust the entry or stop loss after plotting them, simply move the points on
the chart, and the script will recalculate everything for you.
4. Configure Account and Contracts:
In the script settings, you can enter your account size and adjust the number of contracts you are trading. These inputs allow the script to calculate risk in monetary terms and as a percentage, making it easier to manage your risk effectively.
5. Understand the Information in the Table:
Once you apply the script, a table will appear in the top-right corner of your chart, providing you with key information about your futures contract and the trade setup. Here's what each field represents:
Account Size: Displays your total account value, which you can set in the script's settings.
Future: Shows the selected futures symbol, along with key details such as its tick size and point value. This gives you a clear understanding of how much one point or tick is worth in dollar terms.
Entry Price: The exact price at which you plan to enter the trade, displayed in green.
Stop Loss Price: The price level where you plan to exit the trade if the market moves against you, shown in red.
Contracts: The number of futures contracts you are trading, which you can adjust in the settings.
Risk: Highlighted in orange, this field shows your total risk in dollars, as well as the percentage risk based on your account size. This is a crucial value to help you stay within your risk tolerance and manage your trades effectively.

Futures Settlement [NeoButane]Traders use settlement prices as both support/resistance and as a target for price to trend towards. The intention of this script is to provide possible entry and exit levels for swing and scalp trades by drawing horizontal lines of true settlement prices provided by TradingView.
The settlement price, which is calculated daily, is used to determine the profit/loss of a trader's futures position. Prior to the daily close, price settlement of futures contracts is performed by taking the average of its traded price during a specified period of time.
Usage
The settlement prices, shown as horizontal lines, serve as support or resistance for entry or exit. There are hundreds of ways to combine this with favorite indicators, or it can be used as levels for pure price action traders.
See how settlement price levels can be used in confluence with oscillators.
Configuration
Toggles to show each settlement. Reprint shows prior weeks or months after they've ended. Back-adjusted futures, which affect expired futures price history on continuous futures charts, should only be enabled on non-standard charts to match the user's chart settings.
What this script does
This script plots the daily, weekly, and monthly settlements for futures, including an average for the two most recent weekly or monthly settlements. The weekly settlement uses the last day of the week's daily settlement and the monthly settlement uses the last day of the month's daily settlement. For symbols that do not have settlement prices, which will be almost if not all symbols that are not futures, the settlement price instead becomes price at the last second before the daily/weekly/monthly close. In those cases, this script becomes a tool for automatically plotting daily/weekly/monthly closes.
See below for two different bitcoin charts. The chart on top is a non-futures chart and a futures chart is at the bottom. Note that CME bitcoin futures settle 4 hours (1500 CST) before bitcoin's daily close (UTC).
How this script works
TradingView has a built-in ability to display daily settlements instead of the actual daily close. This can be enabled in chart settings for futures on the daily timeframe and there is an argument for Pine Script to do so as well. Because settlement times are different for multiple products during the day, the script uses the settlement price from daily timeframe, which is guaranteed to be correct because TradingView is wonderful. I accidentally found the undocumented backadjustment and settlement_at_close when I was trying to use ticker.inherit() to create a symbol with its daily close time changed to another symbol's, which I still haven't figured out. TradingView has since added documentation for both of them, but there's still an ambiguous 'etc.' in the description of ticker.inherit() so maybe there's more secret arguments...
The script is able to be used on non-standard charts by using ticker.standard(), but back-adjustment will need to be changed by input to match chart settings.
References
Investopedia explanation of settlement price.
www.investopedia.com
Settlement prices for ES.
www.cmegroup.com
CME summary of settlement price.
www.cmegroup.com
How to enable settlement price as close for daily intervals in TradingView. This does not affect the use of this script.
www.tradingview.com
About back-adjustment for continuous futures charts in TradingView.
www.tradingview.com
Futures/Spot Ratiowhat is Futures /Spot Ratio?
Although futures and spot markets are separate markets, they are correlated. arbitrage bots allow this gap to be closed. But arbitrage bots also have their limits. so there are always slight differences between futures and spot markets. By analyzing these differences, the movements of the players in the market can be interpreted and important information about the price can be obtained. Futures /Spot Ratio is a tool that facilitates this analysis.
what it does?
it compresses the ratio between two selected spot and futures trading pairs between 0 and 100. its purpose is to facilitate use and interpretation. it also passes a regression (Colorful Regression) through the middle of the data for the same purpose.
about Colorful Regression:
how it does it?
it uses this formula:
how to use it?
use it to understand whether the market is priced with spot trades or leveraged positions. A value of 50 is the breakeven point where the ratio of the spot and leveraged markets are equal. Values above 50 indicate excess of long positions in the market, values below 50 indicate excess of short positions. I have explained how to interpret these ratios with examples below.

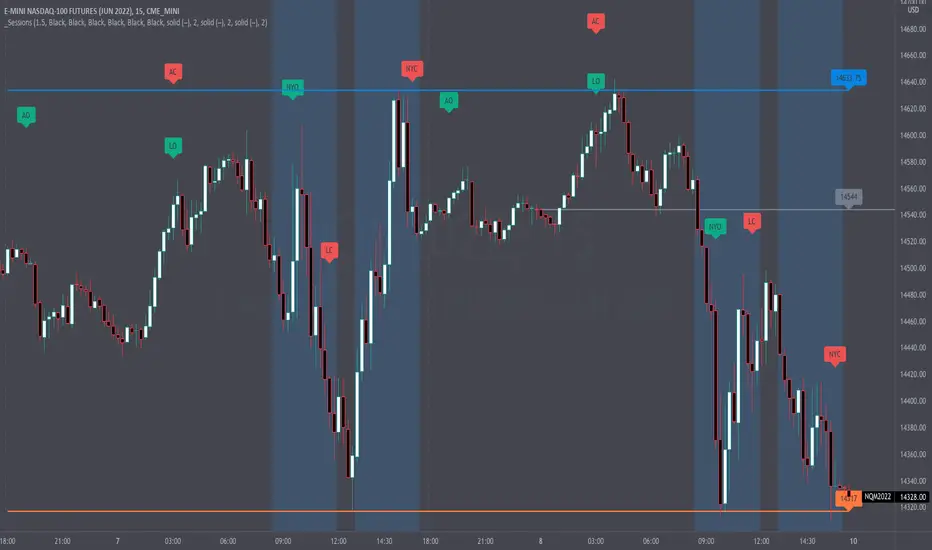
Futures Exchange SessionsIn the 24-hour trading of the futures market, this indicator provides the user with full customization concerning the most important factor: time. This indicator is centered around three main visualizations: labels, backgrounds, and lines that minimalistically allows the user to keep track of the many time intervals that occur during a futures market 24-hour trading cycle. It also artfully displays the previous days highs and lows. And everything can be individually toggled and configured so the user can get exactly what they want.
Labels
There are three main futures market sessions in a 24-hour period: the London, New York, and Asian Sessions. Each session is given an independent label for the open and close times. The six labels (LO, LC, NYO, NYC, AO, AC) can be individually toggled on or off, the label background color changed, the text switched between black or white, and the height can be lowered or raised. These customizations are intended to give the user full control of the session they are interested in at the moment.
Backgrounds
Backgrounds are the heart of this indicator. There are different colored transparent backgrounds for each of the futures sessions. So the user can clearly see the session they want to highlight without cluttering their chart and getting in the way of analyzing the candles.
If you are familiar with the London and New York killzones, these backgrounds are each individually configured.
If you are familiar with the Inner Circle Trader’s (ICT) NY Morning and Afternoon sessions, these are available. Also, most times weird price action occurs during the lunch hour of these sessions. The London and New York have a background for their respective lunch hours so the user is never caught of guard during these periods.
Lines
The markets are constantly looking for liquidity. To help the user see runs on liquidity, this indicator projects the previous days highs and lows on to the current day with a line and a price label. The line make it very easy to see where price may be headed. See the image below for the perfect example of this phenomenon. Each of the lines can be independently controlled by color, style, and width. And even the labels can be toggled on or off if the user would prefer just to see the lines. Lastly, there is a line that marks the midnight open price in EST.
Special Notes
This indicator is specifically designed for futures tickers.
All of the backgrounds are not designed to be turned on a once (there are many that overlap). They are designed to give the user ultimate control over exactly what timeframe backgrounds to display on their charts.
The labels only appear when timeframe is 1 hour or less.
U.S. Futures Price LimitsThis scripts plots settlement and the circuit breaker limits for U.S. Equity Indexes. The current limits for the equity index futures are + and - 7%, 13%, and 20% from the previous day's settlement price. If price reaches these levels trading is either paused briefly or for the remainder of the day. The full resource (CME Website) is below.
There are plans to add the remainder of the most actively traded U.S. Futures Markets.
To find out more about the price limits it is best to use the CME's website as a reference.
www.cmegroup.com

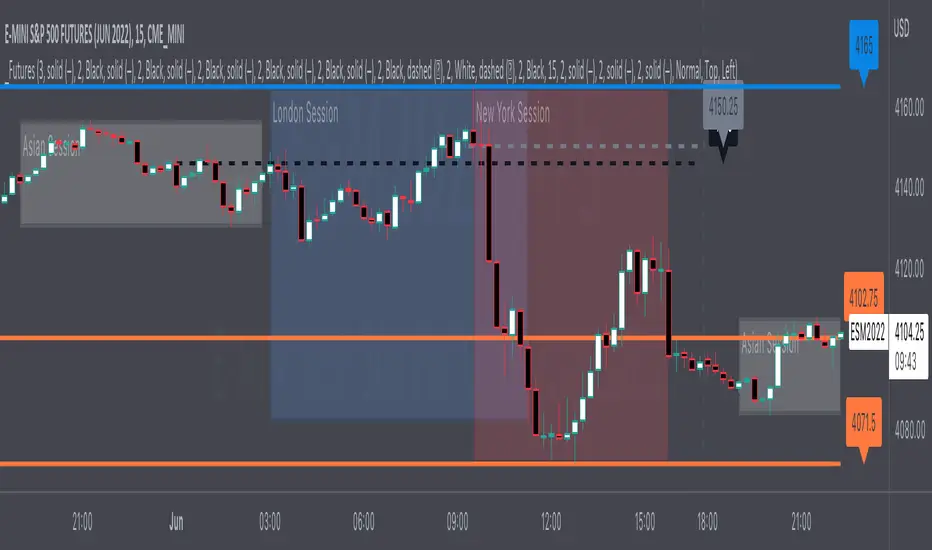
Futures Exchange Sessions 2.0Description
Successor to Futures Exchange Sessions indicator. Completely rebuilt code from the ground up. Every feature has been redesigned and refactored to be the most beneficial while allowing for complete configuration by the user.
This indicator displays Futures Sessions as live boxes that expand dynamically as price moves over the time interval. These boxes make liquidity levels extremely easy to spot and visualize. It helps the user identify market structure and develop their own bias of price action. Everything about the Session boxes can be configured. Box color, border color, border style, and border width are all individually controllable. Each Future Session can be turned on or off at any time. Also, each box has their own text label (Asian Session, London Session, New York Session) and this text can be moved around the box, change color, and change size.
Previous days highs and lows (major liquidity levels) are always important to the futures trader. This indicator now allows the user to individually display the three previous days highs and low levels as lines with optional label. Each line can be independently toggled on or off and like always, every conceivable customization option is available to the user. And the labels can be moved to the right (via the Input Settings) to allow unobstructed views of candles.
The midnight EST open and 8:30 AM EST open horizontal lines (developed by the Inner Circle Trader) are returning in this indicator. But the biggest improvement is that the lines stop at the current bar or the last bar of the trading day. Additionally, the time lines are displayed on previous days so the user can easily see how the candles reacted to these important times of the day.
The Session boxes and the horizontal time lines now can be set to only display a certain number of day back. If the user wants just to see Session boxes for the previous day only, they can do that. If the user wants to see the last 15 days of boxes or lines it is very easy to increase the days back in the settings. Currently, the max days back is 80 calendar days.
Additional Images
Easily visualize and understand price action across time
Everything is customizable so the user can easily match this indicator to their color preferences
Special Notes
To turn off box session text set opacity to 0%
Boxes and horizontal time lines only display when timeframe is <= 30 minute
BTC Volume Fiat vs Tether vs FuturesFutures = BYBIT+ BITMEX
Fiat = KRAKEN + BITSTAMP + BITFLYER + COINBASE
Tether = HITBTC + HUOBI + BINANCE + BITFINEX
Spot = Fiat + Tether
Tether vs Fiat = 100 * Tether / (Tether + Fiat)
Spot vs Futures = 100 * Spot / (Spot + Futures)

Futures Open/High/Low TablesAdds (up to) 3 tables to a chart, displaying Open/High/Low data for today (RTH and extended hours), yesterday, and the current week / month -- to help with intraday analysis of a futures ticker.
The tables only appear on intraday charts (5min, 30min, etc). On a Daily/Weekly/etc chart they are not calculated or shown.
In addition to Open/High/Low, the "Current" table in the top-right shows a live measurement of # of points from the open, the RTH open, and the highs/lows.
Lastly, the 9:30am ET open and the 4pm RTH close are by default marked with a shaded background (on intraday charts) for easy visual reference, and also to help with adjusting the session time to accommodate time zone issues if they occur.
Tested on ES in Eastern Time Zone, but should work on any futures instrument and any time zone by adjusting the Session Time setting.

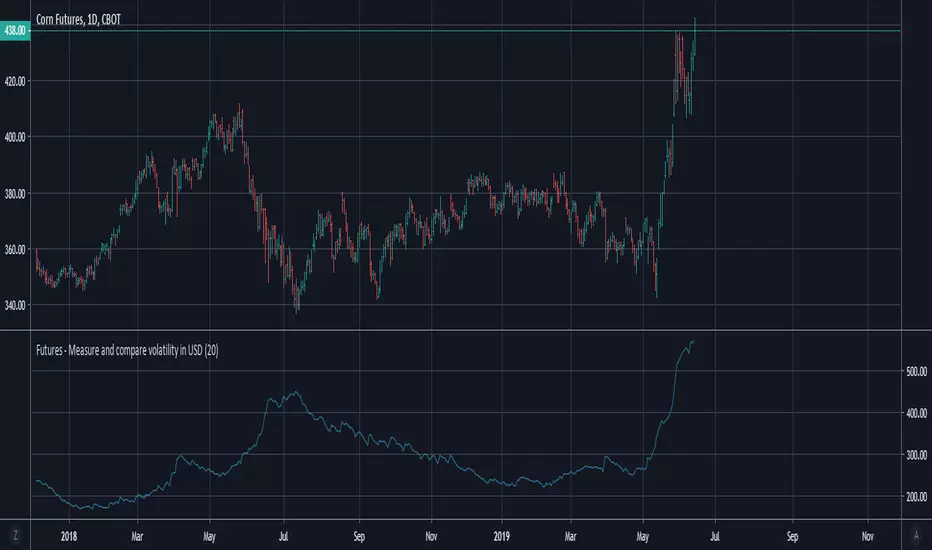
Futures - Measure and compare volatility in USDThis is a dirty fix.
Dollar value (syminfo.pointvalue) is wrong in Tradingview for the below listed futures, where the price is in quarters of cents.
For example ZC (Corn) says syminfo.pointvalue = 5000 (syminfo.mintick = 0.13), which gives you (with ATR = 6) volatility of $30,000 (6 * 5000) instead of the correct $300.
For all other futures I used the default syminfo.pointvalue.
Feel free to correct me, if I am wrong regarding the syminfo.pointvalue error.

Futures - Measure and compare volatility in USDDollar value (syminfo.pointvalue) is wrong in Tradingview for the below listed futures, where the price is in quarters of cents. So this is a dirty fix.
For example ZC (Corn) says syminfo.pointvalue = 5000 (syminfo.mintick = 0.13), which gives you (ATR = 6) volatility 30,000 USD instead of the correct 300 USD.
For all other futures is used the default syminfo.pointvalue.
Futures Exchange Sessions 3.0Description
The ultimate conclusion to the Futures Exchange Sessions 2.0 indicator. In version 3.0 the user gets full control of the start and end times of three separate dynamic boxes and one horizontal line. If the user wants to visually keep track of killzones, lunches, or any other time span in a trading day, version 3.0 will dynamically expand and keep track of price within the time specified by the user.
Inputs and Style
Everything about the three dynamic boxes and one horizontal line can but independently configured. Color, style, border, width can all be adjusted. In the Settings each box has a text box so the user can give each one a unique name.
Timezone
All of the start and end times are in EST. Additionally, each box and line need a dependent start of each day. This is controlled by a setting where the user can specify a timezone called Start Day Timezone which would be midnight of the respective timezone. In general if a box or line resides within a particular Session pick the corresponding timezone. If the users box/line fits in the Asian Session then choose Asia/Shanghai. If the box/line is within the London Session then choose Europe/London. And the same goes for the New York Session.
Special Notes
If start time is within one period of the Start Day Timezone in the Settings, then the line/box won't display
Boxes and time lines only display when timeframe is <= 30 minute
To turn off box text label set opacity to 0%

Futures OI and Net positionsThis is an indicator that gets data from Quandl and presents weekly CFTC futures data (www.cftc.gov). In this indicator, Open Interest (OI) and net noncommercial positions are presented. Net_noncommercial positions are calculated as noncommercial_long - noncommercial_short.

[SCL] BTC Futures Daily Bias (CME BTC1!)Derives a bias for BTC/USD on the daily timeframe and displays it on the chart in a configurable way. Takes price data from the CME BTC futures chart (exchange is configurable), regardless of what symbol you run it on.
Why? Because futures are said to give cleaner charts, but most traders are not trading CME futures. So you can use this indicator on whichever exchange you want to chart Bitcoin on.
Uses the 80D HMA and the 8D and 21D EMAs by default; all intervals are configurable.

Binance Auto Spot-Futures Premium/Discount -CheThis Script is based in the 2020 @Plumptoiletduck script
Special thanks to @tartigradia for the Auto Detect code for the Binance pair.
It tells us the difference in price between Spot and Perpetual Futures.
Now I incorporated the function that automatically detects the pair we are in to show the premium/discount of that pair.
You never need to select the currency you are in the script anymore!
It is specially designed for Binance coins, it includes all perpetuals.
How to use it?
Usually if the Futures are higher than the Spot it indicates that we are in an over exposure zone of longs in futures.
If the spot is cheaper than the futures it means that the futures are more fearful.
You can use this script with an Open Interest script to get an idea of what is going on.
Other examples:

Keltner + RSI Bitcoin Futures Trading [luca_badoer]This indicator combines the power of the Keltner channel with the power of the Relative Strength Indicator (RSI). It can help understand when the market is entering a bullish or a bearish trend.
Normally a Keltner channel would reference an Exponential Moving Average (EMA) of the price. In this case the Keltner Channel in the "Keltner + RSI Bitcoin Futures Trading " references the EMA of the 14-day RSI (white line). On top of that it overlays a 7-day RSI line (blue line). This produces some signals that are particularly useful in 2h, 4h and 1 day charts. The signals consist in the 7-day RSI line (blue line) crossing the upper (green) or lower (red) Keltner channels as well as the middle (white) line. Depending on the direction of the crossing (up or down) and the RSI level (from 0 to 100) at which the crossing takes place this produces bullish or bearish signals.
Examples:
- Bullish crossing: 7-day RSI (blue) crosses both the lower (red) and middle (white) lines upwards at a low to neutral RSI level (<70%)
- Bearish crossing: 7-day RSI (blue) cross both the upper (green) and middle (white) lines downwards at a high to neutral RSI (>30%)
Recommendations:
- Better to use it in 2h, 4h, and 1-day charts, thought it can also be used in lower timeframes. Confirmations of crossings in higher time-frames provide more certainty about the direction of the move.
- Use in combination with Heikin Ashi candles and volume indicators.
Real Trading Hours - Vertical Lines - Mark RTH for Futures 12/Jan/2021 09:15 AM AUTHOR: Brandon Gum
--
Updated script to plot vertical lines for open and close of futures.
Not sure why the 8:30 and 15:00 times had to be used over 9:30 or 16:00
Only plots for products of type futures. - Could be easily expanded to work with cryptos as well if you wanted.
======================

Binance Futures/Spot PriceShows the last price of either the spot or futures market on Binance, for the current coin.
It shows futures if you are in a spot market, and spot if you are in futures.
Currently this only works for USD stable coin pairs (BUSD, USDT, USDC, ...).
I don't plan to add COIN future pairs, it's not useful to me.
Additionally, it allows you to show the lowest and highest traded price (in the opposite market you are currently on: spot/futures) for a given period, and the respective chart, if you are into that sort of thing.
Bye :D

Pre-Market levels for Futures This indicator draws the Pre-Market Low and High for futures. Futures do not really have "P.M" because they are almost always open, but I chart /ES and trade $SPY options, so this has been useful in finding P.M levels.

ICT Index Futures Session LinesICT Index Futures Session Lines
Description:
The script is based on one of ICT's concepts on trading Index Futures. The script lays out the daily range from an intraday basis.
Range:
00:00 - New York Midnight
08:30 – New York Open (News events come out)
12:00/13:00 - New York Lunch (No trade time period)
13:30 - (Algorithm)
16:30 - Close
* The open, high and low lines are plotted from 00:00 to 08:30
How To Use:
You will need to check the daily bias. Prior to 8:30 you are to look for previous swing points where liquidity may exist. During the open you want to see if a high or low is taken out, and then wait for an energetic break/displacement for a potential FVG/imbalance retracement entry.
Strategy is for LTF (1 to 15m)
Default time zone is set to America/New_York (UTC New York), so lines will be plotted correctly regardless of user’s local UTC chart setting.

Crypto Spot/Futures Dominance Indicator with AlertsFutures/Spot Dominance Indicator:
Overview:
The futures/spot dominance indicator is a versatile tool used by traders and analysts to assess the relative strength or dominance of the futures market in relation to the spot (or cash) market for a specific asset. It offers insights into market sentiment, potential arbitrage opportunities, and risk management while incorporating the VWAP indicator for added context.
How It Works:
This indicator automatically detects and adapts to the futures symbol applied to the chart, simplifying the setup for traders. However, it still necessitates manual input of the corresponding spot pair to ensure accuracy.
Automatic Futures Symbol Detection: The indicator starts by automatically detecting the futures symbol on the trading chart, eliminating the need for manual configuration. This ensures that the indicator is applied to the correct futures contract.
Manual Spot Pair Entry: To provide a reliable reference point for the comparison, traders must manually input the corresponding spot symbol via the indicator's inputs. For instance, if the indicator detects the BTCUSDT.P futures symbol, traders would manually enter the BTCUSDT spot symbol.
Gathering Data: The indicator collects historical price data for both the detected futures contract and the manually specified spot symbol. This data includes open, high, low, and close prices, as well as trading volume.
VWAP Calculation: To gain a deeper understanding of price trends and market dynamics, the indicator calculates the VWAP (Volume Weighted Average Price) for both the futures and spot markets. The VWAP places more weight on prices with higher trading volume, offering a weighted average that reflects market consensus.
Premium/Discount Calculation: By subtracting the VWAP of the spot market from the VWAP of the futures market, the indicator quantifies the premium or discount of the futures price concerning the spot price. A positive value indicates a premium, while a negative value suggests a discount.
Plotting: The premium/discount value is displayed as a line on the chart, often alongside moving averages or other smoothing techniques for improved trend analysis.
Alerts: In addition to its analysis capabilities, this indicator now includes alerts to enhance your trading experience. It alerts you in the following scenarios:
Premium Above Average: Notifies you when the premium crosses above the average line.
Premium Below Average: Alerts you when the premium crosses below the average line.
Premium Above Zero: Provides an alert when the premium crosses above the zero line.
Premium Below Zero: Generates an alert when the premium crosses below the zero line.
Benefits of the Futures/Spot Dominance Indicator:
Sentiment Analysis: Traders use the indicator to assess market sentiment. A futures premium might signify bullish sentiment, while a discount could indicate bearish sentiment.
Arbitrage Opportunities: Identifying price discrepancies between futures and spot markets can help traders spot arbitrage opportunities, where they can profit from price differentials.
Risk Management: The indicator assists in evaluating risks associated with futures positions, helping traders manage their exposure effectively.
Trend Confirmation: When used in conjunction with other technical indicators, futures/spot dominance, along with VWAP, can provide additional confirmation of price trends.
Hedging: Investors and corporations use this tool to gauge the effectiveness of hedging strategies based on futures contracts.
Speculative Trading: Traders and investors use the indicator to inform speculative positions, aligning their trades with perceived market strength or weakness.
Insightful Analysis: Futures/spot dominance analysis, enriched by VWAP data, offers insights into market behavior during specific events or changes in economic conditions.
In summary, the futures/spot dominance indicator, with its integration of VWAP and automatic futures symbol detection, provides traders and investors with a comprehensive tool to assess market dynamics. It aids in sentiment analysis, risk management, and trend confirmation while offering potential arbitrage opportunities. The newly added alerts enhance the indicator's functionality, providing timely notifications of key market events. However, it relies on manual input of the corresponding spot pair to ensure precise comparisons between futures and spot markets. It should be used alongside other analysis techniques for a well-rounded view of the market.

Futures Position Size CalculatorFutures Position Size Calculator by vmkhats
Streamline your futures trading risk management with this intuitive Pine Script utility designed for TradingView. Created by vmkhats, this tool automates position sizing calculations for popular futures contracts, ensuring precise risk control while eliminating manual errors.
Key Features:
Supports 15+ Instruments: Trade confidently with preconfigured settings for indices (ES, NQ, RTY), commodities (CL, GC), currencies (6E), and micro contracts (MES, MNQ, MCL).
Customizable Inputs: Set your risk amount (e.g., $1,000) and stop-loss size in points, tailored to your strategy.
Automatic Calculations: The script computes stop-loss size in ticks, risk per contract, and optimal position size using floor rounding to prevent over-leveraging.
Clear Visual Output: A table displays results (instrument, risk, stop size, contracts) with color-coded alerts for invalid configurations (e.g., zero position size).
Ideal for both novice and seasoned traders, this utility enforces disciplined risk management while saving time. Enhance your TradingView workspace with this essential tool and trade futures with confidence.
Created by vmkhats — ensuring traders stay precise, proactive, and risk-aware.

BTC Futures BasisShows various basis percentages in a table and plots historical basis. Also has an alert function for backwardation events. Useful for tracking bullish/bearish sentiment in BTC futures markets.
*Currently displays March and June futures for the following exchanges: Bitmex, Binance, Deribit, Okex, and FTX
Also displays CME Continuous Next Contract. All of the symbols are customizable.
-----------
Market-wide backwardation usually occurs during a heavy sell-off (such as a liquidation cascade).
**For getting alerts of backwardation events, I recommend creating an alert on the 1 minute chart with the condition "Any alert() function call". Alert level is customizable as well.
-----------
*NOTE!! : Futures contracts expire (obviously), so the contract symbols will need to be updated periodically. I will try to keep them updated going into the future.
**NOTE2!! : The alert() function does not track the CME contract. This is to avoid false triggers.

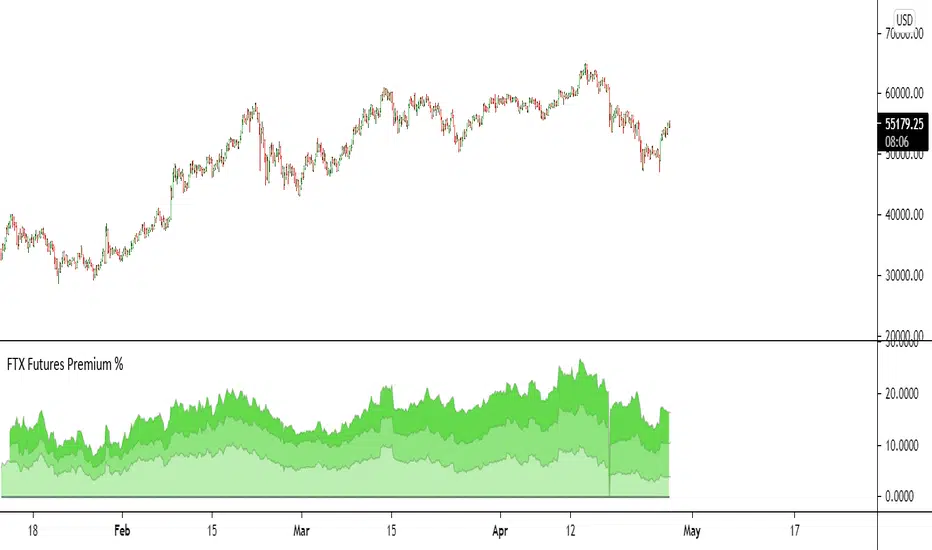
FTX Futures Premium %Charts the Futures Premium % for FTX futures markets
Change the asset name from BTC to ETH in settings to switch assets, and will work with all assets with long-dated futures markets on FTX as they are added