Custom EMA PrismThis script implements the Binary Logic Trading (BLT) algorithm to calculate a score from 0 to 7. This score is calculated assigning a power of 2 weight to the positive sign of 3 Phi^3 distant EMAs' slopes. The largest EMA slope positive sign receives weight 4, the middle length EMA slope positive sign receives weight 2 and the shortest EMA slope positive sign receives weight 1. The positive sign of an EMA is defined as 1 if the slope of the EMA is positive and 0, otherwise. Therefore, for EMAs 305, 72 and 17, if slope(EMA305) > 0, slope(EMA72) < 0 and slope(EMA17) > 0, then score will be 4*1 + 2*0 + 1*1 = 5. Up to my knowledge, this score was first proposed by Bo Williams and named by him as Prisma.
Due too sampling issues, this script ONLY WORKS with graphic time of 1d. I would like to thanks to MrBitmanBob for showing me how to get quotations from a graphic time distinct from the current one.
This script also gets sampling data from graphic times 2h and 30m to calculate their score. As, even for smaller graphic times, price data is sampled at the current time frequency, the EMA lengths for those smaller graphic times needed to be proportionally decreased, meaning that when calculating the score for 1d with lengths 305, 72 and 17, the score for 2h must be calculated with lengths 72, 17 and 4, and the score for 30m must be calculated with lengths 17, 4 an 1. I understand that some precision may be lost but it is the best that is possible.
There is an optional setting for Crypto Currencies that instead of calculating the score for 1d, 2h and 30m, it calculates the score for 1d, 4h and 60m. This is due to the fact that Crypto Currencies are traded 24x7. Despite of this setting, the labels at the Style tab of the settings window remains 2h and 30m, because they must be constants.
This script with the corresponding EMAs chart and the EMAs Angle chart provides a broader view of the trading scenario.
Search in scripts for "binary"

Bar's direction InfoBar's direction Info show number of case which bars have same direction and counting percent of next bar's direction.
This info may be useful to trade Binary Option.

Zahorchak MeasureCreator: Michael G. Zahorchak.
References:
The Art of Low Risk Investing by Michael G. Zahorchak, 1977. Unfortunately, it's all but impossible to find a copy these days.
The Complete Guide to Market Breadth Indicators by Gregory L. Morris, 2006. A fantastic resource for those interested in Technical Analysis or creating their own trend based system.
Two articles by Greg Morris on the Zahorchak Measure. I can't link to them under the House Rules, but they are easily searchable.
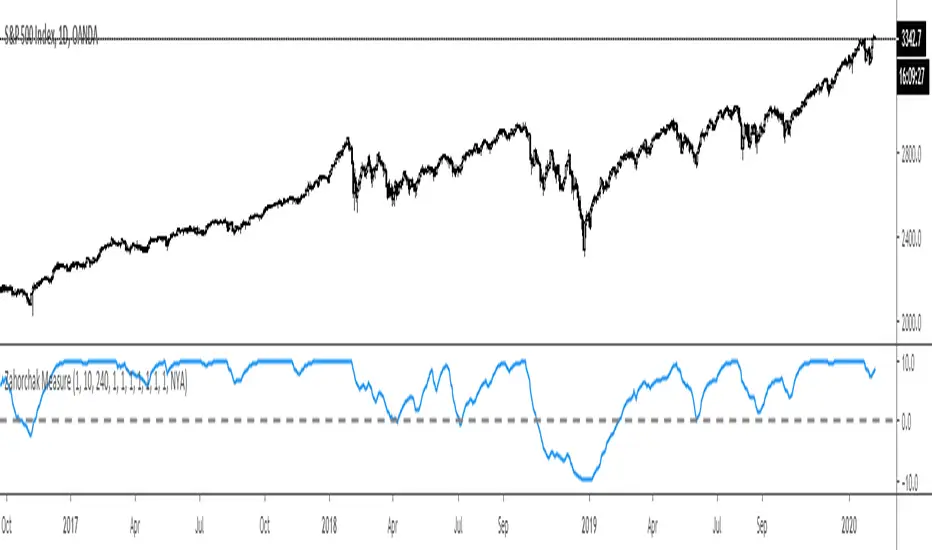
The Zahorchak Measure (ZM) is designed to give you a market bias (either uptrend or downtrend) which you can use to determine a trade bias for ETF's or stocks.
ZM works by taking multiple moving averages of the NYSE Composite, a moving average of the NYSE advance decline line, and examining the relationship between those elements. Broadly, the market is considered to be in a uptrend when ZM is above zero, and a downtrend when below. However, there are many ways to interpret the indicator.
The version created by Greg Morris is more akin to a binary indicator in that ZM jumps from number to number. This version is smoothed to create an oscillator as it reduces whipsaws (at the expense of lag). You can set the EMA Length to 1 to go back to the original.
Some notes:
Michael Zahorchak called it the "Zahorchak Method", whereas Greg Morris uses the term "Measure". I'm not totally clear on the change, but Mr. Morris made some changes (covered below), so that may explain the altered name.
The original indicator used moving averages of 5, 15, and 40 weeks. I have converted these to daily numbers as that's the time frame I most commonly trade. You can convert the numbers back by dividing by 5.
The original indicator used the Dow Industrials for the moving averages, however Greg Morris switched to the NYSE Composite due to the advance decline line being based on the NYSE.
Greg Morris removed the 5 period moving average of the NYSE Composite, as it created increased volatility at market tops and bottoms. I tested ZM with the 5 period MA added back in, and I believe removing it creates a superior indicator.
I've added both Multi Time Frame functionality, and the ability to alter moving average lengths. Play around and see what you can come up with.
ZM oscillates between -10 and +10. There are some interesting levels creating between these two numbers (apart from the obvious zero level) - see what you can come up with.
All credit goes to Michael Zahorchak and Greg Morris for the indicator creation. I have simply reproduced their work for the TradingView community as this great indicator wasn't available.
Any queries let me know in the comments or PM me.
DD.
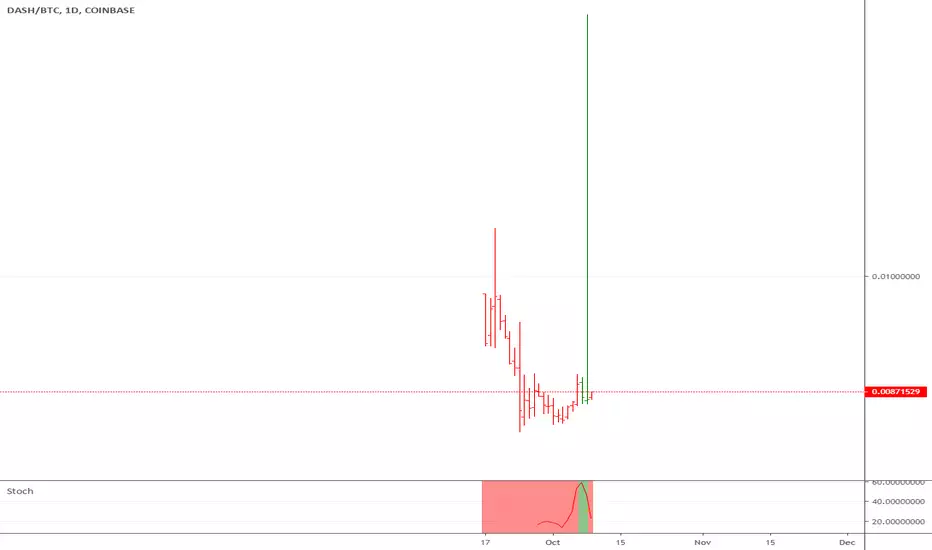
Stochastic binary option styleUsing Time Frames For Trend – You can also use different time frames to determine trends with stochastic. To do this you will need to use two different time frame charts, I like to use the weekly/daily or daily/hourly combination depending on the asset. Weekly/daily works well with stocks and indices while I prefer the shorter time frame for currency and commodities. This is how it works; stochastic on the longer term chart sets trend, stochastic on the shorter term chart gives the signal. If, on the weekly chart, stochastic is pointing up then you would trade bullish signals on the daily charts. Or if using the daily/hourly combo the stochastic on the daily would set trend while signals would come from the hourly chart.
Green color bar and background means k is > d, the crowd is bullish (trend is bullish, a bullish crossover is happened), red is the contrary (bears are the leaders)
Credit to Michael Hodges

Relative Body Indicator by VtsRBI:
The EMA of the relative body (RB) of Japanese candles is evaluated.
The RB of a candle (my definition) is simply the ratio of the body with respect to its full length
and taken positive for bull candles and negative for bear candles:
e.g. a bull "marubozo" has RB=1 a bear "marubozo" has RB=-1;
a "doji" has RB=0.
This simple indicator grasps the essence of the market by filtering out a great deal of noise.
A flag can be selected to calculate its very basic binary version, where a bull candle counts as a one
and a bear candle counts as a minus one.
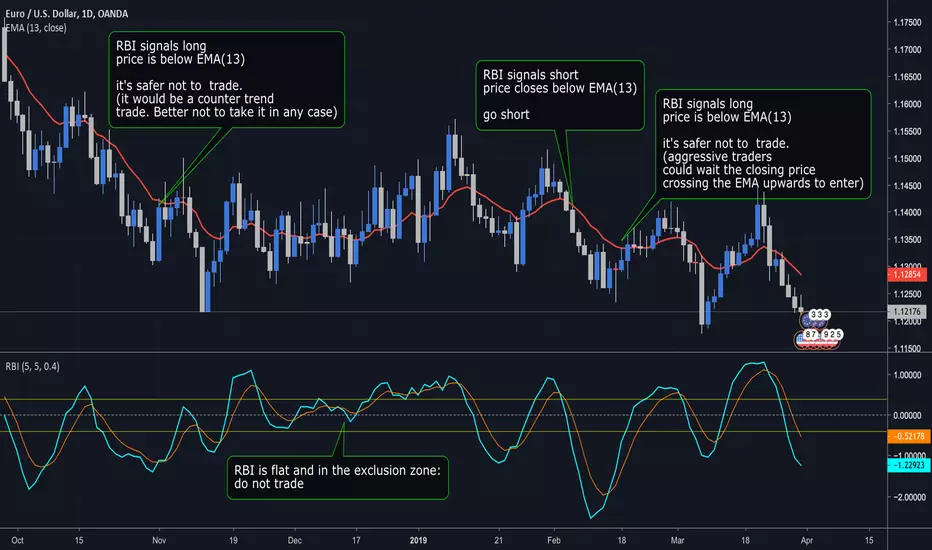
Enter (or exit) the market when the signal line crosses the base line.
When the market is choppy we have a kind of alternating bear and bull candles so that
RBI is FLAT and usually close to zero.
Therefore avoid entering the market when RBI is FLAT and INSIDE the Exclusion level.
The exclusion level is to be set by hand: go back in history and check when market was choppy; a good
way to set it is to frame the oscillations of RBI whe price was choppy.
RBI is more effective when an EMA of price is used as filtering. I found EMA(13) to be
a decent filter: go long when base crosses signal upwards AND closing price is above EMA(13);
same concept for going short.
As any other indicator, use it with responsibility: THERE CAN'T BE A SINGLE MAGIC INDICATOR winning
all trades.
Above all, have fun.
Vitelot/Yanez/Vts March 31, 2019
Note: I'm not aware of any indicator like this. My apologies to whoever had this idea before me.
Surface Roughness EstimatorIntroduction
Roughness of a signal is often non desired since smooth signals are easier to analyse, its logical to say that anything interacting with rough price is subject to decrease in accuracy/efficiency and can induce non desired effects such as whipsaws. Being able to measure it can give useful information and potentially avoid errors in an analysis.
It is said that roughness appear when a signal have high-frequencies (short wavelengths) components with considerable amplitudes, so its not wrong to say that "estimating roughness" can be derived into "estimating complexity".
Measuring Roughness
There are a lot of way to estimate roughness in a signal, the most well know method being the estimation of fractal dimensions. Here i will use a first order autocorrelation function.
Auto-correlation is defined by the linear relationship between a signal and a delayed version of itself, for exemple if the price goes on the same direction than the price i bars back then the auto-correlation will increase, else decrease. So what this have to do with roughness ? Well when the auto-correlation decrease it means that the dominant frequency is high, and therefore that the signal is rough.
Interpretation Of The Indicator
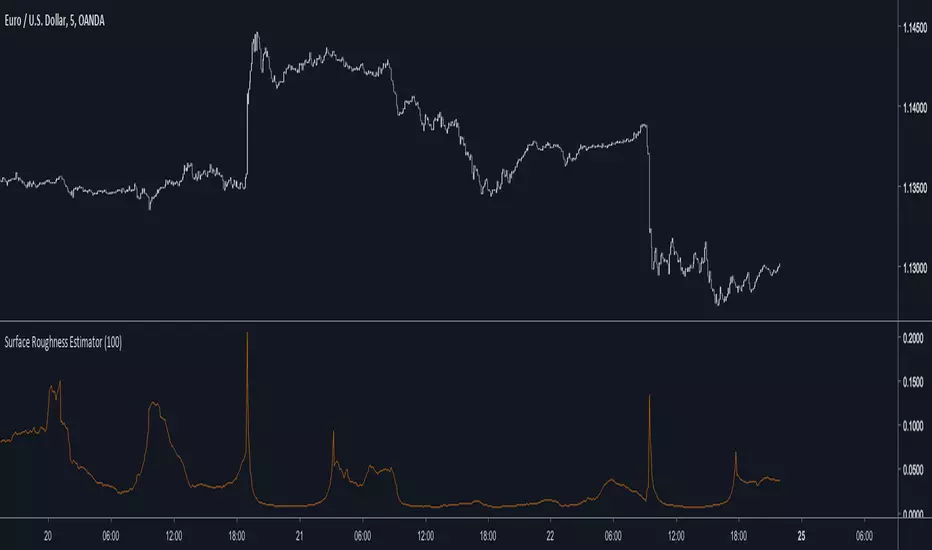
When the indicator is high it means that price is rough, when its low it indicate that price is smooth. Originally its the inverse way but i found that it was more convenient to do it this way. We can interpret low values of the indicator as a trending market but its not totally true, for example high values dont always indicate that the market is ranging.
Here the comparison with the indicator applied to price (orange) and a moving average (purple)
The average measurement applied to a moving average is way lower than the one using the price, this is because a moving average is smoother than price.
Its also interesting to see that some trend strength estimator like efficiency ratio can treat huge volatility signals as trend as shown below.
Here the efficiency ratio treat this volatile movement as a trending market, our indicator instead indicate that this movement is rough, such indication can avoid situation where price is followed by another huge volatile movement in the opposite direction.
Its important to make the distinction between volatility and trend strength, the trend is defined by low frequencies components of a signal, therefore measuring trend strength can be resumed as measuring the amplitude of such frequencies, but roughness estimation can do a great job as well.
Conclusion
I have showed how to estimate roughness in price and compared how our indicator behaved in comparison with a classic trend strength measurement tool. Filters or any other indicator can be way more efficient if they know how to filter according to a situation, more commonly smoothing more when price is rough and smoothing less when price is smooth. Its good to have a wider view of how market is behaving and not sticking with the binary view of "Trending" and "Ranging" .
I hope you find a use to this script :)
Best Regards
Bollinger Bands SqueezeEnglish:
Simple histogram, showing Squeeze of Bollinger Bands.
Usage is simple - when price is in Squeeze, no entries in any direction. For using with Bollinger Bands indicator, including binary options.
Russian
Простой индикатор, наглядной отображающий стадию Сжатия лент Боллинджера.
Простой в использовании - когда цена в Сжатии - не входим в сделку. Особенно эффективен при связке с индикатором лент Боллинджера и входе в сделку при раскрытии лент. Также применим для бинарных опционов
Example/Пример

BO Swing Finder R0.6 by JustUncleLThis indicator alert study attempts to detect confirmed Swing points. It uses Bollinger Band centre line crosses as the main signal. The main detection occurs by looking for the first BB centre line cross that was initiated from outside the Bollinger Channel (alternatively KC channel can be used).
The optional HullMA (any any other MA pair) are used to confirm the swing direction. The indicator also plots the two KitKat Support and Resistance lines with optional High/Low labelling on KitKat1 lines.
This indicator tool is suitable for any time frame and can be traded with Binary Option (even 1min) orders (2-3 candle expiry) or as Forex trade orders. It is suitable for Currencies, Cryptocurrencies and Metals. May also be useful on other markets as well.
The MA filtering options, each MA line can be a different type, with an optional offset:
SMA = Simple Moving Average.
EMA = Exponential Moving Average.
WMA = Weighted Moving Average
VWMA = Volume Weighted Moving Average
SMMA = Smoothed Simple Moving Average.
DEMA = Double Exponential Moving Average
TEMA = Triple Exponential Moving Average.
HullMA = Hull Moving Average, fast moving MA.
SSMA = Ehlers Super Smoother Moving average, similar results to HullMA.
ZEMA = Near Zero Lag Exponential Moving Average.
TMA = Triangular (smoothed) Simple Moving Average.
NOTE: The signal calculations do occur on the current candle, so the state of the signal may re-build until the current candle is closed. I have designed the script to behave this way on purpose. This gives traders the option of
preparing their trade early or even taking the trade early if they want. Otherwise the trader can be more conservative and wait for signal candle to close, to give them a confirmed signal. (This is NOT re-painting as the historical signal states are fixed and will not change, unless you change some setup options.)
Hints:
1) As with all indicator and alerting tools, not all signals will yield a tradable successful swing. You need to apply you own analysis on each signal to determine the probability of success.
2) When using the MA to filter the signals you should use it for two types of filtering:
Supportive that confirm swing like fast moving MAs with fairly short lengths, eg HullMA(21,25).
Long Term Direction with smoother longer length MAs like SMMA(180,220) to show up swings back into direction of the longer term trends.
Inspiration: @Lyiness
References:
Momentum VMA KITKAT CROSS v2.1 by vdubus (- Vdubus_Channel www.vdubus.co.uk)

Amplitude IndicatorHello Traders,
Amplitude is the measurement of the difference between the variable's extreme values.
This indicator is based on the Balance of Power (close-open)/(high-low).
Instead of taking the value of a single candlestick, exponential moving averages are used in the formula.
On it's lowest settings (1,2) it's exactly the same as the Balance of power, by adjusting the smoothing you can seen the highs and lows in momentum of the chosen period. (highly adjustable RSI)
By adding a simple moving average (Signal Line) it turns into a cross-over type, like MACD with a histogram.
This indicator is doesn't have a default or 'best' setting, instead I use the Fibonacci numbers as input. (1,2,3,5,8,13,21,34,55,89,144).
Depending on its settings this indicator is well suited for binary options, trend and reversal trading.
Cheers, Indicat...

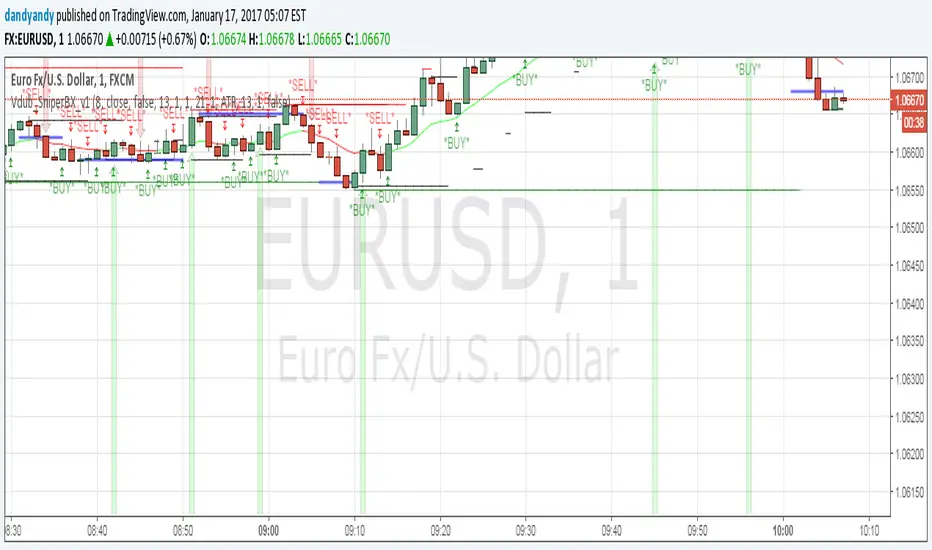
Candle pattern doji-harami just something I wipped together. Unused code still in script and left there for you to experiment with. simple classic doji candle pattern recognition code. Binary option use recommended. red arrow suggest down trade and green for up trade. if market direction fails then a black arrow pops up on next candle. this is to help quickly judge the accuracy while experimenting with input numbers.

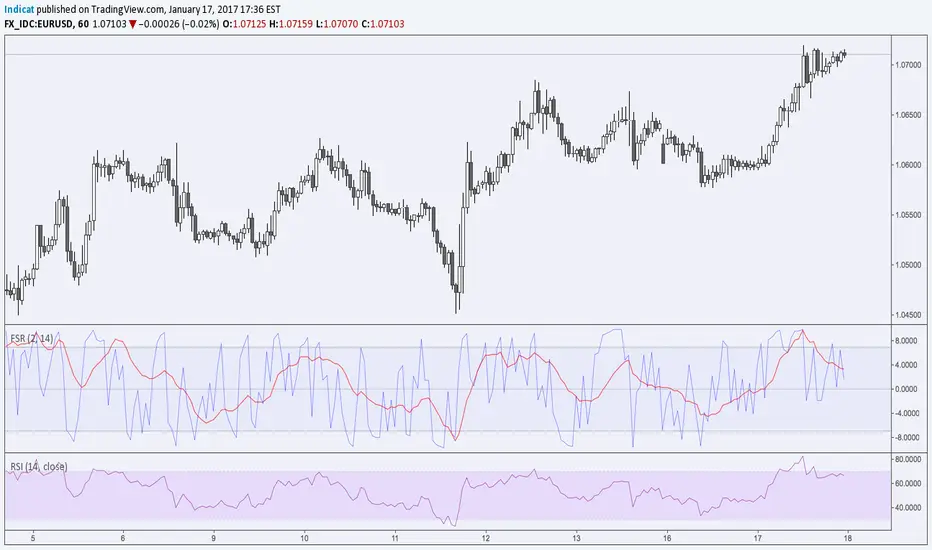
Fast/Slow RSIYo Traders,
This indicator is inspired by the RSI-2 strategy in combination with a somewhat smoothed RSI-14.
It has a zero-line, allowing it to use columns or an area as a histogram.
A nice tool to find that perfect entry/exit point, also very useful for Binary Options.
Cheers, Indicat
Transient Zones and Recurrent Zones by M.UneebThis is a Transient Zones and Recurrent Zone Strategy Script for Binary Options Trading.

Simple_Buy_Sell_Signal PipizerThis is a simple buy and sell pattern based on my customized candlestick pattern and trend following. This indicator can also be used for binary option trading except the selling signal candle is not touching the lower band and the buying candle is not touching the upper band.

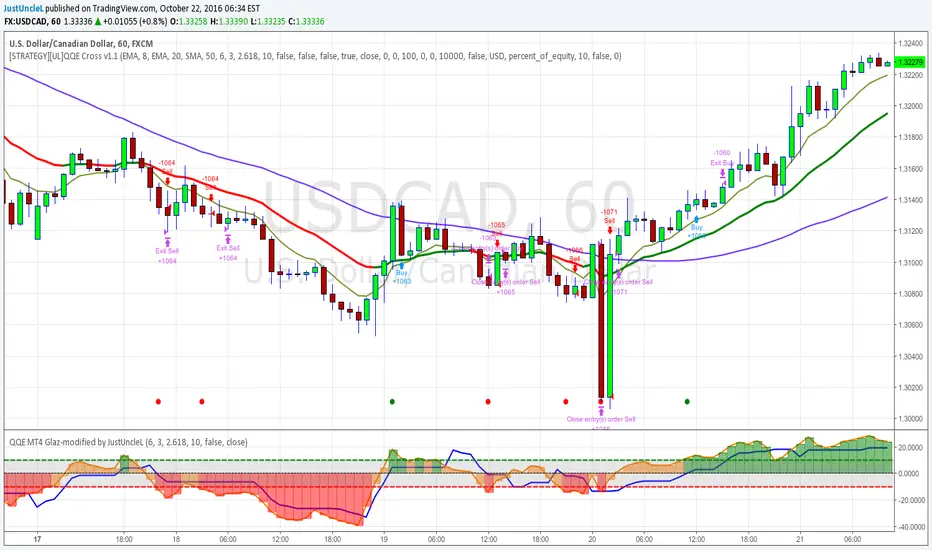
[STRATEGY][UL]QQE Cross v1.1Updated by request: this is a "Strategy" trading version of the "QQE Cross Indicator Alert v2.0 by JustUncleL" (which is mainly for Binary Options trading), the same BUY/SELL signals are used to generate trade entry and exit conditions. Thanks again to JayRogers for making the Strategy risk management easier to understand and implement.
In this update I have added "Take Profit" option and cleaned up the risk management code. Also changed the close BUY/SELL order if EMA20 direction changes rather the next BUY/SELL opposite signal, making the close earlier.
BE ADVISED TO USE AT YOUR OWN RISK, even though back testing has shown good results, I don't have any Forex trading account to forward test against. You need to perform these test yourself and get back to me if there is any issues.
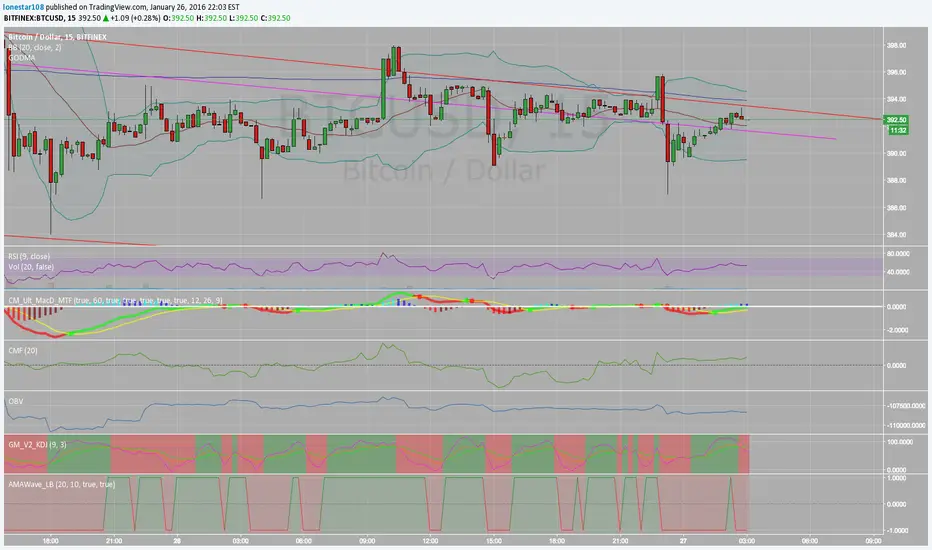
Traders Dynamic Index Indicator Alert v0.1 by JustUncleLThis is a trend trading indicator+alert utilising the Traders Dynamic Index (TDI), Price Action Channel (PAC) and Heikin Ashi candles.
About 6months ago I came across the use of TDI in "E.A.S.Y. Method" that I found in forexfactory forums: www.forexfactory.com
and I was able to set up a chart based on the specifications by using Kurbelklaus scripts. However, I found that the alerts were being generated one or two bars too late, so at that time I was not successful using it with Binary Options. A few months later I found a variation of the method in the forecfactory forums which is able to generate the alerts a bit earlier, so this indicator is a modification of that early detection version.
The indicator can optionally use Heikin Ashi candles only for all it's calculation. I would recommend viewing the chart with Heikin Ashi candles, these smooth out the trends and makes trends very clear.
I found that this method it works good with most currency pairs or commodities and with 5min+ timeframe charts. I would suggest expiry of 2 to 6 candles.
ALERT GENERATION:
=================
The TDI (Traders Dynamic Index)
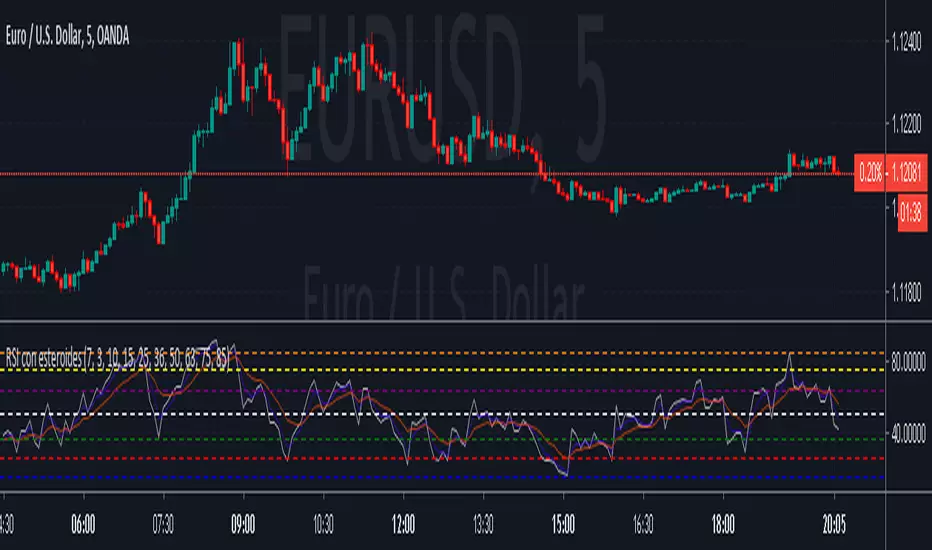
---------------------------------------------
Volatility Band VB(34), color: Blue, buffer: UpZone, DnZone
Relative Strength Index RSI(13)
RSI PRICE LINE (2), color: Green, buffer: mab
RSI TRADE SIGNAL LINE (7), color: Red, buffer: mbb
MARKET BASE LINE MID VB(34), color: Orange, buffer: mid
Indicator SignalLevels:
-------------------------------
RSI_OversoldLevel : 22 (normally: 32)
RSI_OverboughtLevel : 78 (normally: 68)
Alert Conditions:
-----------------------
Strong Buy : yellow
Medium Buy : aqua
Weak Buy : blue
Strong Sell : fuchsia
Medium Sell : purple
Weak Sell : black
Hints on How to use:
----------------------------
- When a Medium or Strong alert is generated and MACD histogram colour matches the direction
of the alert (optional auto filter), then place trade in direction of alert candle and MACD.
- I use the multi-Hull MA's for overall trend direction confirmation.
- Best positions normally occur near the MACD(5,15,1) Histogram crossing the zero line.
- The optional coloured Dots along the bottom of the indicator represent the first alert
of this type that was generated in this sequence.
- It is advisable to trade in the direction of the main trend as indicated the HULL MA red cloud:
if red cloud underneath PAC then BULLISH trend, if red cloud above PAC then BEARISH trend.
- Selecting the HeiKin Ashi candles does affect the MACD and MA caculations, so if you select
normal candles the result chart will change. You can still Optionally select to use Heikin Ashi
for calculations.
- When using the Heikin Ashi candles, a good buy entry is indicated by long top wick and no bottom wick
for bull (green) candles and good sell entry is indicated by long bottom wick and no top wick for
bear (red) candles.
- When the MACD histogram is flat and close to zero line,
this indicates a ranging market, do NOT trade when this occurs.
- When the PAC channel on the main chart is spread apart widely, this is an indication
of extreme volatility and choppy chart, do NOT try to trade during these periods.
A choppy chart is also indicated by Heikin Ashi candles with long wicks on both sides
of the candles.
- You can specify what strength level Alerts are generated (default 2):
Level (1) means only generate Strong Alerts only.
Level (2) means generate Strong and Medium Alerts.
Level (3) means generate Strong, Medium and Weak Alerts.


EA_Binary Option Spfrat StrategyThis somehow my Phase 1 of Clean EA on Binary Option using Spyfrat Idea and with Help Trading View Community.
Timeframe = 1 minute
Strategy: (Momentum)
1) BB 50 0.2
2) RSI (30)
3) Time Squeeze - to somehow disregard consolditation

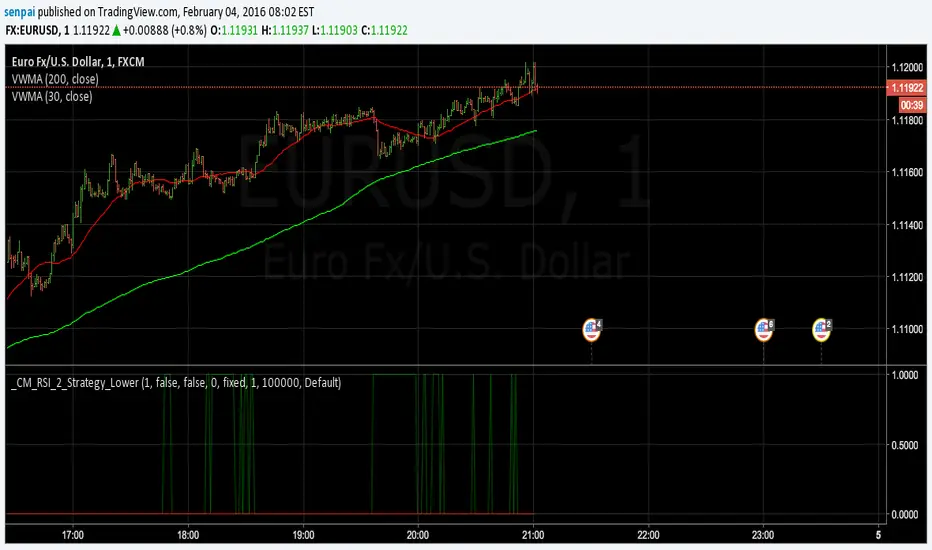
My EA Strategy for 3 minute BOI made an EA for my long term project on Binary Option trading.
TimeFram = 1 minute
Signals are:
Green Spike = Buy (for 3 minutes expiration)
Red Spike = Sell (for 3 minutes expiration)
Strategy:
VMWA (50&200) = Trend Indicators
RSI (30) = pull back entry signal on a strong trend
BackTest = 80% Winning Rate
Improvements Needed:
>> Better Entry Star Signals
>> How to be automatically connected to a certain broker for HFT