Search in scripts for "breakout"


Breakout CandlesCandle is considered breakout upon two conditions:
1. Volume is higher than volume ema. Input allows you to add markup so that you can check if volume > 10% more than EMA
2. Change from previous close or distance between open and close is greater than ATR Multiplier * ATR.
Breakout color is based on whether the value of previous close is higher or lower than present close.
I would love to have wick and border color changed too. But, looks like not possible :(
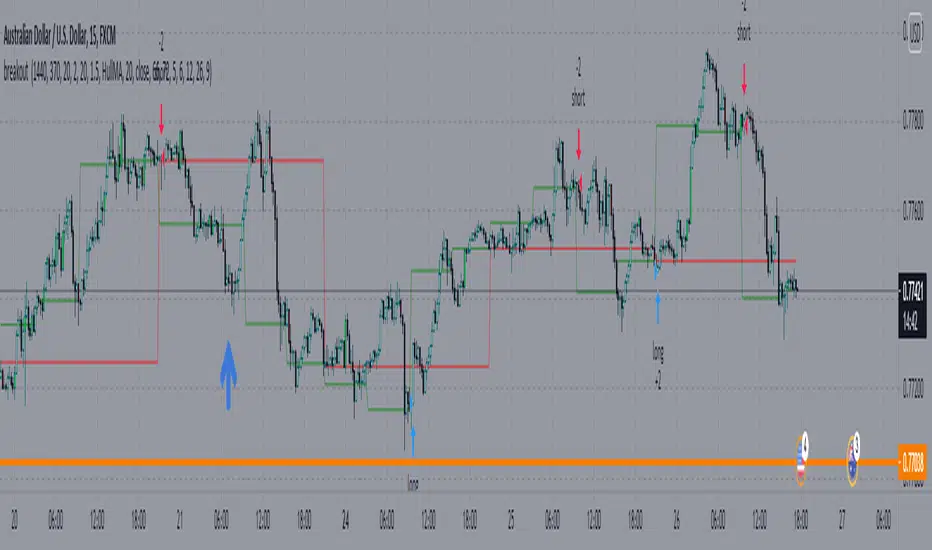
Breakout Identifier + Pivots with pos/neg/neu candlesBreakout Identifier is an indicator that displays breakouts which can be used to help a trader buy or sell. This is a volatility-based indicator that has customizable inputs. Each signal is also plotted with a pivot which can help to trade within a range or determine a trap.
To edit the gap between each signals change signal integer, goes by price.
BG colors are also assigned to candles as negative, positive, or neutral which are colored as follows:
Green = high > high of previous candle
Red = low < low of previous candle
Silver = neither of these options

Breakout Detector (Previous MTF High Low Levels) [LuxAlgo]The Breakout Detector (Previous MTF High Low Levels) indicator highlights breakouts of previous high/low levels from a higher timeframe.
The indicator is able to: display take-profit/stop-loss levels based on a user selected Win/Loss ratio, detect false breakouts, and display a dashboard with various useful statistics.
Do note that previous high/low levels are subject to backpainting, that is they are drawn retrospectively in their corresponding location. Other elements in the script are not subject to backpainting.
🔶 USAGE
Breakouts occur when the price closes above a previous Higher Timeframe (HTF) High or below a previous HTF Low.
On the advent of a breakout, the closing price acts as an entry level at which a Take Profit (TP) and Stop Loss (SL) are placed. When a TP or SL level is reached, the SL/TP box border is highlighted.
When there is a breakout in the opposite direction of an active breakout, previous breakout levels stop being updated. Not reaching an SL/TP level will result in a partial loss/win,
which will result in the box being highlighted with a dotted border (default). This can also be set as a dashed or solid border.
Detection of False Breakouts (default on) can be helpful to avoid false positives, these can also be indicative of potential trend reversals.
This indicator contains visualization when a new HTF interval begins (thick vertical grey line) and a dashboard for reviewing the breakout results (both defaults enabled; and can be disabled).
As seen in the example above, the active, open breakout is colored green/red.
You can enable the setting ' Cancel TP/SL at the end of HTF ', which will stop updating previous TP/SL levels on the occurrence of a new HTF interval.
🔶 DETAILS
🔹 Principles
Every time a new timeframe period starts, the previous high and low are detected of the higher timeframe. On that bar only there won't be a breakout detection.
A breakout is confirmed when the close price breaks the previous HTF high/low
A breakout in the same direction as the active breakout is ignored.
A breakout in the opposite direction stops previous breakout levels from being updated.
Take Profit/Stop Loss, partially or not, will be highlighted in an easily interpretable manner.
🔹 Set Higher Timeframe
There are 2 options for choosing a higher timeframe:
• Choose a specific higher timeframe (in this example, Weekly higher TF on a 4h chart)
• Choose a multiple of the current timeframe (in this example, 75 minutes TF on a 15 min chart - 15 x 5)
Do mind, that when using this option, non-standard TFs can give less desired timeframe changes.
🔹 Setting Win/Loss Levels
The Stop Loss (SL) / Take Profit (TP) setting has 2 options:
W%:L% : A fixed percentage is chosen, for TP and SL.
W:L : In this case L (Loss-part) is set through Loss Settings , W (Win-part) is calculated by multiplying L , for example W : L = 2 : 1, W will be twice as large as the L .
🔹 Loss Settings
The last drawing at the right is still active (colored green/red)
The Loss part can be:
A multiple of the Average True Range (ATR) of the last 200 bars.
A multiple of the Range Cumulative Mean (RCM).
The Latest Swing (with Length setting)
Range Cumulative Mean is the sum of the Candle Range (high - low) divided by its bar index.
🔹 False Breakouts
A False Breakout is confirmed when the price of the bar immediately after the breakout bar returns above/below the breakout level.
🔹 Dashboard
🔶 ALERTS
This publication provides several alerts
Bullish/Bearish Breakout: A new Breakout.
Bullish/Bearish False Breakout: False Breakout detected, 1 bar after the Breakout.
Bullish/Bearish TP: When the TP/profit level has been reached.
Bullish/Bearish Fail: When the SL/stop-loss level has been reached.
Note that when a new Breakout causes the previous Breakout to stop being updated, only an alert is provided of the new Breakout.
🔶 SETTINGS
🔹 Set Higher Timeframe
Option : HTF/Mult
HTF : When HTF is chosen as Option , set the Higher Timeframe (higher than current TF)
Mult : When Mult is chosen as Option , set the multiple of current TF (for example 3, curr. TF 15min -> 45min)
🔹 Set Win/Loss Level
SL/TP : W:L or W%:L%: Set the Win/Loss Ratio (Take Profit/Stop Loss)
• W : L : Set the Ratio of Win (TP) against Loss (SL) . The L level is set at Loss Settings
• W% : L% : Set a fixed percentage of breakout price as SL/TP
🔹 Loss Settings
When W : L is chosen as SL/TP Option, this sets the Loss part (L)
Base :
• RCM : Range Cumulative Mean
• ATR : Average True Range of last 200 bars
• Last Swing : Last Swing Low when bullish breakout, last Swing High when bearish breakout
Multiple : x times RCM/ATR
Swing Length : Sets the 'left' period ('right' period is always 1)
Colours : colour of TP/SL box and border
Borders : Style border when breakout levels stop being updated, but TP/SL is not reached. (Default dotted dot , other option is dashed dsh or solid sol )
🔹 Extra
Show Timeframe Change : Show a grey vertical line when a new Higher Timeframe interval begins
Detect False Outbreak
Cancel TP/SL at end of HTF
🔹 Show Dashboard
Location: Location of the dashboard (Top Right or Bottom Right/Left)
Size: Text size (Tiny, Small, Normal)
See USAGE/DETAILS for more information

Breakouts with timefilter [LuciTech]Here's the updated description with "colors" replaced by "colours" throughout, maintaining the original structure and content:
Breaking Point 2.0
This is a technical analysis overlay indicator designed to identify breakout levels based on pivot highs and lows, with a focus on price action during customizable time windows using London time (UK). It draws horizontal lines at pivot points and plots signals when price breaks above or below these levels, offering traders a tool to monitor potential bullish or bearish movements. The indicator includes options for time filtering and displaying only the most recent breakout.
Features
The Pivot Breakout Lines display horizontal lines at detected pivot highs (bullish) and pivot lows (bearish), coloured green and red by default. These lines extend from the pivot point to the breakout bar and can be set to show only the latest breakout.
The Breakout Signals mark bullish breakouts with an upward triangle below the bar and bearish breakouts with a downward triangle above the bar, using customizable colours.
The Time Filter restricts signals and lines to a specific window (default: 14:30–15:00 UK), which can be toggled on or off. A shaded background highlights this period when enabled.
How It Works
The indicator calculates pivot highs and lows using a user-defined lookback period (default: 5 bars). When price closes above a pivot high, it triggers a bullish signal and draws a line from the pivot to the breakout bar. When price closes below a pivot low, it triggers a bearish signal with a corresponding line.
If the time filter is active, signals and lines only appear within the specified window. Outside this period—or if the filter is disabled—they appear based solely on price action. The indicator maintains up to three recent pivots in memory, removing older ones as new pivots form.
Alerts are available for both bullish and bearish breakouts, triggered when signals occur.
Settings
Length controls the lookback period for pivot detection (default: 5).
Colours Bull/Bear sets the colours for bullish (default: green) and bearish (default: red) lines and signals.
Show Last Breakout toggles whether only the most recent breakout line and signal are displayed (default: false).
Time Filter enables or disables the time restriction (default: true).
Fill Background toggles a shaded area during the time window (default: true), with a customizable colour.
Time Settings define the start hour/minute and end hour/minute for the filter (default: 14:30–15:00).
Interpretation
The Pivot Breakout Lines highlight levels where price has previously reversed, potentially acting as support or resistance. A breakout above a pivot high may suggest bullish momentum, while a breakout below a pivot low may indicate bearish pressure.
The Breakout Signals provide visual cues for these events, useful for timing entries or exits. When "Show Last Breakout" is enabled, the chart focuses on the most recent signal, reducing clutter.
The Time Filter and background shading help traders concentrate on specific trading sessions, such as high-volatility periods. When disabled, the indicator tracks breakouts across all times.

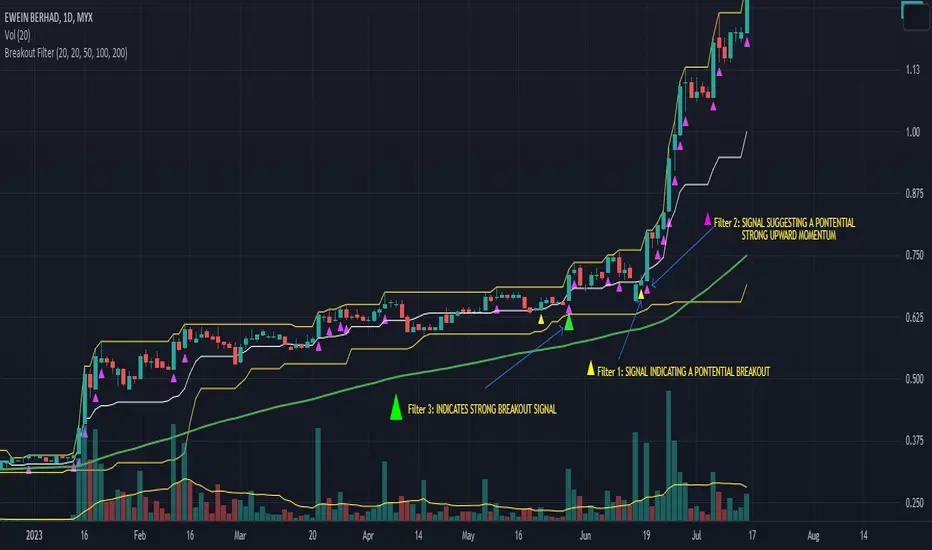
Breakout FilterIntroduction:
The Breakout Filter is a technical analysis indicator designed to identify potential breakout trading opportunities in the financial markets. It combines breakout conditions based on price and volume with the visualization of Exponential Moving Average (EMA) lines. This indicator can be a valuable tool for traders seeking to capture breakout movements while utilizing EMA lines for additional trend analysis.
Indicator Overview:
The Breakout Filter consists of three main filters: Filter 1, Filter 2, and Filter 3. Each filter has its own set of conditions that need to be met for a breakout signal to be generated. Additionally, the indicator plots EMA lines on the chart to provide further insights into the market trend.
Filter 1: Price & Volume Breakout (Default symbol: Tiny Yellow Triangle)
Filter 1 focuses on identifying breakouts based on both price and volume criteria. It considers the following conditions:
- Price Breakout: The close price crosses above the Donchian Channel's middle line, indicating a potential upward breakout.
- Volume Breakout: The trading volume exceeds the moving average of volume, suggesting increased market participation during the breakout.
When both the price breakout and volume breakout conditions are met, Filter 1 generates a signal indicating a potential breakout in the market. This filter helps traders identify significant price movements accompanied by higher trading volumes.
Filter 2: Upper Band Breakout
Filter 2 specifically looks for breakouts above the upper band of the Donchian Channel. This condition suggests a potential strong upward momentum in the market. When the high price exceeds the upper band, Filter 2 generates a signal, indicating a breakout above the recent price range.
Filter 3: Combined Filter 1 and Filter 2
Filter 3 combines the conditions of both Filter 1 and Filter 2. It requires that both Filter 1 and Filter 2 generate signals simultaneously. When this happens, it indicates a strong breakout signal with price and volume confirming the upward momentum.
EMA Lines:
The Breakout Filter with EMA Lines also includes the visualization of Exponential Moving Average (EMA) lines on the chart. EMA is a popular technical indicator used to identify the overall trend in the market. The indicator plots three EMA lines with different periods: EMA1, EMA2, and EMA3. Traders can choose the periods for each EMA line based on their preference and trading strategy.
The EMA lines can provide additional insights into the market trend and potential support or resistance levels. By observing the interaction between the price and the EMA lines, traders can gain a better understanding of the prevailing market sentiment and make informed trading decisions.
How to screen these filters using Trading View Screener
Insert column "DONCHIAN20 UP" and set to "EQUAL HIGH"
Conclusion:
The Breakout Filter with EMA Lines is a comprehensive indicator that combines breakout conditions based on price and volume with the visualization of EMA lines. It helps traders identify potential breakout trading opportunities while providing insights into the market trend. By using this indicator, traders can enhance their trading strategies and potentially improve their trading outcomes.
Please note that this write-up is for informational purposes only and should not be considered as financial advice. Traders should conduct their own analysis and exercise caution when making trading decisions.
Breakout FinderHelo All,
I got many requests for a Breakout script and here it's. This script searches the breakouts/breakdowns and draw square if there is one.
The options:
"Period" is used to find Pivot Points
"Max Breakout Length" is the maximum length to search breakouts
"Threshold Rate %" is channel width of the breakout area. calculated using highest/lowest of last 300 bars.
"Minimum Number of Tests" is the minimum number of tests that the Price tried to break the S/R level
and some options for coloring and linestyle
Lets see some examples:
in this example "Minimum Number of Tests" is 2 so the Price must have tested to break resistance area 2 times and then it breaks it as seen in the screenshot:
in following example Threshold rate is %10, so the channel width is very big:
as you can see in followinf screenshot you can choose different colors and line styles:
Alerts added ;)
Enjoy!

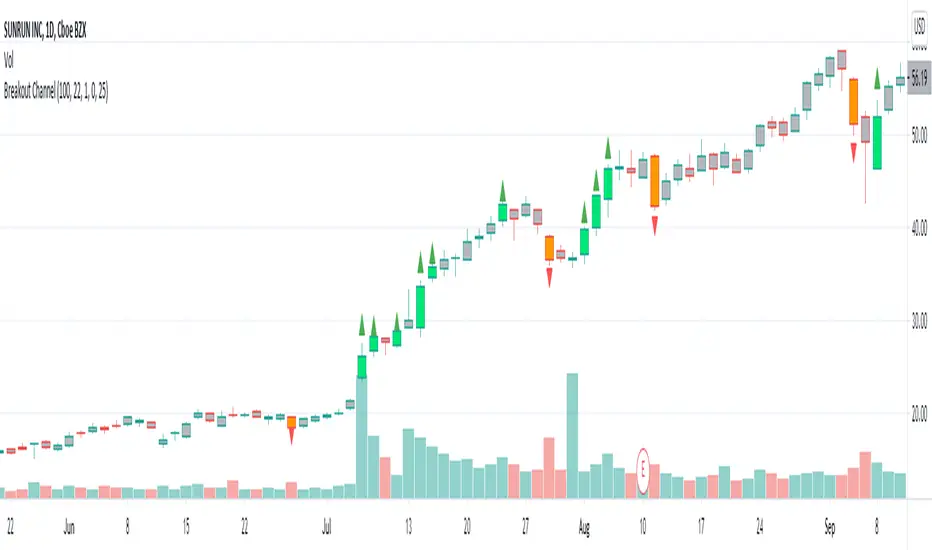
Breakout Trend Trading Strategy - V1Strategy in nutshell:
This strategy is made to be used in daily time-frames. Works better on trending instruments where volume is available. Hence, this is more suitable for trending shares rather than currencies, commodities and indexes where volume data is either not present or not reliable.
Breakout signifies the continuation of trend. Hence, trade in the direction of breakouts. Breakouts are calculated based on high volume and price movement in a day. This will be combined with few other conditions to generate buy and sell signals along with stop and compound targets. Supertrend is used for trend bias. Our buy and sell targets do not directly depend on the bias. But, entry criteria in opposite trend is made much difficult than that of trend direction. Further explanation of method and input parameters are explained below.
Backtesting parameters :
Capital and position sizing : Capital and position sizing parameters are set to test investing 2000 wholly on certain stock without compounding.
Initial Capital : 2000
Order Size : 100% of equity
Pyramiding : 1
ExitOnSignal : If unchecked exit is triggered solely on trailing stop
Trade Direction : Long, Short or All. Short condition is riskier than long conditions and often results in losses as per my observation. On most of the stocks trending up, strategy will not generate any short signals. This is achieved by comparing yearly high lows to previous two years to decide whether to allow short or long entries.
allowImmediateCompound : Applicable only if compounding/pyramiding is enabled in trade. If checked allows to place compounding orders immediately. If unchecked, it waits for stopline to cross order price before placing next compound.
Display Mode :
Targets : Whenever breakout happens, show marker for upTarget and downTarget
TargetChannel : Show up target and downtarget as a channel
Target With Stop : Along with targets, show also stop levels for breakouts
Up Channel : Channel created from UpTarget and respective stops
Down Channel : Channel created from DownTarget and respective stops
ShowTrailingStop : Shows trailing stop and compound lines when there is a trading position.
ShowTargetLevels : Shows Buy Sell target levels along with stop and compound lines. Trades are done as market orders. Hence, target levels are displayed after strategy makes the trade. Since only one order allowed per side without compounding, target, stop and compound levels are shown sometimes even without trade being made. These can be considered as entry levels if there is no existing position.
ShowPreviousLevels : Shows previous buy/sell target levels. When enabled, layout can look messy.
StopMultiplyer: To Set trailing stop loss.
BacktestYears: Number of years to include in backtest
So far my test cases are:
Positive : AAPL, AMZN, TSLA, RUN, VRT, ASX:APT
Negative Test Cases: WPL, WHC, NHC, WOW, COL, NAB (All ASX stocks)
Special test case: WDI
Negative test cases still show losses in backtesting. I have attempted including many conditions to eliminate or reduce the loss. But, further efforts has resulted in reduction in profits in positive cases as well. Still experimenting. Will update whenever I find improvements. Comments and suggestions welcome :)

Breakouts With Timefilter Strategy [LuciTech]This strategy captures breakout opportunities using pivot high/low breakouts while managing risk through dynamic stop-loss placement and position sizing. It includes a time filter to limit trades to specific sessions.
How It Works
A long trade is triggered when price closes above a pivot high, and a short trade when price closes below a pivot low.
Stop-loss can be set using ATR, prior candle high/low, or a fixed point value. Take-profit is based on a risk-reward multiplier.
Position size adjusts based on the percentage of equity risked.
Breakout signals are marked with triangles, and entry, stop-loss, and take-profit levels are plotted.
moving average filter: Bullish breakouts only trigger above the MA, bearish breakouts below.
The time filter shades the background during active trading hours.
Customization:
Adjustable pivot length for breakout sensitivity.
Risk settings: percentage risked, risk-reward ratio, and stop-loss type.
ATR settings: length, smoothing method (RMA, SMA, EMA, WMA).
Moving average filter (SMA, EMA, WMA, VWMA, HMA) to confirm breakouts.

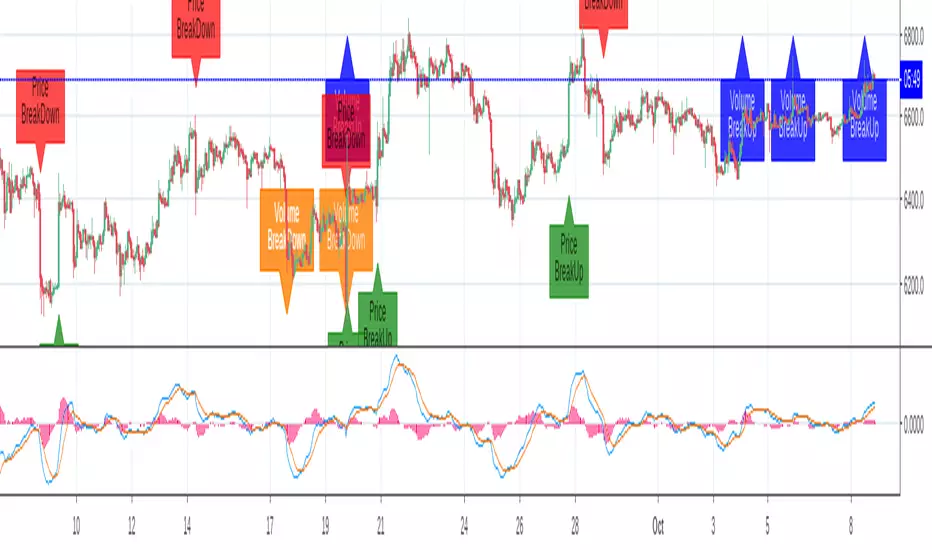
Breakout Labels and Alert For Price And VolumeThe indicator is developped for bitcoin and other cryptocurrencies, whose price and volume changes heavily within minutes. For the other Asset Classes, you may need to adjust the parameters.
Benefits:
1. Since a breakout of price or volume often means the start of a trend, this indicator alerts and displays a label when there is a breakout in price or volume.
2. The indicator prints labels on the chart, which helps people to study the relationship between a breakout and the trend.
3. The volume change is compared to a SMA of volume, instead of the last bar, which can reflect the change compared to a certain period.
4. You can set an alert for breakouts of both price and volume, instead of do it two times.
Settings:
SMA Length for volume: is the length to calculator volume SMA, default:108.
Toggle on/off to display or hide labels for price or volume breakout.
Customize the alert threshhold for price or volume breakout in different time period:3m,5m,15m,30m,60m and other
Use percentageGapForSlopeshape to adjust the relative position of labels.
Style - color settings: Orange for Volume Down, Blue for Volume Up, Red for Price Down, Green for Price Up.
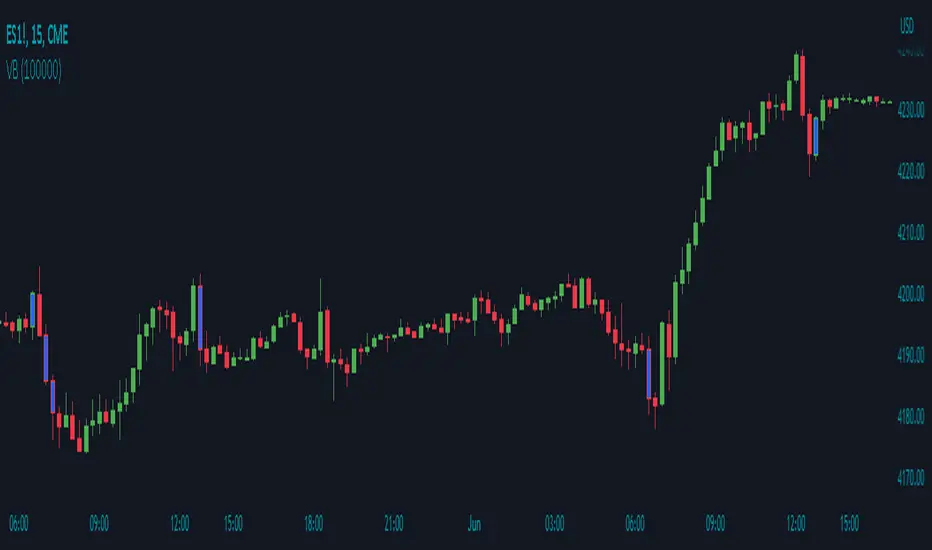
Volume Breakout by Chosen VolumeDescription:
The Volume Breakout indicator (VB) is a technical analysis tool that highlights candles with significant trading volume. It helps traders identify potential breakout periods characterized by high volume activity.
How it Works:
The Volume Breakout indicator compares the volume of each candle with a user-defined minimum volume threshold. If the volume of a candle exceeds or is equal to the specified minimum volume requirement, the indicator identifies it as a volume breakout and marks it accordingly.
Usage:
To effectively utilize the Volume Breakout indicator, follow these steps:
1. Apply the VB indicator to your chart by adding it from the available indicators.
2. Customize the minimum required volume parameter according to your trading preferences. This parameter determines the threshold volume level that a candle must meet or exceed to be considered a breakout candidate.
3. Observe the candles on the chart:
- Candles that meet or exceed the minimum required volume are highlighted with a specific color (yellow by default), indicating potential breakout periods.
4. Pay attention to the volume breakout indications within the candles, as they suggest periods of increased trading activity.
5. Analyze the price action accompanying the volume breakout candles. Breakouts often indicate a surge in buying or selling pressure, potentially leading to significant price moves or trend reversals.
6. Combine the analysis of volume breakout candles with other technical analysis tools, such as trend lines, support and resistance levels, or indicators, to confirm potential trade setups.
7. Implement appropriate risk management strategies, including setting stop-loss orders and position sizing, to manage your trades effectively and protect your capital.
Breakout and Retest Signals [AlgoAlpha]OVERVIEW
This script detects breakout and retest signals by identifying key pivot points in price action and analyzing their relationship with historical swing highs and lows. It highlights breakout structures using ATR-based tolerance levels and volume analysis to confirm potential trend continuations or reversals. The script marks significant price levels with dynamic boxes and dashed lines to help traders visualize breakout and retest areas effectively.
CONCEPTS
The script relies on pivot point analysis, a technique used to identify significant price levels where the market has previously reversed. It dynamically tracks a set number of recent swing highs and lows, allowing traders to see if the price is revisiting a previously significant level. The concept of breakouts and retests is widely used in technical analysis to determine potential entry points. A breakout occurs when the price moves beyond a resistance or support level, and a retest happens when the price returns to test that level before continuing in the breakout direction. This script enhances that analysis by incorporating ATR-based tolerance levels, ensuring that price zones are not too large.
FEATURES
Breakout and Retest Markings : Highlights breakout and retest areas with shaded boxes, allowing traders to visualize where price action is confirming key levels.
Volume Delta and Ratio : Analyzes volume at breakout levels to gauge the strength of the move, displaying volume delta information for additional context. The script also displays the ratio of selling to buying at the retest along traders to make better judgement on their entries.
Multi-Timeframe Adaptability : Dynamically adjusts volume analysis to align with the appropriate lower timeframe, ensuring reliable volume comparisons.
Alerts for Breakout and Retest Events : Traders can receive real-time notifications when bullish or bearish breakout retests are detected.
USAGE
This script is best suited for traders looking to identify strong breakout and retest setups across different timeframes. Users can customize the pivot detection period and swing point memory to adjust sensitivity based on their trading style. The ATR length and multiplier allow further refinement of breakout tolerance, reducing noise in volatile markets. The breakout zones are displayed as shaded boxes, where traders can assess whether a price retest is occurring under favorable conditions. Alerts can be set to notify traders of potential trade opportunities.

breakout crossover 4H 1DHi, this script is crossover between breakouts of 4H and Day timeframe. It also checks candlestick patterns before opening trades. Red horizontal line acts as support and resistance of Daily timeframe. You can close trades at next signal or at High/Low. Enjoy trading.
Breakout/Consolidation Filter [jwammo12]This indicator acts as a filter for determining recent breakouts and consolidations in price.
The first way to use the indicator is with a short lookback period. It then will paint yellow most of the time, with red marking a sharp recent breakdown in price and green marking a sharp breakout in price. This can be used to follow the breakout, or to fade it.
The second way to use the indicator is a long lookback period. This will change the output to be colored most of the time, with small sections of yellow. The yellow indicators areas where price has not made a large move in a while, or periods of consolidation. This can then be used to plan reversal trades, or follows any new trend.
The blue line is a Average True Range Percent Rank, when this value is high, it means that breakouts are less likely to trigger, since price has been moving rapidly recently, and a relative breakout would have to be a large move. When the line is low, breakouts will trigger more easily, since price has been moving relatively slowly

Breakouts with Tests & Retests [LuxAlgo]The Breakouts Tests & Retests indicator highlights tests and retests of levels constructed from detected swing points. A swing area of interest switches colors when a breakout occurs.
Users can control the sensitivity of the swing point detection and the width of the swing areas.
🔶 USAGE
When a Swing point is detected, an area of interest is drawn, colored green for a bullish swing and red when bearish.
A test is confirmed when the opening price is situated in the area of interest, and the closing price is above or below the area, depending on whether it is a bullish or bearish swing. Tests are highlighted with a solid-colored triangle.
A breakout is confirmed when the price closes in the opposite position, below or above the area, in which case the area will switch colors.
If the opening price is located within the area and the closing price closes outside the area, in the same direction as the breakout, this is considered a retest . Retests are highlighted with a hollow-colored triangle.
Note that tests/retests do not act on wicks. The main factor is that the opening price is in the area of interest, while the closing price is outside.
🔹 Area Of Interest Width
The user can adjust the width of the swing areas. Changing the " Width " is a fast and easy way to find different areas of interest.
A higher "Multiple" setting would return a wider area, allowing price to develop within it for a longer period of time and potentially provide later test signals.
When a swing area is broken, a higher "Width" setting can make it more complicated for the price to break it again, allowing a swing area to remain valid for a longer period of time thus potentially providing more retest signals.
🔶 DETAILS
Generally, only one bullish/bearish pattern can be active at a time. This means that no more than 1 bullish or bearish area will be active.
The " Display " settings, however, can help control how areas of different types are displayed.
Bullish AND Bearish: Both, bullish and bearish patterns can be drawn at the same time
Bullish OR Bearish: Only 1 bullish or 1 bearish pattern is drawn at a time
Bullish: Only bullish patterns
Bearish: Only bearish patterns
🔹 Test/Retest Labels
The user can adjust the settings so only the latest test/retest label is shown or set a minimum number of bars until the next test/retest can be drawn.
🔹 Maximum Bars
Users can set a limit of bars for when there is no test/retest in that period; the area of interest won't be updated anymore and will be available and ready for the next Swing.
An option for pulling the area back to the last retest is included.
🔶 SETTINGS
Display: Determines which swing areas are displayed by the indicator. See the "DETAILS" section for more information
Multiple: Adjusts the width of the areas of interest
Maximum Bars: Limit of bars for when there is no test/retest
Display Test/Retest Labels: Show all labels or just the last test/retest label associated with a swing area
Minimum Bars: Minimum bars required for a subsequent test/retest label are allowed to be displayed
Set Back To Last Retest: When after "Maximum Bars" no test/retest is found, place the right side of the area at the last test/retest
🔹 Swings
Left: x amount of wicks on the left of a potential Swing need to be higher/lower for a Swing to be confirmed.
Right: The number of wicks on the right of a potential swing needs to be higher/lower for a Swing to be confirmed.
🔹 Style
Bullish: color for test period (before a breakout) / retest period (after a breakout)
Bearish: color for test period (before a breakout) / retest period (after a breakout)
Label Size

Breakout Probability Indicator (FinnoVent)The Breakout Probability Indicator is a cutting-edge tool designed for traders looking to gauge the likelihood of price breakouts above or below current levels. This indicator intelligently combines Average True Range (ATR) and recent price action to provide a probabilistic insight into potential future price movements, enhancing strategy formulation and risk management.
Core Features:
Volatility Assessment: Utilizes the Average True Range (ATR) to measure market volatility, a critical component in identifying potential breakout scenarios.
Dynamic Price Levels: Calculates and plots potential breakout levels based on recent highs and lows, adjusted for current market volatility.
Probability Estimation: Provides an estimation of the probability of reaching these breakout levels, using a responsive logarithmic scale for improved sensitivity.
Real-time Updates: Continuously updates probabilities and levels as new price information becomes available, ensuring traders have the most current data at their fingertips.
Usage:
Add this indicator to any chart in TradingView to see the upper and lower breakout levels, each accompanied by a dynamically calculated probability percentage. These probabilities help traders understand the potential for price movement in either direction, forming a basis for entry or exit decisions, stop-loss placement, and strategy adjustments.
Compliance and Guidelines:
This script is shared for educational purposes, offering a novel approach to understanding market dynamics. It does not constitute financial advice and should be used as part of a comprehensive trading strategy. Traders are encouraged to backtest and paper-trade any new tool before live implementation to ensure it aligns with their trading style and risk tolerance.

Breakout/Breakdown Indicator (30 Min Range) by InvestYourAsset👉The indicator provided here is a technical analysis indicator for TradingView users that identifies potential breakout and breakdown opportunities on the initial 30-minute range in every trading session.
👉The indicator high and low of the initial 30-minute period and plotting them as horizontal lines on the chart. The high is marked in green line and the low is marked in red line.
📈The indicator then generates buy and sell signals based on whether the current close price crosses above or below the previous 30-minute high and low, respectively.
📢The indicator also has two inputs:
👉 sessionStartHour : The hour at which the trading session begins. The default value is 9, However users can change the time according to their own trading style.
👉 sessionStartMinute : The minute at which the trading session begins. The default value is 0.
These inputs can be used to adjust the indicator to the specific trading session that you are interested in.
✅How to use the Indicator:
👉To use the 30 Minute Breakout/Breakdown Indicator, simply add it to your chart and configure the inputs to your liking. Once the indicator is added to the chart, it will plot the 30-minute high and low as horizontal lines, as well as generate buy and sell signals based on the current close price.
✅Here is a step-by-step guide:
📈Open TradingView and select the chart that you want to add the indicator to.
📈Click on the "Indicators" tab and search for "30 Minute Breakout/Breakdown Indicator by InvestYourAsset".
📈Click on the indicator to add it to your chart.
📈Configure the inputs to your liking. The default values are typically fine, but you can experiment with different values to see what works best for you.
📈Once you are satisfied with the settings, click on the "Apply" button.
📈The indicator will now be displayed on your chart. You will see two horizontal lines representing the previous 30-minute high and low, as well as triangles representing buy and sell signals.
✅How to interpret the signals:
📈Buy signal : A buy signal is generated when the current close price crosses above the previous 30-minute high. This suggests that the price is likely to continue moving higher in the short term.
📈Sell signal : A sell signal is generated when the current close price crosses below the previous 30-minute low. This suggests that the price is likely to continue moving lower in the short term.
👉Traders should remember that the present indicator is just one tool that can be used to identify potential trading opportunities. It is important to use other technical analysis tools and risk management techniques to confirm your trading signals before entering any trades.
✅Things to consider while using the indicator:
📈Look for buy signals in an uptrend and sell signals in a downtrend. This will increase the likelihood of your trades being successful.
📈Place your stop losses below the previous 30-minute low for buy signals and above the previous 30-minute high for sell signals. This will help to limit your losses if the trade goes against you.
📈Consider taking profits at key resistance and support levels. This will help you to lock in your profits and avoid giving them back to the market.
Follow us for timely updates regarding indicators that we may publish in future and give it a like if you appreciate the indicator.

Breakout Trend Follower StrategyThis strategy goes long when highs are broken and uses a trailing stop that follows swing lows. User can configure a back test date range and choose whether or not to only take trades above a selected moving average.
The desire for me to make this script was to try to capture those extreme breakouts that can occur after a consolidation/equilibrium pattern. This catches those using stop-buys as the entry. Out of all the scripts I have made thus far, this one is the one that has the best results. Time frames might vary due to commission structures, etc. I currently use this strategy on stocks on the 30-min time frame and crypto (with Coinbase's high fees) on the 2-hr time frame.

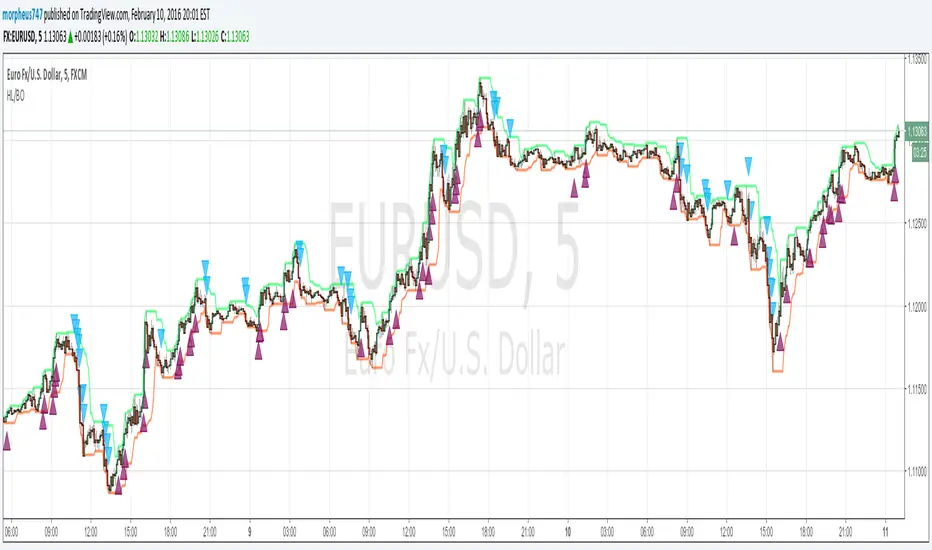
HL BREAKOUTThe base of the indicator is the breakout of historic High and lows.
There are 3 basic configurations
1° The High length that measure the latest 10 bars and make the "higher high"
2° The Low length taht measure the latest 10 bars and make the "lower low"
3° The Breakout PIPs administrator that defines how much pips are needed from the latest higher high to be defined as a level breakout.
So the strategy is super easy. The indicators show you the 10...20.. or whatever you need old bars high and lows.
When a breakout of that levels occurs and the candle "close" above or below and the close are more than "X" amount of PIPs a marker show up. The marker are the signals of buy and sell
I test some configurations, and work in all timeframes but.
I suggest
10, 10, 0.0003 for timeframes from 1m to 15m
and 10, 10, 0.0005 for timeframes higher than 15m
Maybe you need to test other configurations for 4h 1 day, etc the basics are the same in all timeframes, the main difference is the amount of pips that will be considered as "breakout" the higher timeframe the higher amount you need to prevent false positives.
Last words: 0.000X are for the PIPs for currencies that have 4 or 5 decimals like euro and other, if you use in YEN change it to a configuration of 2 digits decimal. Just that.
Have "fun" !
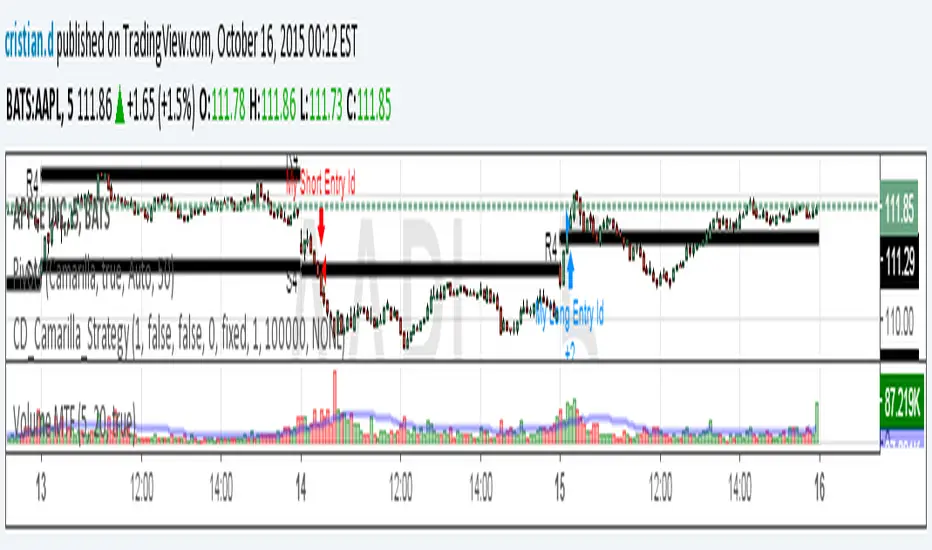
Camarilla Strategy - breakouts of H4 and L4Breakout strategy of H4 and L4 levels. Manual entries and exits - higher profits BUT because I am a novice in pinescript,
Can someone please:
1. Show me how to add exit strategy lines : close> ema(close,3) for exit short and opposite for long. I added myself but I can't make it to work in relation to camarilla entries; instead it shows all ema crossings..
2.Why some entries over/above my pivots are not shown.. Example:11.15 AM (short) and 13.10 PM (long) AAPL, October 15, today? Today would've been 3 signals, not one..
Thank you in advance for any advice. I am a strong Camarilla follower, but I am not a coder.
Breakout Scalper (Session)This is a twist on my on my Breakout Scalper strategy that limits trading to a user-configurable session
Find the original "Continuous" version of the scalper here:
The breakout scalper is based on "slow" and "fast" donchian periods. In this version, the "slow" donchian is in fact the Day's high/low. This important difference means that we will always be entering our trades at the day's high or low, so you are exposed to the price making new highs/lows but not to oscillations within the day's range.
Furthermore, the scalper is modified to only enter trades after the start of the user-configured session. Any open trades are closed at the end of the user-configured session. The default session is set to 10:00 AM to 3:30 PM because that's when I like to trade.

UCS_RSI BreakoutRSI Breakout indicator, typically used on longer time frame (under Mid CAP) to find the next explosive stock. Can be used on monthly chart with 36 Months breakout period. Weekly with 52 Weeks Breakout period, 100 Days on daily, for Swing trading.
List of All my Indicators - www.tradingview.com
GL.

Breakout Probability (Expo)█ Overview
Breakout Probability is a valuable indicator that calculates the probability of a new high or low and displays it as a level with its percentage. The probability of a new high and low is backtested, and the results are shown in a table— a simple way to understand the next candle's likelihood of a new high or low. In addition, the indicator displays an additional four levels above and under the candle with the probability of hitting these levels.
The indicator helps traders to understand the likelihood of the next candle's direction, which can be used to set your trading bias.
█ Calculations
The algorithm calculates all the green and red candles separately depending on whether the previous candle was red or green and assigns scores if one or more lines were reached. The algorithm then calculates how many candles reached those levels in history and displays it as a percentage value on each line.
█ Example
In this example, the previous candlestick was green; we can see that a new high has been hit 72.82% of the time and the low only 28.29%. In this case, a new high was made.
█ Settings
Percentage Step
The space between the levels can be adjusted with a percentage step. 1% means that each level is located 1% above/under the previous one.
Disable 0.00% values
If a level got a 0% likelihood of being hit, the level is not displayed as default. Enable the option if you want to see all levels regardless of their values.
Number of Lines
Set the number of levels you want to display.
Show Statistic Panel
Enable this option if you want to display the backtest statistics for that a new high or low is made. (Only if the first levels have been reached or not)
█ Any Alert function call
An alert is sent on candle open, and you can select what should be included in the alert. You can enable the following options:
Ticker ID
Bias
Probability percentage
The first level high and low price
█ How to use
This indicator is a perfect tool for anyone that wants to understand the probability of a breakout and the likelihood that set levels are hit.
The indicator can be used for setting a stop loss based on where the price is most likely not to reach.
The indicator can help traders to set their bias based on probability. For example, look at the daily or a higher timeframe to get your trading bias, then go to a lower timeframe and look for setups in that direction.
-----------------
Disclaimer
The information contained in my Scripts/Indicators/Ideas/Algos/Systems does not constitute financial advice or a solicitation to buy or sell any securities of any type. I will not accept liability for any loss or damage, including without limitation any loss of profit, which may arise directly or indirectly from the use of or reliance on such information.
All investments involve risk, and the past performance of a security, industry, sector, market, financial product, trading strategy, backtest, or individual's trading does not guarantee future results or returns. Investors are fully responsible for any investment decisions they make. Such decisions should be based solely on an evaluation of their financial circumstances, investment objectives, risk tolerance, and liquidity needs.
My Scripts/Indicators/Ideas/Algos/Systems are only for educational purposes!
