Cryptohopper OBVCryptohopper is an automated trading platform where you can automate your strategy based on technical indicators and candlestick patterns. OBV is one the indicators that you can automate with Cryptohopper.
How can you automate it? OBV gives a Buy signal when the OBV value crosses up its moving average (default: EMA) and a Sell signal when it crosses down its moving average.
If you include volume analyses in your trading strategy, automating OBV will give buy signals whenever volume and price are rising altogether.
Start automating your trading in Cryptohopper.com
--CRYPTOHOPPER--
Search in scripts for "crypto"


Crypto Open InterestPlots a crypto's open interest on Binance.
You can choose to see OI as asset-denominated (e.g. 1000 BTC), USD-denominated, or both.
How I usually interpret OI:
Price up, OI up = longs opened = bullish
Price up, OI down = shorts closed = bullish on HTF, or counter-trade on LTF
Price down, OI up = shorted opened = bearish
Price down, OI down = longs closed = bearish on HTF, or counter-trade on LTF
I find the indicator useful on 1-minute charts to identify liquidations and compare perp v.s. spot patterns.

Crypto Multi Exchange Volume (CMEV)Crypto Multi Exchange Volume (CMEV) aggregates and plots trading volumes for supported cryptoasset pairs over multiple different cryptoasset exchanges. For developers looking for more information and for those who want to compile their own version of CMEV, please check out my GitHub (jakobpredin/crypto-multi-exchange-volume).
Configuration
CMEV comes with two configurable settings - whether base volume or quote volume is plotted and the length of the volume's EMA. By default, the base volume is used for plotting and the length of the EMA is set to 12 periods.
Use cases
The indicator was primarily developed in order to be able to chart using the trading pair with the longest available trading history. Due to the fast-changing preferences of where cryptoassets are traded, volumes tend to be very inconsistent and can give a distorted picture of a pairs history. For illustration, check out the SC-BTC pair from Poloniex using their native volume and compare it to the CMEV volume.
The other use case is to be able to spot divergences in volume. A great example here is bitcoin's 2019 rally where volumes from derivatives exchanges are at all time highs but volumes from retail/spot exchanges are not.
Supported exchanges
CMEV currently supports asset pairs from the following exchanges:
Binance
Bitfinex
Bitstamp
Bittrex
Coinbase
Gemini
Kraken
Poloniex
Limitations
Because of the fact that CMEV is pulling data from from multiple different exchanges and is computationally intensive it can take a couple of seconds to load while charting certain cryptoasset pairs.
Additionally, due to Tradingview's various limitations only a certain number of pairs can be supported at a time. By default, only pairs with a BTC or USD quote are supported and many non-unique pairs with consistently low trading volumes have been removed. For a full explanation, please refer to the docs in my GitHub (jakobpredin/crypto-multi-exchange-volume).
Future of the project
I plan on supporting pairs from more exchanges in the future as I see fit and as they become available for charting on Tradingview. Further, I may develop a strategy script using CMEV as its core indicator.
I welcome everybody from the community to help me extend the functionality of CMEV in order to make investing in cryptoassets more transparent for everybody.

Crypto Investidor EMA e MA Crypto Investidor EMA e MA consiste em um conjunto de 4 EMAs de 21 / 50 / 100 / 200 períodos e também 4 MAs de 21 / 50 / 100 / 200, criado para facilitar o entendimento dos nossos seguidores, a ponto de poder verificar no gráfico tanto as Medias Móveis Exponenciais, quanto as Medias Móveis Simples. Um excelente indicador para quem utiliza o tradingview free.

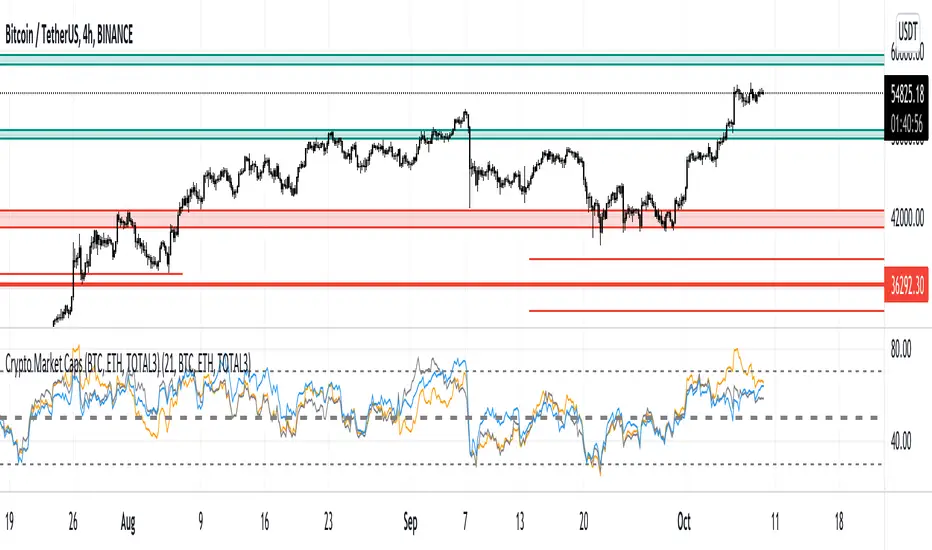
Crypto Market Caps (BTC, ETH, TOTAL3)RSI based Crypto Market Caps (BTC, ETH, TOTAL3) Oscillator
This oscillator displays market caps for:
BTC : CRYPTOCAP:BTC -> in orange
ETH : CRYPTOCAP:ETH -> in gray
ALT (Total crypto excl. BTC & ETH): CRYPTOCAP:TOTAL3 -> in blue
In the settings you can edit:
The 3 market cap symbols
RSI length
All colours ;-)
Hope you enjoy!
Crypto Market Cap Momentum Analyzer (AiBitcoinTrend)The Crypto Market Cap Momentum Analyzer (AiBitcoinTrend) is a robust tool designed to uncover trading opportunities by blending market cap analysis and momentum dynamics. Inspired by research-backed quantitative strategies, this indicator helps traders identify trend-following and mean-reversion setups in the cryptocurrency market by evaluating recent performance and market cap size.
This indicator classifies cryptocurrencies into market cap quintiles and ranks them based on their 2-week momentum. It then suggests potential trades—whether to go long, anticipate reversals, or simply hold—based on the crypto's market cap group and momentum trends.
👽 How the Indicator Works
👾 Market Cap Classification
The indicator categorizes cryptocurrencies into one of five market cap groups based on user-defined inputs:
Large Cap: Highest market cap tier
Upper Mid Cap: Second highest group
Mid Cap: Middle-tier market caps
Lower Mid Cap: Slightly below the mid-tier
Small Cap: Lowest market cap tier
This classification dynamically adjusts based on the provided market cap data, ensuring that you’re always working with a representative market structure.
👾 Momentum Calculation
By default, the indicator uses a 2-week momentum measure (e.g., a 14-day lookback when set to daily). It compares a cryptocurrency’s current price to its price 14 bars ago, thereby quantifying its short-term performance. Users can adjust the momentum period and rebalance period to capture shorter or longer-term trends depending on their trading style.
👾 Dynamic Ranking and Trade Suggestions
After assigning cryptos to size quintiles, the indicator sorts them by their momentum within each quintile. This two-step process results in:
Long Trade: For smaller market cap groups (Small, Lower Mid, Mid Cap) that have low (bottom-quintile) momentum, anticipating a trend continuation or breakout.
Reversal Trade: For the largest market cap group (Large Cap) that shows low momentum, expecting a mean-reversion back to equilibrium.
Hold: In scenarios where the coin’s momentum doesn’t present a strong contrarian or trend-following signal.
👽 Applications
👾 Trend-Following in Smaller Caps: Identify small or mid-cap cryptos with low momentum that might be poised for a breakout or sustained trend.
👾 Mean-Reversion in Large Caps: Pinpoint large-cap cryptocurrencies experiencing a temporary lull in performance, potentially ripe for a rebound.
👽 Why It Works in Crypto
The cryptocurrency market is heavily driven by retail investor sentiment and volatility. Research shows that:
Small-Cap Cryptos: Tend to experience higher volatility and speculative trends, making them ideal for momentum trades.
Large-Cap Cryptos: Exhibit more predictable behavior, making them suitable for mean-reversion strategies when momentum is low.
This indicator captures these dynamics to give traders a strategic edge in identifying both momentum and reversal opportunities.
👽 Indicator Settings
👾 Rebalance Period: The frequency at which momentum and trade suggestions are recalculated (Daily, Weekly, Monthly).
Shorter Periods (Daily): Fast updates, suitable for short-term trades, but more noise.
Longer Periods (Weekly/Monthly): Smoother signals, ideal for swing trading and more stable trends.
👾 Momentum Period: The lookback period for momentum calculation (default is 14 bars).
Shorter Periods: More responsive but prone to noise.
Longer Periods : Reflects broader trends, reducing sensitivity to short-term fluctuations.
Disclaimer: This information is for entertainment purposes only and does not constitute financial advice. Please consult with a qualified financial advisor before making any investment decisions.

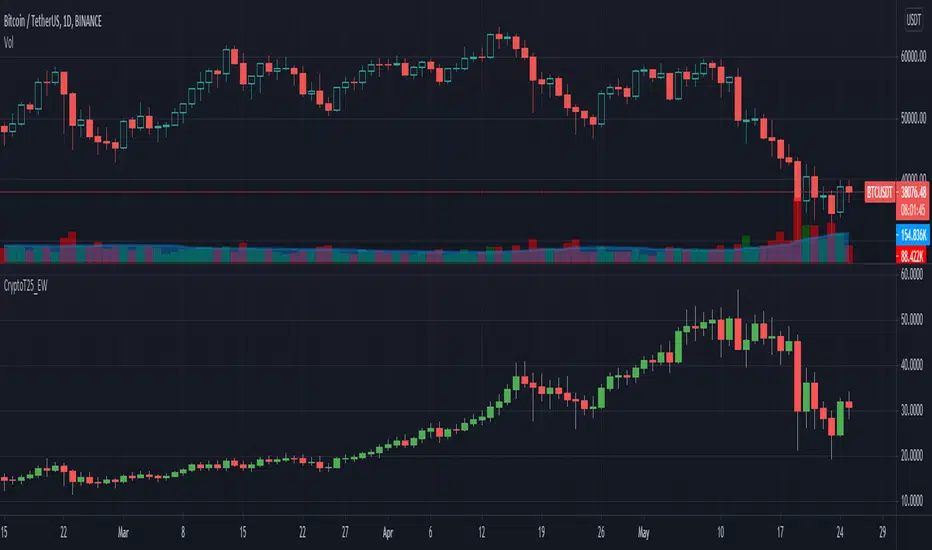
Crypto Top 25 Equal Weight IndexDraws an Equally Weighted Index of 25 securities. The inputs are pre-populated with the Top 25 cryptocurrencies by market cap at the time of publishing the script, but any 25 securities can be used.
Double click on this indicator's pane to view in full screen.
Note: Candle open is always equal to previous candle's close. I did this to avoid problems where sometimes candle open didn't make sense compared to close.
If you're into cryptocurrencies also have a look at these TradingView charts CRYPTOCAP:TOTAL, CRYPTOCAP:TOTAL2 and CRYPTOCAP:OTHERS.
Crypto Correlation MatrixA crypto correlation matrix or table is a tool that displays the correlation between different cryptocurrencies and other financial assets. The matrix provides an overview of the degree to which various cryptocurrencies move in tandem or independently of each other. Each cell represents the correlation between the row and column assets respectively.
The correlation matrix can be useful for traders and investors in several ways:
First, it allows them to identify trends and patterns in the behavior of different cryptocurrencies. By looking at the correlations between different assets, traders can gain insight into the intra-relationships of the crypto market and make more informed trading decisions. For example, if two cryptocurrencies have a high positive correlation, meaning that they tend to move in the same direction, a trader may want to diversify their portfolio by choosing to invest in only one of the two assets.
Additionally, the correlation matrix can help traders and investors to manage risk. By analyzing the correlations between different assets, traders can identify opportunities to hedge their positions or limit their exposure to particular risks. For example, if a trader holds a portfolio of cryptocurrencies that are highly correlated with each other, they may be at greater risk of losses if the market moves against them. By diversifying their portfolio with assets that are less correlated with each other, they can reduce their overall risk.
Some of the unique properties for this specific script are the correlation strength levels in conjunction with the color gradient of cells, intended for clearer readability.
Features:
Supports up to 64 different crypto assets.
Dark/Light mode.
Correlation strength levels and cell coloring.
Adjustable positioning on the chart.
Alerts at the close of a bar. (Daily timeframe or higher recommended)

Cryptocurrency SentimentOverview
This script focuses on calculating and visualizing the sentiment difference between LONG positions and SHORT positions for a selected cryptocurrency pair on the Bitfinex exchange. It provides a clean and clear visual representation of the sentiment, helping traders analyze market behavior.
Key Features
Dynamic Symbol Selection:
The script automatically detects the cryptocurrency symbol from the chart (syminfo.basecurrency) and dynamically constructs the LONGS and SHORTS ticker symbols.
Works seamlessly for pairs like BTCUSD, ETHUSD, and others available on Bitfinex.
Sentiment Calculation:
The sentiment difference is calculated as:
Sentiment Difference=−1×(100− SHORTS/LONGS ×100)
LONGS : The total number of long positions.
SHORTS : The total number of short positions.
If SHORTS is 0, the value is safely skipped to avoid division errors.
Color Coding:
The script visually highlights the sentiment difference:
Green Line: Indicates that LONG positions are dominant (bullish sentiment).
Red Line: Indicates that SHORT positions are dominant (bearish sentiment).
Zero Reference Line:
A gray horizontal line at 0 helps users quickly identify the transition between bullish (above zero) and bearish (below zero) sentiment.
How It Works
Fetching Data:
The script uses request.security to fetch LONGS and SHORTS data at the current chart timeframe (timeframe.period) for the dynamically generated Bitfinex tickers.
Handling Data:
Missing or invalid data (NaN) is filtered out to prevent errors.
Extreme spikes or irregular values are safely avoided.
Visualization:
The sentiment difference is plotted with dynamic color coding:
Green when LONGS > SHORTS (bullish sentiment).
Red when SHORTS > LONGS (bearish sentiment).
Benefits
Market Sentiment Insight: Helps traders quickly identify if the market is leaning towards bullish or bearish sentiment based on actual LONG and SHORT position data.
Dynamic and Adaptive: Automatically adjusts to the selected cryptocurrency symbol on the chart.
Clean Visualization: Focuses solely on sentiment difference with color-coded signals, making it easy to interpret.
Best Use Cases
Trend Confirmation: Use the sentiment difference to confirm trends during bullish or bearish moves.
Market Reversals: Identify potential reversals when sentiment shifts from positive (green) to negative (red) or vice versa.
Sentiment Monitoring: Monitor the overall market bias for cryptocurrencies like BTC, ETH, XRP, etc., in real-time.
Sample Chart Output
Above Zero → Green Line: Bullish sentiment dominates.
Below Zero → Red Line: Bearish sentiment dominates.
Zero Line → Transition point for shifts in sentiment.

Crypto Liquidation Heatmap [LuxAlgo]The Crypto Liquidation Heatmap tool offers real-time insights into the liquidations of the top cryptocurrencies by market capitalization, presenting the current state of the market in a visually accessible format. Assets are sorted in descending order, with those experiencing the highest liquidation values placed at the top of the heatmap.
Additional details, such as the breakdown of long and short liquidation values and the current price of each asset, can be accessed by hovering over individual boxes.
🔶 USAGE
The crypto liquidation heatmap tool provides real-time insights into liquidations across all timeframes for the top 29 cryptocurrencies by market capitalization. The assets are visually represented in descending order, prioritizing assets with the highest liquidation values at the top of the heatmap.
Different colors are used to indicate whether long or short liquidations are dominant for each asset. Green boxes indicate that long liquidations surpass short liquidations, while red boxes indicate the opposite, with short liquidations exceeding long liquidations.
Hovering over each box provides additional details, such as the current price of the asset, the breakdown of long and short liquidation values, and the duration for the calculated liquidation values.
🔶 DETAILS
🔹Crypto Liquidation
Crypto liquidation refers to the process of forcibly closing a trader's positions in the cryptocurrency market. It occurs when a trader's margin account can no longer support their open positions due to significant losses or a lack of sufficient margin to meet the maintenance requirements. Liquidations can be categorized as either a long liquidation or a short liquidation.
A long liquidation occurs when long positions are being liquidated, typically due to a sudden drop in the price of the asset being traded. Traders who were bullish on the asset and had opened long positions will face losses as the market moves against them.
On the other hand, a short liquidation occurs when short positions are being liquidated, often triggered by a sudden spike in the price of the asset. Traders who were bearish on the asset and had opened short positions will face losses as the market moves against them.
🔹Liquidation Data
It's worth noting that liquidation data is not readily available on TradingView. However, we recognize the close correlation between liquidation data, trading volumes, and asset price movements. Therefore, this script analyzes accessible data sources, extracts necessary information, and offers an educated estimation of liquidation data. It's important to emphasize that the presented data doesn't reflect precise quantitative values of liquidations. Traders and analysts should instead focus on observing changes over time and identifying correlations between liquidation data and price movements.
🔶 SETTINGS
🔹Cryptocurrency Asset List
It is highly recommended to select instruments from the same exchange with the same currency to maintain proportional integrity among the chosen assets, as different exchanges may have varying trading volumes.
Supported currencies include USD, USDT, USDC, USDP, and USDD. Remember to use the same currency when selecting assets.
List of Crypto Assets: The default options feature the top 29 cryptocurrencies by market capitalization, currently listed on the Binance Exchange. Please note that only crypto assets are supported; any other asset type will not be processed or displayed. To maximize the utility of this tool, it is crucial to heed the warning message displayed above.
🔹Liquidation Heatmap Settings
Position: Specifies the placement of the liquidation heatmap on the chart.
Size: Determines the size of the liquidation heatmap displayed on the chart.
🔶 RELATED SCRIPTS
Liquidations-Meter
Liquidation-Estimates
Liquidation-Levels

Crypto MVRV ZScore - Strategy [PresentTrading]█ Introduction and How it is Different
The "Crypto Valuation Extremes: MVRV ZScore - Strategy " represents a cutting-edge approach to cryptocurrency trading, leveraging the Market Value to Realized Value (MVRV) Z-Score. This metric is pivotal for identifying overvalued or undervalued conditions in the crypto market, particularly Bitcoin. It assesses the current market valuation against the realized capitalization, providing insights that are not apparent through conventional analysis.
BTCUSD 6h Long/Short Performance
Local
█ Strategy, How It Works: Detailed Explanation
The strategy leverages the Market Value to Realized Value (MVRV) Z-Score, specifically designed for cryptocurrencies, with a focus on Bitcoin. This metric is crucial for determining whether Bitcoin is currently undervalued or overvalued compared to its historical 'realized' price. Below is an in-depth explanation of the strategy's components and calculations.
🔶Conceptual Foundation
- Market Capitalization (MC): This represents the total dollar market value of Bitcoin's circulating supply. It is calculated as the current price of Bitcoin multiplied by the number of coins in circulation.
- Realized Capitalization (RC): Unlike MC, which values all coins at the current market price, RC is computed by valuing each coin at the price it was last moved or traded. Essentially, it is a summation of the value of all bitcoins, priced at the time they were last transacted.
- MVRV Ratio: This ratio is derived by dividing the Market Capitalization by the Realized Capitalization (The ratio of MC to RC (MVRV Ratio = MC / RC)). A ratio greater than 1 indicates that the current price is higher than the average price at which all bitcoins were purchased, suggesting potential overvaluation. Conversely, a ratio below 1 suggests undervaluation.
🔶 MVRV Z-Score Calculation
The Z-Score is a statistical measure that indicates the number of standard deviations an element is from the mean. For this strategy, the MVRV Z-Score is calculated as follows:
MVRV Z-Score = (MC - RC) / Standard Deviation of (MC - RC)
This formula quantifies Bitcoin's deviation from its 'normal' valuation range, offering insights into market sentiment and potential price reversals.
🔶 Spread Z-Score for Trading Signals
The strategy refines this approach by calculating a 'spread Z-Score', which adjusts the MVRV Z-Score over a specific period (default: 252 days). This is done to smooth out short-term market volatility and focus on longer-term valuation trends. The spread Z-Score is calculated as follows:
Spread Z-Score = (Market Z-Score - MVVR Ratio - SMA of Spread) / Standard Deviation of Spread
Where:
- SMA of Spread is the simple moving average of the spread over the specified period.
- Spread refers to the difference between the Market Z-Score and the MVRV Ratio.
🔶 Trading Signals
- Long Entry Condition: A long (buy) signal is generated when the spread Z-Score crosses above the long entry threshold, indicating that Bitcoin is potentially undervalued.
- Short Entry Condition: A short (sell) signal is triggered when the spread Z-Score falls below the short entry threshold, suggesting overvaluation.
These conditions are based on the premise that extreme deviations from the mean (as indicated by the Z-Score) are likely to revert to the mean over time, presenting opportunities for strategic entry and exit points.
█ Practical Application
Traders use these signals to make informed decisions about opening or closing positions in the Bitcoin market. By quantifying market valuation extremes, the strategy aims to capitalize on the cyclical nature of price movements, identifying high-probability entry and exit points based on historical valuation norms.
█ Trade Direction
A unique feature of this strategy is its configurable trade direction. Users can specify their preference for engaging in long positions, short positions, or both. This flexibility allows traders to tailor the strategy according to their risk tolerance, market outlook, or trading style, making it adaptable to various market conditions and trader objectives.
█ Usage
To implement this strategy, traders should first adjust the input parameters to align with their trading preferences and risk management practices. These parameters include the trade direction, Z-Score calculation period, and the thresholds for long and short entries. Once configured, the strategy automatically generates trading signals based on the calculated spread Z-Score, providing clear indications for potential entry and exit points.
It is advisable for traders to backtest the strategy under different market conditions to validate its effectiveness and adjust the settings as necessary. Continuous monitoring and adjustment are crucial, as market dynamics evolve over time.
█ Default Settings
- Trade Direction: Both (Allows for both long and short positions)
- Z-Score Calculation Period: 252 days (Approximately one trading year, capturing a comprehensive market cycle)
- Long Entry Threshold: 0.382 (Indicative of moderate undervaluation)
- Short Entry Threshold: -0.382 (Signifies moderate overvaluation)
These default settings are designed to balance sensitivity to market valuation extremes with a pragmatic approach to trade execution. They aim to filter out noise and focus on significant market movements, providing a solid foundation for both new and experienced traders looking to exploit the unique insights offered by the MVRV Z-Score in the cryptocurrency market.

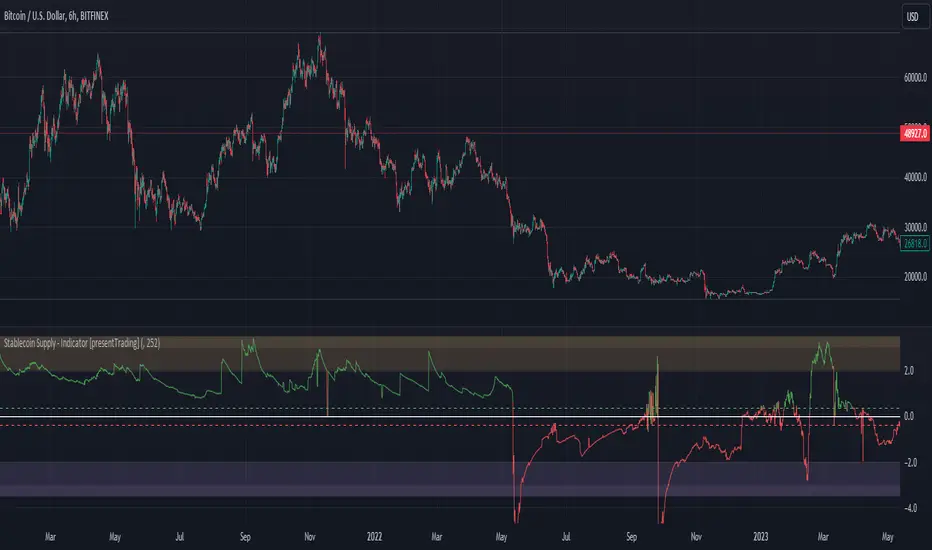
Crypto Stablecoin Supply - Indicator [presentTrading]█ Introduction and How it is Different
The "Stablecoin Supply - Indicator" differentiates itself by focusing on the aggregate supply of major stablecoins—USDT, USDC, and DAI—rather than traditional price-based metrics. Its premise is that fluctuations in the total supply of these stablecoins can serve as leading indicators for broader market movements, offering traders a unique vantage point to anticipate shifts in market sentiment.
BTCUSD 6h for recent bull market
BTCUSD 8h
█ Strategy, How it Works: Detailed Explanation
🔶 Data Collection
The strategy begins with the collection of the closing supply for USDT, USDC, and DAI stablecoins. This data is fetched using a specified timeframe (**`tfInput`**), allowing for flexibility in analysis periods.
🔶 Supply Calculation
The individual supplies of USDT, USDC, and DAI are then aggregated to determine the total stablecoin supply within the market at any given time. This combined figure serves as the foundation for the subsequent statistical analysis.
🔶 Z-Score Computation
The heart of the indicator's strategy lies in the computation of the Z-Score, which is a statistical measure used to identify how far a data point is from the mean, relative to the standard deviation. The formula for the Z-Score is:
Z = (X - μ) / σ
Where:
- Z is the Z-Score
- X is the current total stablecoin supply (TotalStablecoinClose)
- μ (mu) is the mean of the total stablecoin supply over a specified length (len)
- σ (sigma) is the standard deviation of the total stablecoin supply over the same length
A moving average of the Z-Score (**`zScore_ma`**) is calculated over a short period (defaulted to 3) to smooth out the volatility and provide a clearer signal.
🔶 Signal Interpretation
The Z-Score itself is plotted, with its color indicating its relation to a defined threshold (0.382), serving as a direct visual cue for market sentiment. Zones are also highlighted to show when the Z-Score is within certain extreme ranges, suggesting overbought or oversold conditions.
Bull -> Bear
█ Trade Direction
- **Entry Threshold**: A Z-Score crossing above 0.382 suggests an increase in stablecoin supply relative to its historical average, potentially indicating bullish market sentiment or incoming capital flow into cryptocurrencies.
- **Exit Threshold**: Conversely, a Z-Score dropping below -0.382 may signal a reduction in stablecoin supply, hinting at bearish sentiment or capital withdrawal.
█ Usage
Traders can leverage the "Stablecoin Supply - Indicator" to gain insights into the underlying market dynamics that are not immediately apparent through price analysis alone. It is particularly useful for identifying potential shifts in market sentiment before they are reflected in price movements. By integrating this indicator with other technical analysis tools, traders can develop a more rounded and informed trading strategy.
█ Default Settings
- Timeframe Input (`tfInput`): Allows users to specify the timeframe for data collection, adding flexibility to the analysis.
- Z-Score Length (`len`): Set to 252 by default, representing the period over which the mean and standard deviation of the stablecoin supply are calculated.
- Color Coding: Uses distinct colors (green for bullish, red for bearish) to indicate the Z-Score's position relative to its thresholds, enhancing visual clarity.
- Extreme Range Fill: Highlights areas between defined high and low Z-Score thresholds with distinct colors to indicate potential overbought or oversold conditions.
By integrating considerations of stablecoin supply into the analytical framework, the "Stablecoin Supply - Indicator" offers a novel perspective on cryptocurrency market dynamics, enabling traders to make more nuanced and informed decisions.
Crypto Terminal [Kioseff Trading]Hello!
Introducing Crypto Terminal (:
The indicator makes use of cryptocurrency data provided by vendor INTOTHEBLOCK.
NOTE: The cryptocurrency on your chart must be paired with USD or USDT. Data won't load otherwise - possibly transient. For instance, BTCUSD or BTCUSDT, ETHUSD or ETHUSDT.
Provided datasets:
Twitter Sentiment Data
Telegram Sentiment Data
Whale Data (i.e. % of Asset Belonging to Whales)
$100,000+ Transactions
Bulls/Bears (Bulls Buying | Bears Selling)
Current Position PnL (Currently Open Positions for the Coin are Retrieved and Plotted. Data is Split into Currently Profitable Positions, Losing Positions, and B/E Positions)
Average Balance
Holders/Traders Percentage (Addresses are Retrieved and Classified as Holding Accounts or Trader Accounts)
Correlation
Futures OI
Perpetual OI
Zero Balance Addresses
Flow (Money Inflow & Outflow)
Active Addresses
Average Transaction Time
Realized PnL (Addresses with Realized Profits, Realized Losses, and B/E)
Cruisers
A few more data points are provided.
Additionally, you can plot the values of any dataset in a pane below price.
Below are images of plottable data; different cryptocurrencies will be shown for each example (:
Twitter sentiment data.
Assess this data lightly; difficult to confirm accuracy.
Telegram sentiment data.
Assess this data lightly; difficult to confirm accuracy.
Percentage of asset belonging to whales.
$100,000+ transactions (volume oriented)
Bulls buying; bears selling.
Current positions at profit; current positions at loss; current positions at breakeven.
Average balance.
Percentage of asset belonging to traders; percentage of asset belonging to holders.
Asset's 30-interval correlation to BTC.
Perpetual open interest.
Zero-balance addresses.
Flows.
Active addresses.
Average transaction time.
Addresses at realized profit; addresses at realized loss; addresses at breakeven.
Cruiser data.
Futures open interest.
Naturally, this data isn't provided for every cryptocurrency; NaN values are returned in some instances.
Table 1
I provided three data tables, which load independently, so you don't have to change plotted data to access values.
Table 2
Lastly, you can create a 10-asset crypto index and run calculations against it.
The image shows an example.
I'll update this script with additional calculations/data in the near future. If you've any suggestions - please let me know!
Enjoy (:

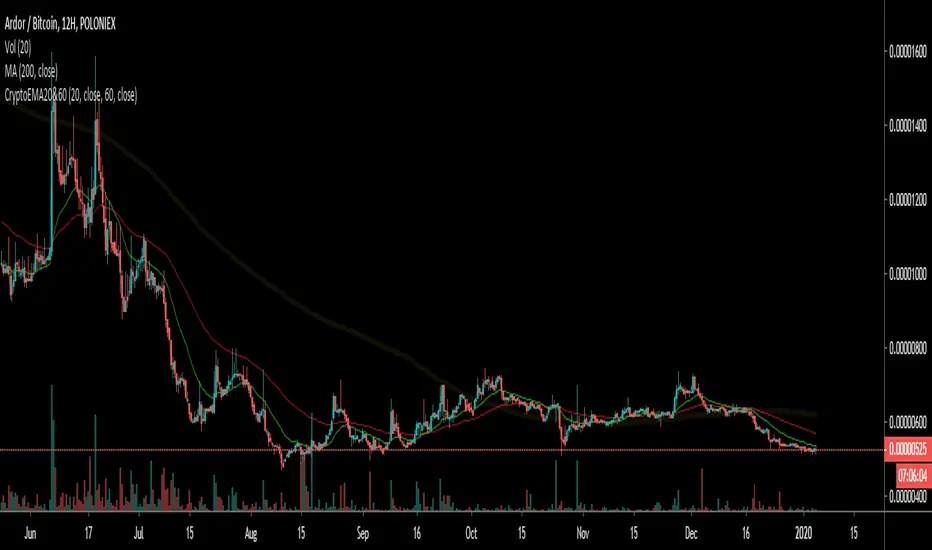
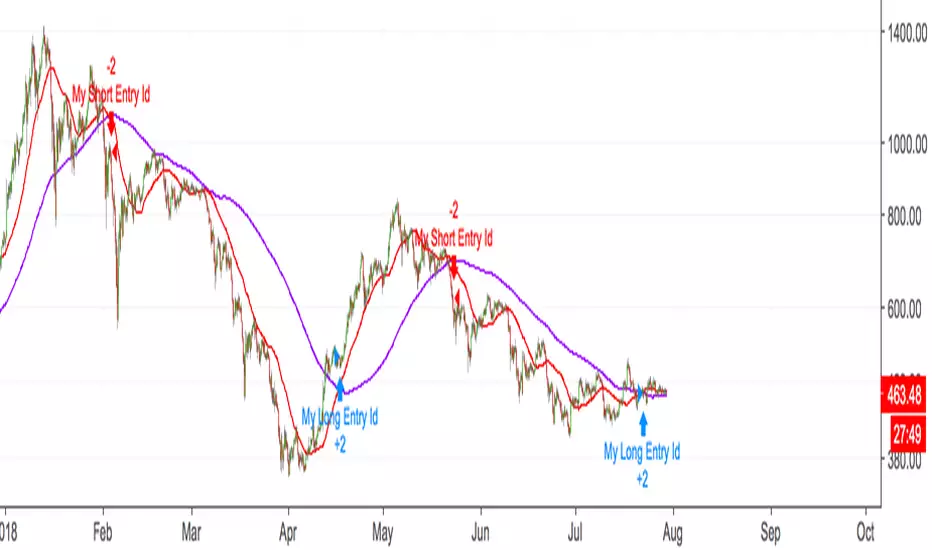
Crypto EMA 60/20Intended for use with Cryptocurrency Markets on the 12 hour time frame, the 60/20 exponential moving average frequency has proven successful for identifying trend bottom formations and for verifying head and shoulders top formations.
Combine the Crypto EMA 60/20 with classical RSI and MACD divergences to help verify impending reversals.
Useful for identifying trend changes in the frequency of four to six month price trends followed by a four to six week reversal, as historically found in cryptocurrency bull and bear markets.
This signal gets noisy if prices trend sideways for more than 30 days - consult daily views.
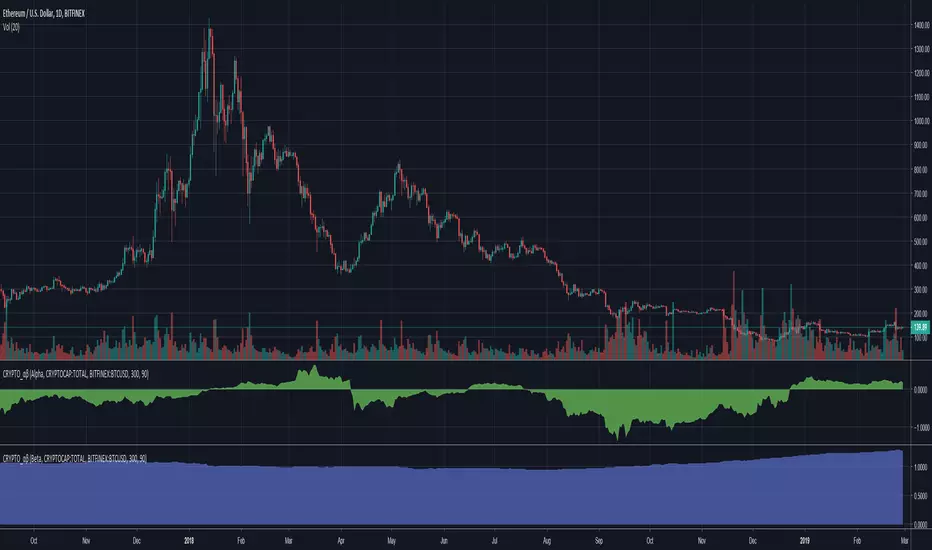
Cryptocurrency α / β (Alpha and Beta)Alpha and Beta for cryptocurrency. Custom input for other symbols.
CryptoTrader - Simple and effective Ema CrossoverWorks well on 4h charts, ETHUSD,BTCUSD,and XRPUSD but can be tested also on other crypto's.
On those pairs no need of sofisticate scripts to trade.
Can add a trailing stop, but as you see works perfect as it is.
KISS (Keep It Simple Stupid).
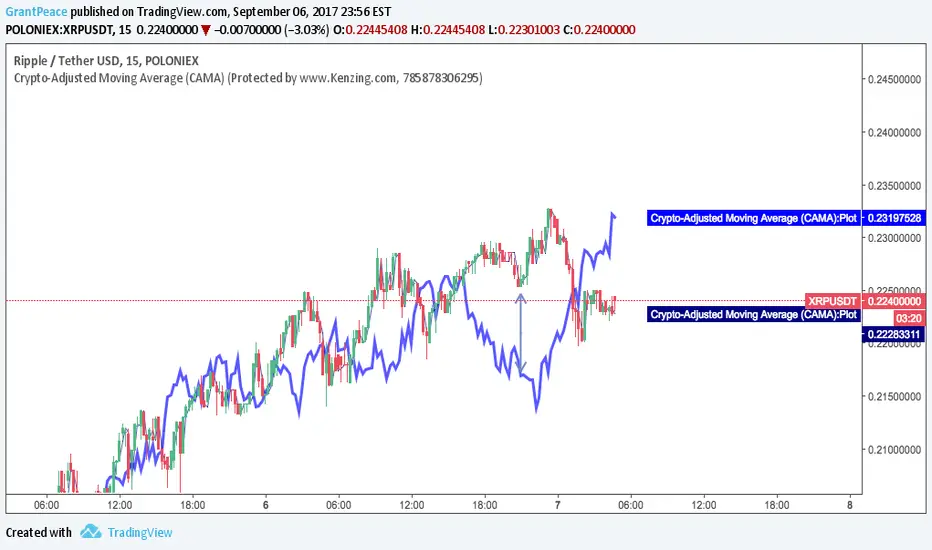
Crypto-Adjusted Moving Average (CAMA) (15 MINUTE CANDLESTICKS)This moving average is adjusted to give weight to the performance of the 6 largest Cryptocurrencies by market-cap: Bitcoin , Ethereum , Bitcoin Cash, Ripple, Litecoin, and Nem -0.95% Coin. The use of this indicator is to observe divergence between the price of the underlying asset (the crypto-currency you are interested in trading) and the rest of the cryptocurrency market.
If more cryptocurrencies go down while your observed currency goes up, the CAMA will sit lower. If more cryptocurrencies go up while your observed currency goes down, the CAMA will sit higher.
The indicator uses two input types:
"MA_Length" is the value given to the length of the moving average.
and
"CryptoFactor" which is the weight given to the movement of the Crypto-Index.
This modification to the moving average brings a fundamental element to your chart as it can be assumed, if all other crypto currencies move down, while the observed currency moves up quickly, that a breakout is occurring. This allows the trader to identify the breakout and react quicker to a MOONing asset.
Crypto Fear & Greed Score [Underblock]Crypto Fear & Greed Score - Methodology & Functioning
Introduction
The Crypto Fear & Greed Score is a comprehensive indicator designed to assess market sentiment by detecting extreme conditions of panic (fear) and euphoria (greed). By combining multiple technical factors, it helps traders identify potential buying and selling opportunities based on the emotional state of the market.
This indicator is highly customizable, allowing users to adjust weight parameters for RSI, volatility, Bitcoin dominance, and trading volume, making it adaptable to different market conditions.
Key Components
The indicator consists of two primary sub-scores:
Fear Score (Panic) - Measures the intensity of fear in the market.
Greed Score (Euphoria) - Measures the level of overconfidence and excessive optimism.
The difference between these two values results in the Net Score, which indicates the dominant market sentiment at any given time.
1. Relative Strength Index (RSI)
The indicator utilizes multiple RSI timeframes to measure momentum and overbought/oversold conditions:
RSI 1D (Daily) - Captures medium-term sentiment shifts.
RSI 4H (4-hour) - Identifies short-term market movements.
RSI 1W (Weekly) - Helps detect long-term overbought/oversold conditions.
2. Volatility Analysis
High volatility is often associated with fear and panic-driven selling.
Low volatility in bullish markets may indicate complacency and overconfidence.
3. Bitcoin Dominance (BTC.D)
Bitcoin dominance provides insights into capital flow between Bitcoin and altcoins:
Rising BTC dominance suggests fear as investors move into BTC for safety.
Declining BTC dominance indicates increased risk appetite and potential market euphoria.
4. Buying and Selling Volume
The indicator analyzes both buying and selling volume, ensuring a clearer confirmation of market sentiment.
High buying volume in uptrends reinforces bullish momentum.
Spikes in selling volume indicate panic and possible market bottoms.
Calculation Methodology
The indicator allows users to adjust weight parameters for each component, making it adaptable to different trading strategies. The formulas are structured as follows:
Fear Score (Panic Calculation)
Fear Score = (1 - RSI_1D) * W_RSI1D + (1 - RSI_4H) * W_RSI4H + (1 - Dominance) * W_Dominance + Volatility * W_Volatility + Sell Volume * W_SellVolume
Greed Score (Euphoria Calculation)
Greed Score = RSI_1D * W_RSI1D + RSI_4H * W_RSI4H + Dominance * W_Dominance + (1 - Volatility) * W_Volatility + Buy Volume * W_BuyVolume
Net Fear & Greed Score
Net Score = (Greed Score - Fear Score) * 100
Interpretation:
Above 70: Extreme greed -> possible overbought conditions.
Below -70: Extreme fear -> potential buying opportunity.
Near 0: Neutral market sentiment.
Trend Reversal Detection
The indicator includes two moving averages for enhanced trend detection:
Short-term SMA (50-periods) - Reacts quicklier to changes in sentiment.
Long-term SMA (200-periods) - Captures broader trend reversals.
How Crossovers Work:
Short SMA crossing above Long SMA -> Potential bullish reversal.
Short SMA crossing below Long SMA -> Possible bearish trend shift.
Alerts for SMA crossovers help traders act on momentum shifts in real-time.
Customization and Visualization
The Net Score dynamically changes color: green for greed, red for fear.
Users can adjust weightings directly from settings, avoiding manual script modifications.
Reference levels at 70 and -70 provide clarity on extreme market conditions.
Conclusion
The Crypto Fear & Greed Score provides a powerful and objective measure of market sentiment, helping traders navigate extreme conditions effectively.
🟢 If the Net Score is below -70, panic may present a buying opportunity.
🔴 If the Net Score is above 70, excessive euphoria may indicate a selling opportunity.
⚖️ Neutral values suggest a balanced market sentiment.
By customizing weight parameters and utilizing trend reversal alerts, traders can gain a deeper insight into market psychology and make more informed trading decisions. 🚀

Crypto Sectors Performance [Daveatt]IMPORTANT
⚠️ This script must be used on the Daily timeframe only.
OVERVIEW
This indicator brings the powerful sector analysis capabilities from velo.xyz/market's
Sector Performance chart to TradingView.
It enables traders to track and compare performance across the crypto market's major sectors, providing essential insights for sector rotation strategies and market analysis.
CALCULATION METHOD
The indicator calculates performance across six key crypto sectors: DeFi, Gaming, Layer 1s, Layer 2s, AI, and Memecoins.
For each sector, it computes a rolling percentage performance by averaging the performance of multiple representative tokens.
All sector performances are rebased to 0% at the start of each period, making relative comparisons clear and intuitive.
VISUALIZATION MODES
The script features two distinct visualization methods:
Plots Mode:
Displays continuous performance lines for each sector over time, ideal for tracking relative strength trends and sector momentum. Each sector has its own color-coded line with performance values clearly marked.
Bars Mode:
Presents current sector performance as vertical bars, offering an immediate visual comparison of sector gains and losses.
The bars are color-coded and labeled with exact percentage values for precise analysis.
For the "Bars Mode", I used the box.new() function
SECTOR COMPOSITION
Each sector comprises carefully selected representative tokens:
- DeFi: AAVE, 1INCH, JUP, MKR, UNI
- Gaming: GALA, AXS, RONIN, SAND
- Layer 1: BTC, ETH, AVAX, APT, SOL, BNB, SUI
- Layer 2: ARB, OP, ZK, POL, STRK, MNT
- AI: FET, NEAR, RENDER, TAO
- Memecoins: PEPE, BONK, SHIB, DOGE, WIFU, POPCAT
PERFORMANCE TRACKING
The indicator implements a rolling window approach for performance calculations.
Starting from 0% at the beginning of each period, it tracks relative performance with positive values indicating outperformance and negative values showing underperformance.
Multiple timeframe options (1W, 1M, 3M, 6M, and 1Y) allow for both short-term and long-term analysis.
APPLICATIONS
This tool proves invaluable for:
- Sector rotation analysis
- Identifying trending sectors
- Comparing relative strength
- Gauging market sentiment
- Understanding market structure through sector performance
Thanks for reading and for the support
Daveatt

Crypto Wallets Profitability & Performance [LuxAlgo]The Crypto Wallets Profitability & Performance indicator provides a comprehensive view of the financial status of cryptocurrency wallets by leveraging on-chain data from IntoTheBlock. It measures the percentage of wallets profiting, losing, or breaking even based on current market prices.
Additionally, it offers performance metrics across different timeframes, enabling traders to better assess market conditions.
This information can be crucial for understanding market sentiment and making informed trading decisions.
🔶 USAGE
🔹 Wallets Profitability
This indicator is designed to help traders and analysts evaluate the profitability of cryptocurrency wallets in real-time. It aggregates data gathered from the blockchain on the number of wallets that are in profit, loss, or breaking even and presents it visually on the chart.
Breaking even line demonstrates how realized gains and losses have changed, while the profit and the loss monitor unrealized gains and losses.
The signal line helps traders by providing a smoothed average and highlighting areas relative to profiting and losing levels. This makes it easier to identify and confirm trading momentum, assess strength, and filter out market noise.
🔹 Profitability Meter
The Profitability Meter is an alternative display that visually represents the percentage of wallets that are profiting, losing, or breaking even.
🔹 Performance
The script provides a view of the financial health of cryptocurrency wallets, showing the percentage of wallets in profit, loss, or breaking even. By combining these metrics with performance data across various timeframes, traders can gain valuable insights into overall wallet performance, assess trend strength, and identify potential market reversals.
🔹 Dashboard
The dashboard presents a consolidated view of key statistics. It allows traders to quickly assess the overall financial health of wallets, monitor trend strength, and gauge market conditions.
🔶 DETAILS
🔹 The Chart Occupation Option
The chart occupation option adjusts the occupation percentage of the chart to balance the visibility of the indicator.
🔹 The Height in Performance Options
Crypto markets often experience significant volatility, leading to rapid and substantial gains or losses. Hence, plotting performance graphs on top of the chart alongside other indicators can result in a cluttered display. The height option allows you to adjust the plotting for balanced visibility, ensuring a clearer and more organized chart.
🔶 SETTINGS
The script offers a range of customizable settings to tailor the analysis to your trading needs.
Chart Occupation %: Adjust the occupation percentage of the chart to balance the visibility of the indicator.
🔹 Profiting Wallets
Profiting Percentage: Toggle to display the percentage of wallets in profit.
Smoothing: Adjust the smoothing period for the profiting percentage line.
Signal Line: Choose a signal line type (SMA, EMA, RMA, or None) to overlay on the profiting percentage.
🔹 Losing Wallets
Losing Percentage: Toggle to display the percentage of wallets in loss.
Smoothing: Adjust the smoothing period for the losing percentage line.
Signal Line: Choose a signal line type (SMA, EMA, RMA, or None) to overlay on the losing percentage.
🔹 Breaking Even Wallets
Breaking-Even Percentage: Toggle to display the percentage of wallets breaking even.
Smoothing: Adjust the smoothing period for the breaking-even percentage line.
🔹 Profitability Meter
Profitability Meter: Enable or disable the meter display, set its width, and adjust the offset.
🔹 Performance
Performance Metrics: Choose the timeframe for performance metrics (Day to Date, Week to Date, etc.).
Height: Adjust the height of the chart visuals to balance the visibility of the indicator.
🔹 Dashboard
Block Profitability Stats: Toggle the display of profitability stats.
Performance Stats: Toggle the display of performance stats.
Dashboard Size and Position: Customize the size and position of the performance dashboard on the chart.
🔶 RELATED SCRIPTS
Market-Sentiment-Technicals
Multi-Chart-Widget

Crypto Volatility Bitcoin Correlation Strategy Description:
The Crypto Volatility Bitcoin Correlation Strategy is designed to leverage market volatility specifically in Bitcoin (BTC) using a combination of volatility indicators and trend-following techniques. This strategy utilizes the VIXFix (a volatility indicator adapted for crypto markets) and the BVOL7D (Bitcoin 7-Day Volatility Index from BitMEX) to identify periods of high volatility, while confirming trends with the Exponential Moving Average (EMA). These components work together to offer a comprehensive system that traders can use to enter positions when volatility and trends are aligned in their favor.
Key Features:
VIXFix (Volatility Index for Crypto Markets): This indicator measures the highest price of Bitcoin over a set period and compares it with the current low price to gauge market volatility. A rise in VIXFix indicates increasing market volatility, signaling that large price movements could occur.
BVOL7D (Bitcoin 7-Day Volatility Index): This volatility index, provided by BitMEX, measures the volatility of Bitcoin over the past 7 days. It helps traders monitor the recent volatility trend in the market, particularly useful when making short-term trading decisions.
Exponential Moving Average (EMA): The 50-period EMA acts as a trend indicator. When the price is above the EMA, it suggests the market is in an uptrend, and when the price is below the EMA, it suggests a downtrend.
How It Works:
Long Entry: A long position is triggered when both the VIXFix and BVOL7D indicators are rising, signaling increased volatility, and the price is above the 50-period EMA, confirming that the market is trending upward.
Exit: The strategy exits the position when the price crosses below the 50-period EMA, which signals a potential weakening of the uptrend and a decrease in volatility.
This strategy ensures that traders only enter positions when the volatility aligns with a clear trend, minimizing the risk of entering trades during periods of market uncertainty.
Testing and Timeframe:
This strategy has been tested on Bitcoin using the daily timeframe, which provides a longer-term perspective on market trends and volatility. However, users can adjust the timeframe according to their trading preferences. It is crucial to note that this strategy does not include comprehensive risk management, aside from the exit condition when the price crosses below the EMA. Users are strongly advised to implement their own risk management techniques, such as setting appropriate stop-loss levels, to safeguard their positions during high volatility periods.
Utility:
The Crypto Volatility Bitcoin Correlation Strategy is particularly well-suited for traders who aim to capitalize on the high volatility often seen in the Bitcoin market. By combining volatility measurements (VIXFix and BVOL7D) with a trend-following mechanism (EMA), this strategy helps identify optimal moments for entering and exiting trades. This approach ensures that traders participate in potentially profitable market moves while minimizing exposure during times of uncertainty.
Use Cases:
Volatility-Based Entries: Traders looking to take advantage of market volatility spikes will find this strategy useful for timing entry points during market swings.
Trend Confirmation: By using the EMA as a confirmation tool, traders can avoid entering trades that go against the trend, which can result in significant losses during volatile market conditions.
Risk Management: While the strategy exits when price falls below the EMA, it is important to recognize that this is not a full risk management system. Traders should use caution and integrate additional risk measures, such as stop-losses and position sizing, to better manage potential losses.
How to Use:
Step 1: Monitor the VIXFix and BVOL7D indicators. When both are rising and the Bitcoin price is above the EMA, the strategy will trigger a long entry, indicating that the market is experiencing increased volatility with a confirmed uptrend.
Step 2: Exit the position when the price drops below the 50-period EMA, signaling that the trend may be reversing or weakening, reducing the likelihood of continued upward price movement.
This strategy is open-source and is intended to help traders navigate volatile market conditions, particularly in Bitcoin, using proven indicators for volatility and trend confirmation.
Risk Disclaimer:
This strategy has been tested on the daily timeframe of Bitcoin, but users should be aware that it does not include built-in risk management except for the below-EMA exit condition. Users should be extremely cautious when using this strategy and are encouraged to implement their own risk management, such as using stop-losses, position sizing, and setting appropriate limits. Trading involves significant risk, and this strategy does not guarantee profits or prevent losses. Past performance is not indicative of future results. Always test any strategy in a demo environment before applying it to live markets.

CryptoLibrary "Crypto"
This Library includes functions related to crytocurrencies and their blockchain
btcBlockReward(t)
Delivers the BTC block reward for a specific date/time
Parameters:
t (int) : Time of the current candle
Returns: blockRewardBtc
