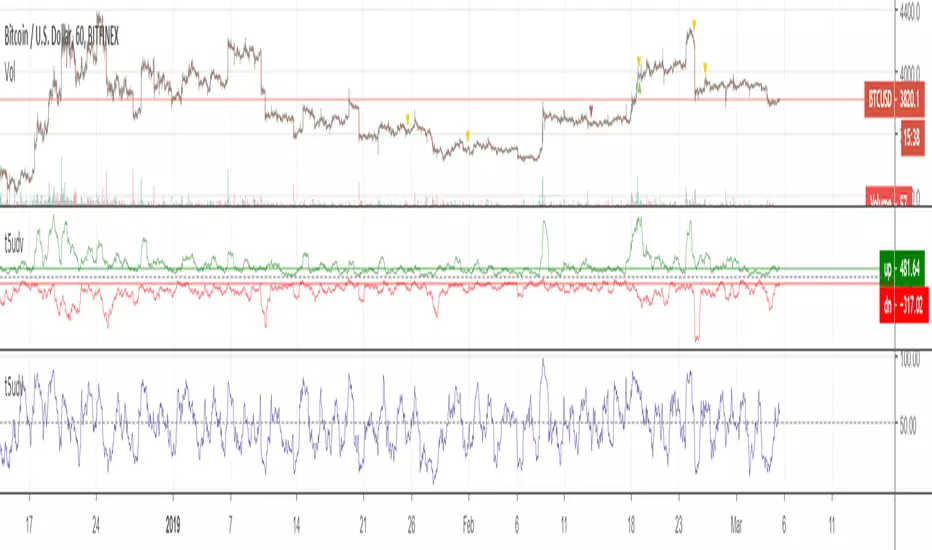
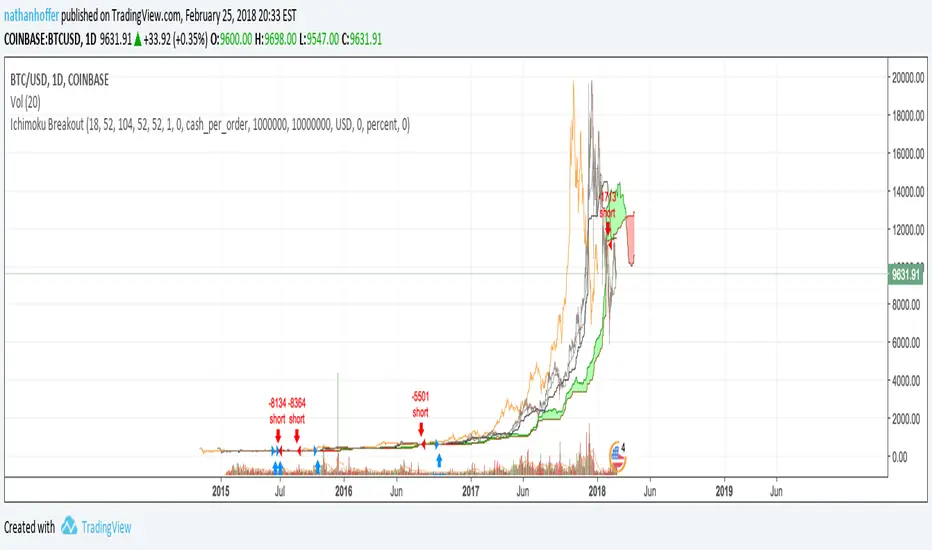
Top 5 coins cummulated Upvol/Dnvol and Money FlowThis script reads price and volume information for the top 5 coins (on 9 exchanges, a total of 29 pairs), calculates the cummulative upvolume and downvolume according to the Money Flow (MFI) formula, and shows upvolume and downvolume separately on the chart as a green and a red line.
The coins used are BTC, ETH, LTC, XRP and EOS. They are the top 5 coins by daily volume, as of 24th of February 2019.
Because of the many security() calls needed, the script is VERY slow, so have lots of patience.
I find it useful as a broad crypto market indicator - for example to compare the current pump with the pumps in the past.
Can also calculate the aggregated Money Flow (MFI) if you check that option in the indicator's configuration. Make sure to wait for recalculation and rescale the chart afterwards - MFI has a value from 0 to 100 and you may need to zoom in.
Search in scripts for "crypto"
Average True Range (ATR %) Stop Loss CalculatorThis indicator takes the average of a series of ATR to calculate what I would consider an optimum stop loss placement represented in percentage (read below for full overview).
While the data is plotted what is most helpful are the actual numbers presented and for my charts I remove most of the plotting.
This indicator is most helpful on the daily timeframe but can be used for all timeframes such as the 4HR, 1HR or even 15M.
This indicator should not be used alone. It should be used in conjunction with proper price action analysis. It’s also a great indicator if you chart using Value Channels. Ideally you want your stop placement to be below at least one core Value Channel boundary range. In addition to standard support and resistance and some key moving averages the market respects. This also works best when trading with the prevailing BIAS of the instrument (bull or bear).
Cryptos: Generally, that means you’re buying on retracements that fit the end of a structured move. The other option is using this in a clear up trending market where the pull backs are clearly being supported with buying.
FOREX: I built another indicator for FOREX search: ATRPIPS with SL
WTI: Helpful but I have different rules for when I trade WTI. I rely upon VCs and diagnal VCs much more when trading this.
Equities: Helpful but with the increase of volatility as well as uncertainty of Bias of the market-- this should be used as more of a guide than
What is most important is the actual percentage numbers but I've found graphing 1-3 of the actual ATRs is helpful. The rest just uncheck the checkbox in the options.
Indicator Overview:
Value 1 - 3 Period ATR (maroon)
Value 2 - 7 Period ATR (green)
Value 3 - 30 Period ATR (blue)
Value 4 - 90 Period ATR (blue, bold)
Value 5 - 1 Period ATR (green)
Value 6 - 1 Period ATR (red)
Value 6 – Prime Stop Loss Placement (maroon). This is the average of all above ATRs multiplied by 1.5
Value 7 - Move Left (red). Experimental value. This is the difference between (prime stop loss) and 1 day period move. Two ways to use this value. Use as a tighter stop loss placement. The other option is to use as a retrace target for purchase and using the Prime Stop Placement value as you’re stop loss.
All ATRs use the LOW price of the period. After testing both the low and close I’ve settled on the low to capture the most volatility you will typically experience.
Once again, this indicator should be used in conjunction with your proven trade system.
Also, by knowing what the values are within the indicator you could just eye ball what would be the best stop placement depending on the ATR or 1 or 2 ATRs you find most represent the volatility of what you are trading.
I will be expanding on this indicator by bringing in average measured moves as well as volume analysis and most likely with color changes and modifications.
Background:
While using and refining my trade system I've noticed that most moves happen in 3 periods. So we start there. The 7 period is good for a 24 hour market such as crypto (although weekend trading can be a hit or miss) and to some extent FOREX. The longer periods of 30 & 90 are to smooth out the data set. The final value of the 1 period is to bring a little more recency to the calculation.
Why multiply the average by 1.5? I've found in my own trading and system I built to be the best placement (in conjunction with VCs) to ensure you're stop isn't to close and is within the instrument you are trading volatility .
I'm looking at making this more intelligent as well as take into account volume and structured moves.

Aggregated Volume LTCBTCAggregates the LTC/BTC volume from multiple exchanges into a single indicator.
# Exchanges and Pairs
Included are only exchanges supported by TradingView:
* Binance
* Bitstamp
* Bittrex
* Coinbase
* Gemini
* Bitfinex
* Kraken
* Poloniex
* HitBTC
Many other top exchanges are not included, because they are not supported by TradingView.
# Inputs
By default the spot exchanges are selected. You can select also the other margin trading and derivatives exchanges.
# Contribute
Feel free to share any ideas and issues you have.
# Open Source
The code is open source @ github.com and uses the commonpine library github.com

Aggregated Volume LTC/FiatAggregates the LTC/Fiat volume from multiple exchanges into a single indicator.
# Exchanges and Pairs
Included are only exchanges supported by TradingView:
* Binance
* Bitstamp
* Bittrex
* Coinbase
* Gemini
* Bitfinex
* Kraken
* Poloniex
* HitBTC
Many other top exchanges are not included, because they are not supported by TradingView.
The pair LTC/BTC is not included.
# Inputs
By default the spot exchanges are selected. You can select also the other margin trading and derivatives exchanges.
# Contribute
Feel free to share any ideas and issues you have.
# Open Source
The code is open source @ github.com and uses the commonpine library github.com

Aggregated Volume ETHBTCAggregates the ETH/BTC volume from multiple exchanges into a single indicator.
# Exchanges and Pairs
Included are only exchanges supported by TradingView:
* Binance
* Bitstamp
* Bittrex
* Coinbase
* Gemini
* Bitfinex
* Kraken
* Poloniex
* HitBTC
Excluded low volume exchanges (not in CMC Top):
* CEX.IO
Many other top exchanges are not included, because they are not supported by TradingView.
# Inputs
By default the spot exchanges are selected. You can select also the other margin trading and derivatives exchanges.
# Contribute
Feel free to share any ideas and issues you have.
# Open Source
The code is open source @ github.com and uses the commonpine library github.com

Default Strategy Inputs (Forex / Crypto)The code in this post contains a set of default strategy inputs I use in new projects / backtests in Tradingview.
Full code commentary is available on the Backtest-Rookies website. To comply with house rules, I cannot post the direct link here.
Features
Trade Direction: So that you can limit the strategy for long only, short only or trade in both directions. It is important to note that when you select “Long Only”, you will still see Short signals on the chart. However, they are only used to close a position rather than reverse it. This is the default behaviour for strategies. The same applies to “Short Only”.
Date Ranges: So that you can isolate backtesting to specific periods of interest such as bull or bear markets.
Sessions: So you can easily get an idea of the expected results during your own session. You may also notice that performance of the strategy varies depending on which session it is deployed in.
Some example stop losses: It is not an exhaustive list but it should be enough to provide some inspiration for different types of stops that you can experiment with.
Happy Scripting. I hope the community finds it useful.

Aggregated Volume ETHAggregates the ETH/fiat volume from multiple exchanges into a single indicator.
# Exchanges and Pairs
Included are only exchanges supported by TradingView:
* Binance
* Bitstamp
* Bittrex
* Coinbase
* Gemini
* itBit
* Bitfinex
* Kraken
* Poloniex
* BitMEX
Excluded low volume exchanges (not in CMC Top):
* CEX . IO
* Coinfloor
Excluded exchange due to volume calculation by TV:
* HitBTC
Many other top exchanges are not included, because they are not supported by TradingView.
# Inputs
By default the spot exchanges are selected. You can select also the other margin trading and derivatives exchanges.
# Contribute
Feel free to share any ideas and issues you have.
# Open Source
The code is open source @ github.com and uses the commonpine library github.com

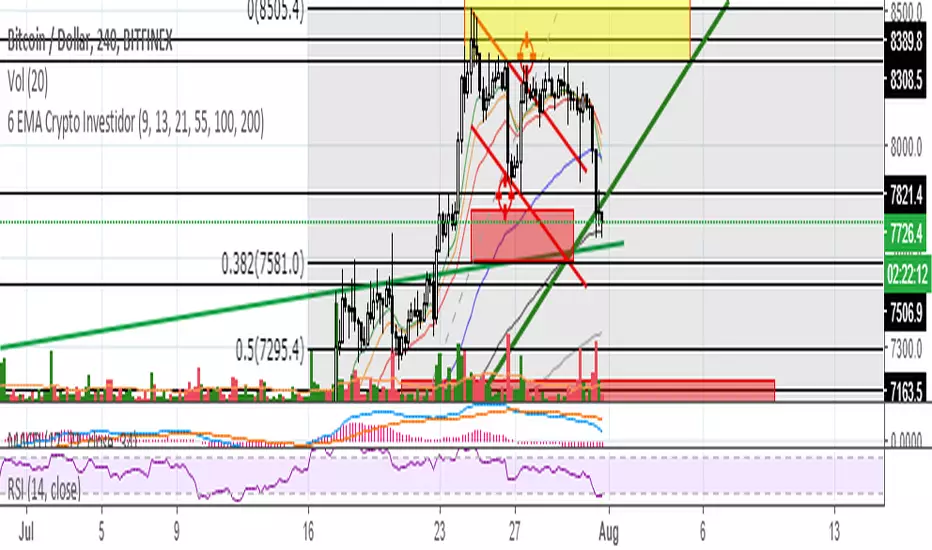
6 EMA Crypto InvestidorExponential Moving Averages - 6 EMA Crypto Investidor
Indicator developed to facilitate the use of 6 EMAs in a single indicator.
EMAs: 9, 13, 21, 55, 100 and 200 Periods
Developed by Diego do Youtube Channel Crypto Investor
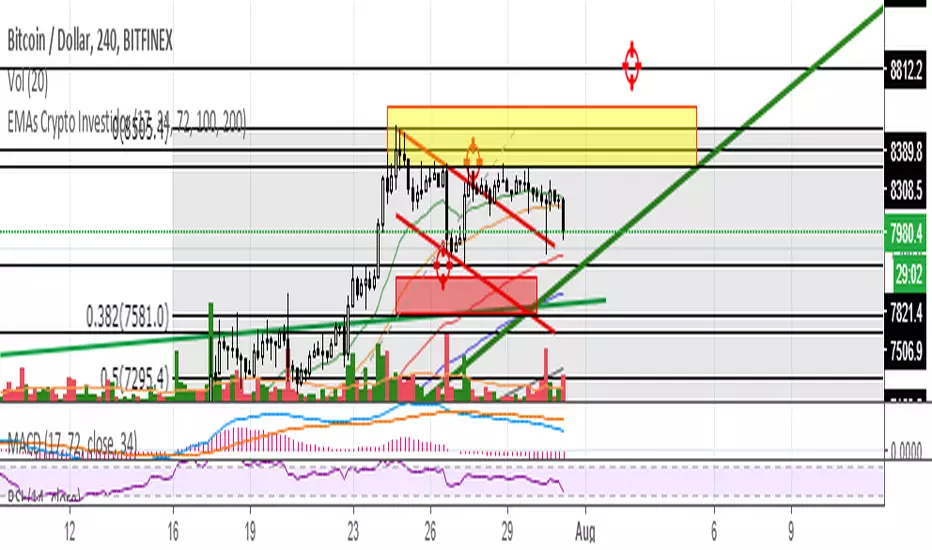
EMAs Crypto InvestidorExponential Moving Averages - EMAs Crypto Investor
Indicator developed to facilitate the use of 5 EMAs in a single indicator.
EMAs: 17, 34, 72, 100 and 200 Periods
Developed by Diego do Youtube Channel Crypto Investor
Bitfinex(bfx) Shorts, Longs, Combined Numbers (all crypto pairs)Pretty much Self-explanatory :)
The columns (green and red) are difference in long and short positions during that period. Positive number suggests more number of long positions and vice-versa.
Works for all allowed crypto-pairs.
A similar indicator was published by another user, but sadly he closed the source code
Happy Trading!

Leo Crypto Multi-setting Ichimoku CloudEasily switch between Traditional, Crypto Single and Crypto Double Ichimoku Settings

MACD Strategy custom for cryptosIt is a MACD with strategy simulation implemented to "tune" the MACD parameters for cryptos, it only use long and close strategy, not short

CryptoM173's Gimme MoneyLatest version. Nobody gave me feedback and managing requests to add people became a PITA. Enjoy.
I like money, you like money, this set up has the potential to make a LOT of it. That being said, I do NOTmake any warranties of this making you money, nor do I guarantee you will NOT lose money. In the end, you're the one configuring it and interpreting the results. Providing that you DO set it up correctly and it makes you obscene amounts of money, donations are always welcome (addresses below).
Before you start, it's probably you read EVERYTHING below.
You'll have to do some tweaking of the MA's to find a strat that best suits your needs. It is an indicator you're welcome to use to assist in your trading decisions. I made this script for renko charts and trading bitcoin -1.64% because the standard strat wasn't working out. if you find you're getting a lot of consecutive colored bars or crosses on Renko, you may need to switch from ATR 14 to something like Traditional 50. You will need to adjust the "box value" for traditional renko to fit the asset you're working with, on the time frame you're trading on. Smaller values (i.e. on bitcoin -1.64% I use a box value of 50 on 4hr and 1D with absurd success) but you need to make sure they're not too small, otherwise small moves may appear larger than they are, resulting in a bunch of break-even trades. If you're going to be trading cryptocurrency, it's easiest to switch back to ATR14 to get an idea of the Average Trading range to have a reference point to start from trading btc -1.64% (i.e .000034 rather than 50).
It's a great tool if you're looking to carry both swap and futs positions and keep an eye on the short term swap opportunities while monitoring the status of your futs position and help decide whether or not to close a long at a correction or not and while this strategy has been most effective for me with Renko bars, it's been very useful for monitoring futs positions on traditional charts.
For access, feel free to DM -0.34% me on twitter, @CryptoM173
If you're the generous type, feel free to donate Bitcoin to: 3BMEXWz6Es7iLdi9zAyMWWHHZPNbMKPqrV

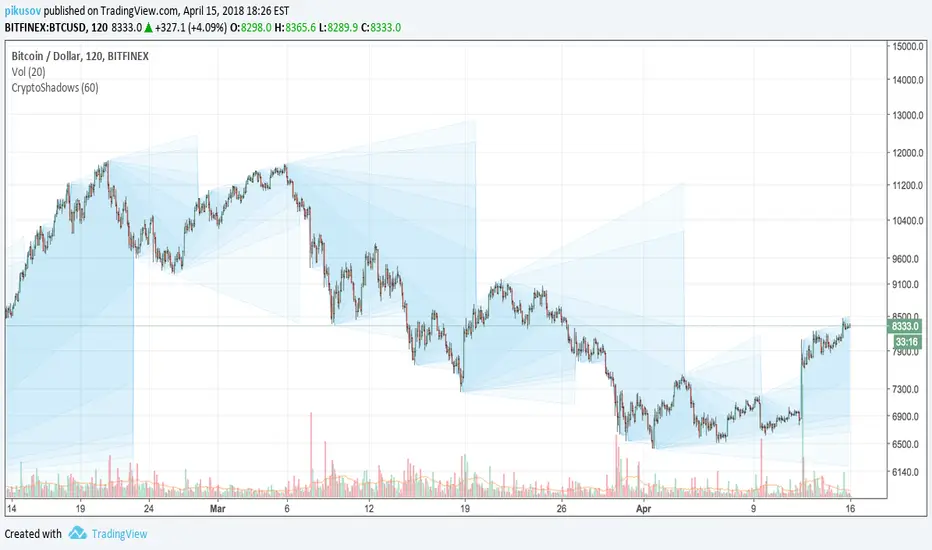
CryptoShadows V1The first Diagonal Support and Resistance indicator. Best for bitcoin and cryptocurrencies
Bitfinex Bitcoin BullishnessBased on contrary opinion in futures, I've adjusted this to Bitcoin, more thoroughly Bitfinex margin longs & shorts. Those unfamiliar with the concept, contrary opinion illustrates the psychological sentiment in the market by determining the degree of bullishness or bearishness among participants in the market.
The principle holds that when the majority of people agree on anything, they are generally wrong, so following the principle you would analyse and look to take the other side of the trades.
Consider this, once the market is extremely bullish, all bulls have already entered the market to an extent that one can't commit any more funds to the position. Even though Bitfinex margin positions are not like future trading, that every short must have someone taking the long side, one should understand that the majority of people do not make money on the market, so whenever this indicator goes too low or too high, one should look for a trend reversal.
This indicator is in the range of 0 to 1 and the neutral position for a "healthy" market is 0.55ish. Some adjustments should probably be made according to the cryptocurrency markets and I might add this in the future updates, but as of now it's a good indicator for forecasts and to get a bigger picture on a timeframe of 1 DAY or longer charts.
The base of the indicator is simple, amount of longs divided by the sum of shorts and longs.
Also you can see, how only now, 10th of April, we are hitting new lows in the bearishness of the market.

BTCUSD Combined VolumeThis script sums the volume for BTCUSD across several popular exchanges. I share it not so much as an indicator as a tool to use in other indicators (i.e. those that rely on volume, which often do not work very well for crypto due to the low volumes). Similar sums could easily be created for other currency, and with a little thought I could probably add the ability to parameterize the currency (e.g. type "BTCUSD" or "ETHBTC" or "LTCUSD" or whatever as an input).
I got the idea from seeing someone asking in chat whether it is possible to combine volumes across multiple exchanges, so kudos to oh92 and paaax for the neat idea.
Please feel free to incorporate this in your own indicators as you like...and of course if you're feeling generous, tips are appreciated. Thank you!
BTC
3KmFchJ18QvMzAJKDcFQXvyK9p1EHWQdhP
BCH
qqtrw64ptuwprk5vtj3z8qwkvh3v0jawxq7khqng7x
ETH
0x9b51361A278910Ba3945C7519C9f0FA8a77df18d
LTC
MDeWWsP7XCG2zQuZ2dYALZXQ52u2qkc8fh


Stochastic + Stochastic RSIJust a basic indicator I rigged up to help reduce screen real estate that ended up providing more insight than expected; overlays both the stochastic and stochastic RSI. While I initially made this to save space, I've begun to pick up on some interesting patterns in cryptocurrencies based on the divergence of stochastic from the stochastic RSI, and the comparison of their swing lows.
Left all settings modifiable, since this is simply a combination indicator I've left the source code open unlike other proprietary indicators I use.
Happy trading!
Austin Doyle
CTO
Crypto Playhouse

Quadruple Moving Averages For Day TradingQuadruple Moving Averages For Day Trading Crypto
Inputs of 8,13,21,55
Based on chart used by Philakone.

Richard Carey - Crypto Appropriate EWMACA crypto appropriate EWMAC with variable MA types and Fast/Slow Periods.
Super Smoothed MACD for CRYPTO by KIVANÇ fr3762THIS INDICATOR IS DESIGNED USING EHLERS' SUPER SMOOTHER FILTER
DESIGNED FOR CRYPTO TRADE
(another version available for stocks also: Super Smoothed MACD for STOCKS by KIVANÇ fr3762)
Instead of EXPONENTIAL MOVING AVERAGES in traditional MACD calculation, Super Smoothed prices are used.
The default values of BAND EDGE's (periods) of these Super Smoothed Prices are 13,8, and 5 (Fibonacci numbers) which pretty work well for daily trade
users can change these values 13,8,3 or 21,13,5 or 21,13,8 and so on to have optimum trade productivity
