Momentum Alligator 4h Bitcoin StrategyOverview
The Momentum Alligator 4h Bitcoin Strategy is a trend-following trading system that operates on dual time frames. It utilizes the 1D Williams Alligator indicator to identify the prevailing major price trend and seeks trading opportunities on the 4-hour (4h) time frame when the momentum is turning up. The strategy is designed to close trades if the trend fails to develop or holding position if price continues increasing without any significant correction. Note that this strategy is specifically tailored for the 4-hour time frame.
Unique Features
2-layers market noise filtering system: Trades are only initiated in the direction of the 1D trend, determined by the Williams Alligator indicator. This higher time frame confirmation filters out minor trade signals, focusing on more substantial opportunities. At the same time, strategy has additional filter on 4h time frame with Awesome Oscillator which is showing the current price momentum.
Flexible Risk Management: The strategy exclusively opens long positions, resulting in fewer trades during bear markets. It incorporates a dynamic stop-loss mechanism, which can either follow the jaw line of the 4h Alligator or a user-defined fixed stop-loss. This flexibility helps manage risk and avoid non-trending markets.
Methodology
The strategy initiates a long position when the d-line of Stochastic RSI crosses up it's k-line. It means that there is a high probability that price momentum reversed from down to up. To avoid overtrading in potentially choppy markets, it skips the next two trades following a winning trade, anticipating sideways movement after a significant price surge.
This strategy has two layers trades filtering system: 4h and 1D time frames. The first one is awesome oscillator. It shall be increasing and value has to be higher than it's 5-period SMA. This is an additional confirmation that long trade is opened in the direction of the current momentum. As it was mentioned above, all entry signals are validated against the 1D Williams Alligator indicator. A trade is only opened if the price is above all three lines of the 1D Alligator, ensuring alignment with the major trend.
A trade is closed if the price hits the 4h jaw line of the Alligator or reaches the user-defined stop-loss level.
Risk Management
The strategy employs a combined approach to risk management:
It allows positions to ride the trend as long as the price continues to move favorably, aiming to capture significant price movements. It features a user-defined stop-loss parameter to mitigate risks based on individual risk tolerance. By default, this stop-loss is set to a 2% drop from the entry point, but it can be adjusted according to the trader's preferences.
Justification of Methodology
This strategy leverages Stochastic RSI on 4h time frame to open long trade when momentum started reversing to the upside. On the one hand, Stochastic RSI is one of the most sensitive indicator, which allows to react fast on the potential trend reversal. On the other hand, this indicator can be too sensitive and provide a lot of false trend changing signals. To eliminate this weakness we use two-layers trades filtering system.
The first layer is the 4h Awesome oscillator. This is less sensitive momentum indicator. Usually it starts increasing when price has already passed significant distance from the actual reversal point. The strategy opens long trade only is Awesome oscillator is increasing and above it's 5-period SMA. This approach increases the probability to filter the false signals during the choppy market or if the reversal is false.
The second layer filter is the Williams Alligator indicator on 1D time frame. The 1D Alligator serves as a filter for identifying the primary trend and increases probability to avoid the trades with low potential because trading against major trend usually is more risky. It's much better to catch the trend continuation than local bounce.
Last but not least feature of this strategy is close trades condition. It uses the flexible approach. First of all, user can set up the fixed stop-loss according to his own risk-tolerance, by default this value is 2% of price movement. It restricts the potential loss at the moment when trade has just been opened. Moreover strategy utilizes the 4h Williams Alligator's jaw line to exit the trade. If price fell below it trade is closed. This approach helps to not keep open trade if trend is not developing and hold it if price continues going up.
Backtest Results:
Operating window: Date range of backtests is 2021.01.01 - 2024.05.01. It is chosen to let the strategy to close all opened positions.
Commission and Slippage: Includes a standard Binance commission of 0.1% and accounts for possible slippage over 5 ticks.
Initial capital: 10000 USDT
Percent of capital used in every trade: 50%
Maximum Single Position Loss: -3.04%
Maximum Single Profit: +29.67%
Net Profit: +6228.01 USDT (+62.28%)
Total Trades: 118 (24.58% win rate)
Profit Factor: 1.71
Maximum Accumulated Loss: 1527.69 USDT (-11.52%)
Average Profit per Trade: 52.78 USDT (+0.89%)
Average Trade Duration: 60 hours
These results are obtained with realistic parameters representing trading conditions observed at major exchanges such as Binance and with realistic trading portfolio usage parameters.
How to Use:
Add the script to favorites for easy access.
Apply to the 4h timeframe desired chart (optimal performance observed on the BTC/USDT).
Configure settings using the dropdown choice list in the built-in menu.
Set up alerts to automate strategy positions through web hook with the text: {{strategy.order.alert_message}}
Disclaimer:
Educational and informational tool reflecting Skyrex commitment to informed trading. Past performance does not guarantee future results. Test strategies in a simulated environment before live implementation
Search in scripts for "momentum"

Broadview Economic StudioThank you for taking the time to read this description. We'll be taking a look at the Broadview Economic Studio. This has been a work-in-progress for years and is a very powerful tool for planning trades with complex volume scaling strategies. We will be talking about many indicators and types of indicators used in the public domain, but it is NOT recommended to reverse engineer our scripts as there is quite a bit of logic in the code that works to make each common approach entirely unique. So although you may understand quite a bit about oscillators, the way they work with the rest of the logic within the script may change the way you know them to work from elsewhere.
In the chart snapshot above you'll see a mild configuration where I only had to tweak a few settings. Commissions are set to 0.1%, starting capital is set to $10,000, and slippage is off. In my tests orders came through less than a penny off. Generally speaking, there are really only two situations in which you should be concerned about slippage. The first is if you trade really low timeframe charts like the 1 second. This tool, while it works for any timeframe, is programmed on the 45 minute timeframe and works best there. The other situation in which you should be prepared for slippage is if you're using extremely high volume trades in the hundreds of thousands or millions depending on the market cap and liquidity of the asset you're studying. Large orders like that have to be split up among several deals and that can cause slippage.
There are 31 primary inputs for users to tweak. Each input is grouped within a module called a Suite. Each suite has a focus like filtering signals or strategically allocating volume according to your strategy. Everything starts with the Origin Suite. The Origin Suite is a group of inputs that generates Tops & Bottoms from price action. It uses math like Rate of Change, where one can specify a required rate of change before an Origin signal can be made, and users can specify how much lower in price a bar must be compared to previous bars. So with the Origin Suite, users can control how often they want to see originating signals and under what conditions they can appear.
We used to use WVF and CVI to produce top and bottom signals, but our Origin Suite works much better for systematically generating profitable configurations.
The triangles you see on the chart represent markers, potential signals, or Prop Signals as they're referred to within the script. The blue arrows represent trades where Prop Signals were allowed to pass as true long signals. There are two ways to ignore Prop Signals. You can filter the markers entirely, or you can reduce their volume scaling to the minimum which is usually $10 for most exchanges. We're first going to be talking about some of the primary DCA inputs before we talk about the technology we use to filter and overload signals.
Here are some important features found within the script:
Base Orders
Safety Orders
Take Profits
Change-Based Volume Scaling
Ignoring Low or Medium Changes
Overloading
Filtering
Alert Messages w/ Volume Scaling
Let's walk through each of these features in more depth.
The Base Order is the initial Long position within a series. It comes in first and is followed by all of its Safety Orders. The Base Order is set to $25 within the script by default. Keeping the base order low allows one to reserve more of their capital for Safety Orders that are lower within a dip, and thus, lower the user's Position Average. The primary feature of this script is to help users plan their volume scaling strategically, and this is where we start. It's this kind of due diligence and effort in protecting trades that makes this script unique.
So we start with a low Base Order. Then, we follow with a lot of Safety Orders. Typically in DCA this is done in consistent time intervals and in consistent amounts. So in regular DCA one may invest the same amount bi-weekly on pay day. They use the financial instrument as a sort of savings and average their position over their consistent investments. This is not where the bleeding edge of DCA is today though. In modern Doller Cost Averaging, I would expect to see signals and volume scaling based on logic.. as opposed to being consistent intervals.
This sets up the explanation of the primary means of volume scaling within the script. Mathematically, we start with the net balance. This is your specified starting balance plus any wins or losses. Users specify what % of their Available Balance they would like to start with when volume scaling. This percent of capital is then multiplied by a Safety Order Multiplier. The safety order multiplier is made up of a number specified by the user, multiplied by the number of the Safety Order you're on. So user's can control this equation/algorithm and scale their investments as the number of Safety Orders increases and drops in price become more opportune.
The Take Profit within the script lets users specify their desired ROI from a series. So if a user sets a 60% take profit, the script will set a price from the position average that when reached will give the user a 60% ROI for the series including its Base Order and all its Safety Orders.
Before moving on, let's talk about the amazing internal reporting found in the script. When you zoom in on the blue arrows, you can see each trade is accompanied by some extremely helpful information. This is just another feature that makes this script unique, it is the feature that gives us accurate reporting and ultimately allows us to connect with TradingView's Strategy Tester in a way that provides instant backtests with good merit. With this reporting not only can users get reports and information on trades made on different assets with different configurations, but user's can perform a deep dive on each configuration and know exactly what was going on for each trade. The first number is the number of the safety order the script is on. Remember, this is used in the primary volume scaling math. The second number is the amount the script spent on the current trade. The third number denotes the cumulative spending for the series. The final number displays the script's available balance at that time. With these numbers, the TradingView Strategy Tester, and the List of Trades feature, users can practice as much due diligence as they need during their studies.
Let's move on to talking about my favorite suite within the script, the Volume Scaling Suite. Here there are two primary means of controlling volume scaling. Although, in the near future there will be more.
In this suite you'll find Change-Based Volume Scaling and Position Average Volume Scaling. Position Average Volume Scaling is quite easy to explain. This feature only allows signals to pass if they are lower in price than your base order. In this way, users can apply most of their capital to trades that lower their position average. Simply having the money in the market can boost profits, but having a lower Position Average is the entire reason we DCA. Change-Based Volume Scaling is quite a bit more complex.
In theory, one could argue that every moment is a great moment to buy. It's just that some moments are more opportune than others. So it's not about perfect signals as much as it's about proper volume scaling.
Change-Based Volume Scaling allows us to set rules that dictate how much volume scaling is used based on the asset's current delta, or Rate of Change.
Using CBVS, one can downscale capital applied to signals with a low ROC, or simply ignore them. So if a signal comes in and the price hasn't changed very much then you can automatically use less volume for the trade. One can do the same thing for medium changes, and the user can specify what quantifies as a low or medium change. Users can give extra volume to signals with a greater rate of change, or overload signals with a high rate of change! So the CBVS feature gives users the ability to allocate volume based on logic rooted in the asset's rate of change. If a signal has dropped a lot in price, then generally, it is deserving of more capital and that's what makes this feature unique and so powerful.
There are two kinds of Overloading found in the script. There's overloading from CBVS, and then overloading from the 4 signal filtering suites. There's an important difference to note before we move on. Overloading performed by CBVS is based on ignored signals. So if you ignore low or medium change signals, and you have CBVS Overloading on, the script will allocate more capital to High Change signals. When signals are ignored, they are downscaled to $10. Whereas with the filtering suites, if a signal is filtered the Prop Signal triangle marker is removed entirely. The overloading in that scenario is simply applied to signals that aren't filtered. The reason it's done this way is because allowing ignored signals to still come in, with the lowest volume scaling possible, keeps the Safety Order count rising which works in the volume scaling math. This math is intrinsic to getting capital deep within dips and crashes.
So in future versions we may allow ignored signals to be filtered out entirely but for the time being, simply scaling them down to the lowest possible amount is what produces the best and most consistent configurations.
Let's talk about filtering signals, and the overloading provided within each filtering suite.
Here you can see our Overbought & Oversold Heatmap V3. This is a unique indicator that takes 15 common oscillators and visualizes them in a way that clearly denotes confluence. Looking at this indicator makes it easer to read cycles and trends. It is quite common for investors to base their entire scripts on one or more of the oscillators found within the OBOS Heatmap V3. So the OBOS Heatmap V3 is an awesome way to ensure your signals follow an oversold trend! The orange represents an oscillator being oversold, while the yellow represents it being overbought. Generally, when an asset is oversold it is a better time to buy. One can filter signals based on this information and use the Heatmap's unique ability to quantify confluences. In this script users can set a sensitivity and that sets the number of oscillators that must be in agreement before a signal is allowed to pass.
Here are the oscillators found within the OBOS Heatmap:
*Please keep in mind that although some of these oscillators may have big names, the code and math in the script may work differently than you're used to. This is because the code and math is changed quite a bit, and the overall intended functionality of the OBOS Heatmap has a larger scope than any one indicator. It's also important to note that the lengths for these oscillators are set low and are meant to classify the individual signal as either overbought or oversold, and not the entire period. So while the OBOS Heatmap is awesome for trends and cycles, it's ultimately meant to classify individual price bars as either overbought or oversold according to a consensus.*
Relative Strength Index
Money Flow Index
Commodity Channel Index
Aroon Oscillator
Relative Volatility Index
Fast Stochastic Detrended Price Oscillator
Fast Stochastic Elders Force Index
Fast Stochastic Relative Strength Index
Fast Stochastic Relative Vigor Index
Fast Stochastic Klinger Oscillator
Fast Stochastic Awesome Oscillator
Fast Stochastic Ultimate Oscillator
Fast Stochastic Chande Momentum Oscillator
Fast Stochastic On Balance Volume Oscillator
Fast Stochastic Moving Average Convergence/Divergence
Each band of the Overbought & Oversold Heatmap represents an oscillator. When it's orange it's said to be oversold. When it's yellow it's said to be overbought. The indicator turns purple during trends and reversals where it is neither overbought nor oversold. It can differentiate between uptrends and downtrends with differing colors of purple, but the OBOS Heatmap is not used for trends or cycles in this script. It is used to quantify oversold confluence.
Let's talk about the Dominance Suite.
First note in the top portion of the screenshot above, you will see various colors in the script. It replaces the price line with something we call Price Flow bars. So when you add the script it's best to make the stock price line invisible in TV settings. The Price Flow Bars use a preset EMA to color price action as being in either a downward momentum or upward momentum. The triangular signals represent dark teal for the initial long marker within a series, dark green for long orders and long signals that convert into safety orders, and light green for safety orders. This is more logic that makes this script really unique. The dark green initial long marker signals are rarely seen. You can find them at the beginning of a new series of signals and they work to establish when a new series of signals should begin. The dark green signals actually denote a long base order opportunity, but if a series has already started then these signals are converted into Safety Orders. The Safety Orders then come in light green, and red for Prop Shorts. Prop Shorts work with Initial Longs to establish the start of a new series. More on that math I cannot tell.
In the bottom half of the screenshot is the Dominance Suite itself. It's another one of the four filtering suites found in the script. It is made up of 7 oscillators that work to classify a price bar as being controlled by either the bears or the bulls. If a price bar is controlled by the bears it is said to be a better investment. The Dominance Suite works by applying a moving average to the balance of power. This is the way TradingView has intended the balance of power to be used, and works quite nicely in classifying individual price bars as either bearish or bullish. It's not an overall trend indicator as much as it states whether a bar is mostly controlled by the bears or the bulls.
Here are the oscillators found within the Dominance Suite:
SMA of BOP
EMA of BOP
HMA of BOP
WMA of BOP
VWMA of BOP
TEMA of BOP
LSMA of BOP
Within the script, there is an input for a negative threshold. When each of these 7 oscillators is in confluence and below this set threshold, the Prop Long will be allowed to pass as a real trade.
Keep in mind that each filtering suite also has the option to overload signals.
So not only can you filter signals based on these suites but you can also apply additional volume scaling to signals that don't get filtered.
Here we have the True Oscillator. The True Oscillator is a brand new oscillator. It's similar to things like the RSI or DPO, but technically speaking it considers many more factors into its average than other oscillators. It considers balance of power, sentiment, volume, momentum, gravity, and places special-strategic weighting on price data based on whether it's opening, closing, high, or low. If you stack the True Oscillator up with the RSI you'll notice right away they look similar, but each movement is quite different. Overall the movements are more balanced, the individual bars are more consistent with price data, and the swings are more clearly pronounced while simultaneously having a better register of strength in momentum. We use this indicator to filter and overload signals, to trade according to momentum, and to provide a 16th independent oscillator that can check the OBOS Heatmap without having to be confluent.
The final filtering suite is based on Net Volume. It classifies signals as oversold when there is a significant negative trend in net volume. If Net Volume is under 0, and trends downward for either 3, 4, or 5 bars in a row then it will mark a signal as oversold and allow it to pass. Then, if overloading for this suite is turned on it will allocate more volume to signals it does not filter out.
There is a lot that can be said about this strategy. The primary takeaway though is that it's not just one strategy. It's a tool for everyone, to help them plan their approach to different assets in different market climates. This tool can help you study current market conditions. It can allow you to plan a strategic approach to market segments, and see how your strategy would fare if new market data performed similarly. It's not just one strategy, but more of a strategy printer.
The Origin Suite allows users to plan the positioning of their signals. The Overbought & Oversold Suite allows users to filter their signals based on whether or not they are oversold. The Dominance Suite allows users to filter signals based on whether the market is being controlled by the bears or the bulls. The True Oscillator gives users the ability to filter signals based on a deep and powerful momentum oscillator. The Net Volume Suite lets users filter signals based on volume trends. When signals are filtered, signals that pass, can be overloaded with additional volume scaling. Features like Change-Based Volume Scaling and Position Average Volume Scaling give users plenty of inputs to create complex volume scaling strategies. Common-sense DCA inputs allow users to scale into markets the way pros do.
The Broadview Economic Studio is a powerful tool for planning trades with complex volume scaling strategies.
Users can plan their approach to different kinds of markets. They can link the script with their bot or broker like 3Commas, and the script will automatically send the correct volume scaling through to the bot.
Thank you for your time, and for reading the description of the Broadview Economic Studio.

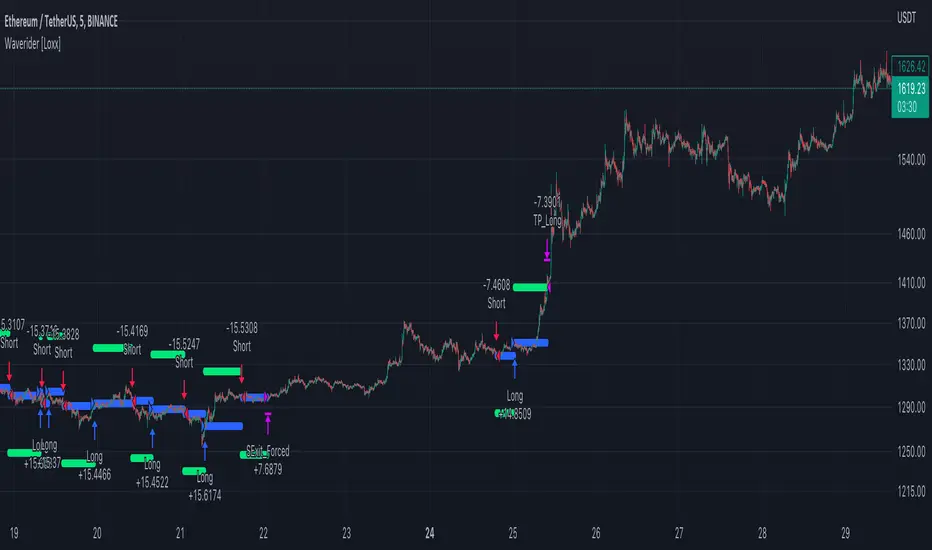
Waverider [Loxx]Waverider is a momentum strategy that probes historical data to find the optimal entries based on measures of volatility and gaussian adaptive filtering. To accomplish this, after each successful trade, XX trades will be skipped until a specific loss count is achieved after which the strategy will activate again, searching for the next trade.
Features
Select long/short profit target and stoploss by %
Skip weekends
Toggle on/off adaptive divergence detection and forced exit
SuperATR 7-Step Profit - Strategy [presentTrading] Long time no see!
█ Introduction and How It Is Different
The SuperATR 7-Step Profit Strategy is a multi-layered trading approach that integrates adaptive Average True Range (ATR) calculations with momentum-based trend detection. What sets this strategy apart is its sophisticated 7-step take-profit mechanism, which combines four ATR-based exit levels and three fixed percentage levels. This hybrid approach allows traders to dynamically adjust to market volatility while systematically capturing profits in both long and short market positions.
Traditional trading strategies often rely on static indicators or single-layered exit strategies, which may not adapt well to changing market conditions. The SuperATR 7-Step Profit Strategy addresses this limitation by:
- Using Adaptive ATR: Enhances the standard ATR by making it responsive to current market momentum.
- Incorporating Momentum-Based Trend Detection: Identifies stronger trends with higher probability of continuation.
- Employing a Multi-Step Take-Profit System: Allows for gradual profit-taking at predetermined levels, optimizing returns while minimizing risk.
BTCUSD 6hr Performance
█ Strategy, How It Works: Detailed Explanation
The strategy revolves around detecting strong market trends and capitalizing on them using an adaptive ATR and momentum indicators. Below is a detailed breakdown of each component of the strategy.
🔶 1. True Range Calculation with Enhanced Volatility Detection
The True Range (TR) measures market volatility by considering the most significant price movements. The enhanced TR is calculated as:
TR = Max
Where:
High and Low are the current bar's high and low prices.
Previous Close is the closing price of the previous bar.
Abs denotes the absolute value.
Max selects the maximum value among the three calculations.
🔶 2. Momentum Factor Calculation
To make the ATR adaptive, the strategy incorporates a Momentum Factor (MF), which adjusts the ATR based on recent price movements.
Momentum = Close - Close
Stdev_Close = Standard Deviation of Close over n periods
Normalized_Momentum = Momentum / Stdev_Close (if Stdev_Close ≠ 0)
Momentum_Factor = Abs(Normalized_Momentum)
Where:
Close is the current closing price.
n is the momentum_period, a user-defined input (default is 7).
Standard Deviation measures the dispersion of closing prices over n periods.
Abs ensures the momentum factor is always positive.
🔶 3. Adaptive ATR Calculation
The Adaptive ATR (AATR) adjusts the traditional ATR based on the Momentum Factor, making it more responsive during volatile periods and smoother during consolidation.
Short_ATR = SMA(True Range, short_period)
Long_ATR = SMA(True Range, long_period)
Adaptive_ATR = /
Where:
SMA is the Simple Moving Average.
short_period and long_period are user-defined inputs (defaults are 3 and 7, respectively).
🔶 4. Trend Strength Calculation
The strategy quantifies the strength of the trend to filter out weak signals.
Price_Change = Close - Close
ATR_Multiple = Price_Change / Adaptive_ATR (if Adaptive_ATR ≠ 0)
Trend_Strength = SMA(ATR_Multiple, n)
🔶 5. Trend Signal Determination
If (Short_MA > Long_MA) AND (Trend_Strength > Trend_Strength_Threshold):
Trend_Signal = 1 (Strong Uptrend)
Elif (Short_MA < Long_MA) AND (Trend_Strength < -Trend_Strength_Threshold):
Trend_Signal = -1 (Strong Downtrend)
Else:
Trend_Signal = 0 (No Clear Trend)
🔶 6. Trend Confirmation with Price Action
Adaptive_ATR_SMA = SMA(Adaptive_ATR, atr_sma_period)
If (Trend_Signal == 1) AND (Close > Short_MA) AND (Adaptive_ATR > Adaptive_ATR_SMA):
Trend_Confirmed = True
Elif (Trend_Signal == -1) AND (Close < Short_MA) AND (Adaptive_ATR > Adaptive_ATR_SMA):
Trend_Confirmed = True
Else:
Trend_Confirmed = False
Local Performance
🔶 7. Multi-Step Take-Profit Mechanism
The strategy employs a 7-step take-profit system
█ Trade Direction
The SuperATR 7-Step Profit Strategy is designed to work in both long and short market conditions. By identifying strong uptrends and downtrends, it allows traders to capitalize on price movements in either direction.
Long Trades: Initiated when the market shows strong upward momentum and the trend is confirmed.
Short Trades: Initiated when the market exhibits strong downward momentum and the trend is confirmed.
█ Usage
To implement the SuperATR 7-Step Profit Strategy:
1. Configure the Strategy Parameters:
- Adjust the short_period, long_period, and momentum_period to match the desired sensitivity.
- Set the trend_strength_threshold to control how strong a trend must be before acting.
2. Set Up the Multi-Step Take-Profit Levels:
- Define ATR multipliers and fixed percentage levels according to risk tolerance and profit goals.
- Specify the percentage of the position to close at each level.
3. Apply the Strategy to a Chart:
- Use the strategy on instruments and timeframes where it has been tested and optimized.
- Monitor the positions and adjust parameters as needed based on performance.
4. Backtest and Optimize:
- Utilize TradingView's backtesting features to evaluate historical performance.
- Adjust the default settings to optimize for different market conditions.
█ Default Settings
Understanding default settings is crucial for optimal performance.
Short Period (3): Affects the responsiveness of the short-term MA.
Effect: Lower values increase sensitivity but may produce more false signals.
Long Period (7): Determines the trend baseline.
Effect: Higher values reduce noise but may delay signals.
Momentum Period (7): Influences adaptive ATR and trend strength.
Effect: Shorter periods react quicker to price changes.
Trend Strength Threshold (0.5): Filters out weaker trends.
Effect: Higher thresholds yield fewer but stronger signals.
ATR Multipliers: Set distances for ATR-based exits.
Effect: Larger multipliers aim for bigger moves but may reduce hit rate.
Fixed TP Levels (%): Control profit-taking on smaller moves.
Effect: Adjusting these levels affects how quickly profits are realized.
Exit Percentages: Determine how much of the position is closed at each TP level.
Effect: Higher percentages reduce exposure faster, affecting risk and reward.
Adjusting these variables allows you to tailor the strategy to different market conditions and personal risk preferences.
By integrating adaptive indicators and a multi-tiered exit strategy, the SuperATR 7-Step Profit Strategy offers a versatile tool for traders seeking to navigate varying market conditions effectively. Understanding and adjusting the key parameters enables traders to harness the full potential of this strategy.

Strategy Myth-Busting #6 - PSAR+MA+SQZMOM+HVI - [MYN]This is part of a new series we are calling "Strategy Myth-Busting" where we take open public manual trading strategies and automate them. The goal is to not only validate the authenticity of the claims but to provide an automated version for traders who wish to trade autonomously.
Our sixth one we are automating is " I Tested ''7% Profit Per Day" Scalping Strategy 100 Times ( Unexpected Results ) " from " TradeIQ " which claims to have made 175% profit on the 5 min chart of BTCUSD with a having a 61% win rate in just 32 days.
Originally, we mimicked verbatim the indicators and settings TradeIQ was using however weren't getting promising results anything close to the claim so we decided to try and improve on it. We changed the static Parabolic SAR to be adaptive based upon the timeframe. We did this by using an adjustable multiplier for the PSAR Max. Also, In TradeIQ's revised version he substituted Hawkeye's Volume Indicator in lieu of Squeeze Momentum. We found that including both indicators we were getting better results so included them both. Feel free to experiment more. Would love to see how this could be improved on.
This strategy uses a combination of 4 open-source public indicators:
Parabolic Sar (built in)
10 in 1 MA's by hiimannshu
Squeeze Momentum by lazybear
HawkEYE Volume Indicator by lazybear
Trading Rules
5m timeframe and above. We saw equally good results in the higher (3h - 4h) timeframes as well.
Long Entry:
Parabolic Sar shifts below price at last dot above and then previous bar needs to breach above that.
Price action has to be below both MA's and 50MA needs to be above 200MA
Squeeze Momentum needsd to be in green or close to going green
HawkEYE Volume Indicator needs to be show a green bar on the histagram
Short Entry:
Parabolic Sar shifts above price at last dot below and then previous bar needs to breach below that.
Price action needs to be above both MA's and 50MA needs to be below 200MA
Squeeze Momentum needsd to be in red or close to going red
HawkEYE Volume Indicator needs to be show a red bar on the histagram
If you know of or have a strategy you want to see myth-busted or just have an idea for one, please feel free to message me.

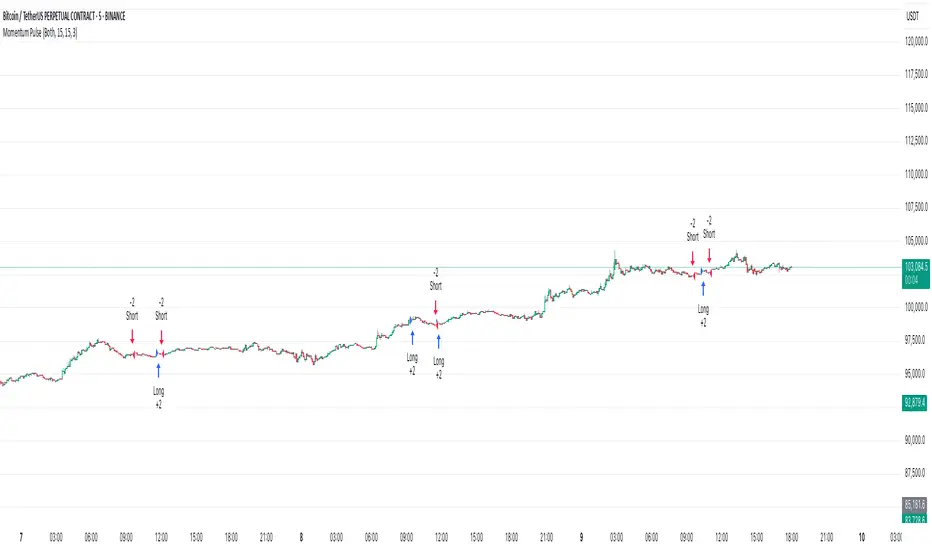
Momentum PulseMomentum Pulse Strategy for NIFTY & SENSEX CE/PE Options
This strategy is designed specifically for NIFTY and SENSEX Call (CE) and Put (PE) options. It generates long entry signals and long exits based on momentum filters, making it ideal for options with an opening price between 150-200.
Key Features:
Focus on CE and PE: The strategy should be applied on both CE and PE options of the same index.
Capital Allocation : Use 30% of your capital for CE and 30% for PE positions , ensuring balanced risk distribution.
Entry & Exit : The strategy signals only long entries and long exits based on momentum.
Stop-Loss : A 15% stop-loss is recommended to protect against excessive drawdown.
Note : This strategy is tailored for intraday trading, and it works best when used with disciplined risk management practices.
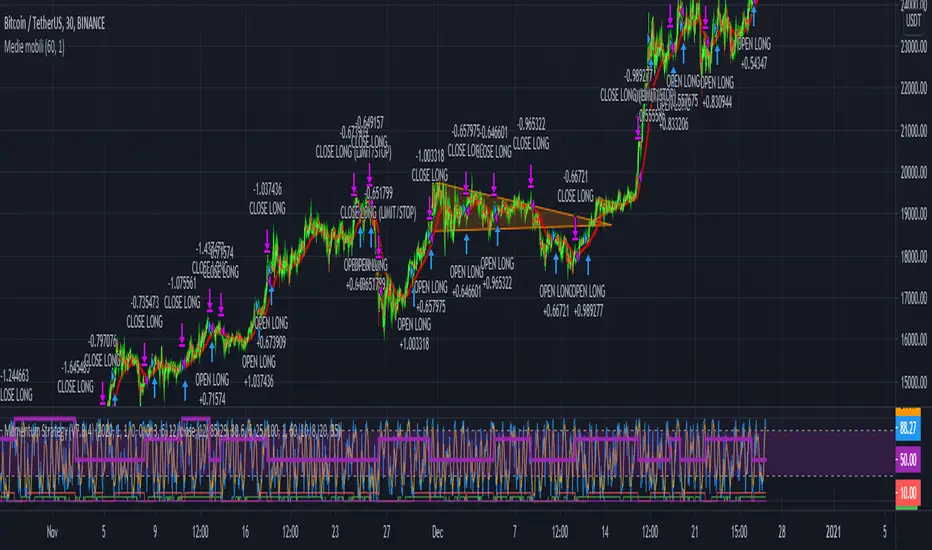
Momentum Line StrategyI got the idea of an algorithm using a gap, which would behave a bit like RSI, therefore I called it momentum. Don't know if it's very useful or how to improve it, it can keeps you in trends, however it suffers from whipsawing. My first attempt in programming a strategy.

Z-Score RSI StrategyOverview
The Z-Score RSI Indicator is an experimental take on momentum analysis. By applying the Relative Strength Index (RSI) to a Z-score of price data, it measures how far prices deviate from their mean, scaled by standard deviation. This isn’t your traditional use of RSI, which is typically based on price data alone. Nevertheless, this unconventional approach can yield unique insights into market trends and potential reversals.
Theory and Interpretation
The RSI calculates the balance between average gains and losses over a set period, outputting values from 0 to 100. Typically, people look at the overbought or oversold levels to identify momentum extremes that might be likely to lead to a reversal. However, I’ve often found that RSI can be effective for trend-following when observing the crossover of its moving average with the midline or the crossover of the RSI with its own moving average. These crossovers can provide useful trend signals in various market conditions.
By combining RSI with a Z-score of price, this indicator estimates the relative strength of the price’s distance from its mean. Positive Z-score trends may signal a potential for higher-than-average prices in the near future (scaled by the standard deviation), while negative trends suggest the opposite. Essentially, when the Z-Score RSI indicates a trend, it reflects that the Z-score (the distance between the average and current price) is likely to continue moving in the trend’s direction. Generally, this signals a potential price movement, though it’s important to note that this could also occur if there’s a shift in the mean or standard deviation, rather than a meaningful change in price itself.
While the Z-Score RSI could be an insightful addition to a comprehensive trading system, it should be interpreted carefully. Mean shifts may validate the indicator’s predictions without necessarily indicating any notable price change, meaning it’s best used in tandem with other indicators or strategies.
Recommendations
Before putting this indicator to use, conduct thorough backtesting and avoid overfitting. The added parameters allow fine-tuning to fit various assets, but be careful not to optimize purely for the highest historical returns. Doing so may create an overly tailored strategy that performs well in backtests but fails in live markets. Keep it balanced and look for robust performance across multiple scenarios, as overfitting is likely to lead to disappointing real-world results.

Denario momentum strategy Momentum strategy based on early trend detection indicator. It oscillates in the range . Negative values correspond to downtrend, positive to uptrend.
Values closer to 0 correspond to noise. You can set threshold values for long/short entry and exit.
But like any other momentum indicator use it along with extra filters to confirm entry and exit.

Momentum Strategy, rev.2This is a revised version of the Momentum strategy listed in the built-ins.
For more information check out this resource:
www.forexstrategiesresources.com

T&M/E Wave V2Trend and Momentum With Exception Wave Indicator and Strategy:
This strategy is hand made and I have spent days and many hours making it. The strategy is meant to determine the power between buyers and sellers, match the current power with a historic trend (through a moving average statistical equation), and finally volatility (measured with a mix between standard deviation from Bollinger Bands and HPV). Below will be a list of how to determine the inputs for the indicator
**For reference, all numbers, and settings displayed on the input screen are only what I HAVE FOUND to be profitable for my own strategy, Yours will differ. This is not financial advice and I am not a financial advisor. Please do your due diligence and own research before considering taking entries based on this strategy and indicator. I am not advertising investing, trading, or skills untaught, this is simply to help incorporate into your own strategy and improve your trading journey!**
INPUTS:
EV: This is an integer value set to default at 55. This value is equated to the lead value, volatility measurement, and standard deviation between averages
EV 2: This integer is used as the base value and is meant to always be GREATER THEN EV, the default is set at 163. There should be at least a 90+ integer difference between EVs for data accuracy.
EV TYPE & EV TYPE 2: This option only affects the output for the moving average histograms. (and data inserted for strategy)
Volatility Smoothing: This is the smoothness of the custom-made volatility oscillator. I have this default at 1 to show time-worthy-term (3.9%+) moves or significant trends to correspond with the standard deviation declination between EVMA and EVMA2.
Directional Length: This is the amount of data observed per candle in the bull versus bear indicator.
Take Profit: Pre-set takes profit level that is set to 4 but can be adjusted for user experience.
Style:
Base Length: Columns equated using a custom-made statistical equation derived from EV TYPE 2+EV2 to determine a range of differential in historic averages to a micro-scale.
Lead Length: Columns equated using a custom-made statistical equation derived from EV TYPE+EV to determine a range of differential in historic averages to a micro-scale.
Weighted EMA Differential: Equation expressing the differences between exponential and simple averages derived from EV+EV Type 2. Default is displaying none, but optional for use if found helpful.
Volatility: Represents volatility from multiple data sets spanning from Bollinger bands to HPV and translated through smoothing.
Bull Strength: The strength of Bulls in the current trend is derived from a DMI+RSI+MACD equation to represent where the trend lies.
Bear Strength: The strength of Bears in the current trend is derived from a DMI+RSI+MACD equation to represent where the trend lies.
CHEAT CODE'S NOTES:
Do not use this indicator on high leverage. I have personally used this indicator for a week and faced a max of 8% drawdown, albeit painful I was on low leverage and still closed on my take profit level.
85% is not 100% do not overtrade using this indicator's entry conditions if you have made 4 consecutive profitable trades.
Mess around with the input values and let me know if you find an even BETTER hit rate, 30+ entries and a good drawdown!!
V2 UPGRADES:
*Increased Opacity on Bull Bear Columns
*Removed the Stop Loss Input option
*Decreased EV2 to a default of 143 for accuracy
*Added additional disclaimers in the description
* Removed Bull/Bear offset values for accuracy
-Cheat Code
BYBIT:BTCUSDT

NRTH_ Smart SignalsA Custom Unique indicator by NRTH_
Comes included with the Premium Package.
NRTH_ Smart Signals is made up of over 5+ indicators and custom calculation methods. Get access to a full set of trading tools & relevant data all within one indicator to give you the levels of confluence you need.
Smart Signals works in any market & allows users to:
Detect the direction of trends in the price using two different algorithms designed for both trend following and contrarian traders.
Get automatic pivot point levels in real-time.
Filter out noise with the MA Trend Filter
Built-In Alerts
Visual Risk Management
Customizable Entry Rules
2 Calculation Methods
Get Confirmation
Use our MA Trend filter to detect the direction of trends for any asset & on any timeframe allowing traders to increase their confidence in positions and follow trends. The larger the cloud, the larger the trend.
Choose between the two calculation methods:
Leading
More sensitive
Designed to predict moves based on market data
Lagging
Less sensitive
Waits for confirmation signals
Both calculation methods have the possibility to adjust the sensitivity of these signals to market price variations, as well as the option to make them less sensitive to ranging markets so that you can trade only the variations you want.
The algo uses both momentum and trend calculation to find an entry, highly recommended use with the built-in MA Filter for best results.
Trade 24/7 without pressing a button
Smart Signals has integrated alerts which give you the ability to automate your signals with 3rd party applications. Simply adjust the sensitivities for your market and trade on autopilot.
You can also use Heikin Ashi Charts with the algo IF you only place limit orders on the exact price line that the trade outputs to ensure accurate real-time results
(Heikin Ashi trading is NOT recommended for automated trading, manual limit orders must be placed in order to match real-time results with backtested data)
Backtesting Results Info
Period 7/7/2021-15/11/2021
Entry value at $1000 with 10x leverage
Binance standard taker fee rate (0.04%)
ATR Exits : 1:2 RR
-------------------------------------------
Disclaimer
Copyright NRTH_ Indicators 2021.
NRTH_ and all affiliated parties are not registered as financial advisors. The products & services NRTH_ offers are for educational purposes only and should not be construed as financial advice. You must be aware of the risks and be willing to bear any level of risk to invest in financial markets. Past performance is not necessarily indicative of future results. NRTH_ and all individuals associated assume no responsibility for your trading results or investments.
All investments involve risk, and the past performance of a security, industry, sector, market, financial product, trading strategy, or individual’s trading does not guarantee future results or returns. Investors are fully responsible for any investment decisions they make. Such decisions should be based solely on an evaluation of their financial circumstances, investment objectives, risk tolerance, and liquidity needs.
Instagram

Crypto Squeeze StrategyThis strategy was inspired by two famous Trading View contributors. Shout out to Lazy Bear and Crypto Face!
The strategy includes a similar replication of the blue wave, and MFI indicator. The point of the strategy is to buy when the blue wave crosses up the zero value, and the MFI is greater than zero value. This indicates that there is strong bullish momentum and money flowing into the market.

Momentum Trading By Mahfuz AzimA following indicator is Momentum Trading that uses fast QQE crosses with Moving Averages
Use for trend direction filtering. QQE or Qualitative Quantitative Estimation is based
Relative strength index (RSI), but uses a smoothing technique as an additional transformation. Three crosses can be selected (all selected by default)
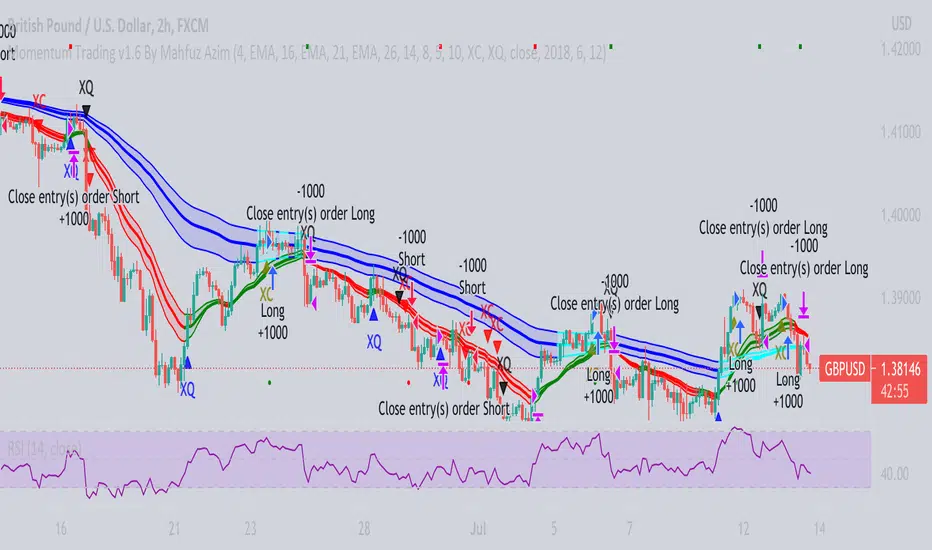
Momentum StrategyThis strategy uses momentum to determine when to enter and exit positions. The default settings are set to look for a new 63 day high (~1 trading quarter) and a new 40 day relative high. If the stock is trending above the 50 day moving average it is a candidate to be bought. Stops are triggered when price closes below the 20 day or 50 day EMAs depending on how well the stock is trending. A stop could also be triggered even if price continues to move up, but is breaking down on a relative basis to a benchmark either SPX or BTCUSD . The goal is to hold on to our winners for as long as possible and cut the losers as soon as possible. This will alow us to capture the majority of major trends while avoiding many large drawdown and relative losers.

Momentum Strategy (BTC/USDT; 30m) - STOCH RSI (with source code)Here's a strategy for low time frames (30min suggested) for BTC , based on momentum Analysis using Stochastic RSI
By default the strategy will use the 50% of the specified capital for each trade; if "Gamble Sizing" is enabled, it will add the specified amount of capital (25% by default, until reaching the 100% limit or lower) for the next trade after having detected a loss in the previous trade; if the next trade is successful, the size for the next trade comes back to 50%
• Trend Filter LONG: If the fast exponential moving average is UNDER the slow exponential moving average , it won't open LONG positions
• Trend Filter SHORT: If the fast exponential moving average is ABOVE the slow exponential moving average , it won't open SHORT positions
• Bars delay: the strategy will wait the specified amount of bars before closing the current position; the counter is triggered as soon as the closing trade condition is verified
BY MAKING USE OF THIS STRATEGY, YOU ACKNOWLEDGE AND AGREE THAT: (1) YOU ARE AWARE OF THE RISKS ASSOCIATED WITH TRANSACTIONS OF DIGITAL CURRENCIES AND THEIR DERIVATIVES; (2) YOU SHALL ASSUME ALL RISKS RELATED TO THE USE OF THIS STRATEGY AND TRANSACTIONS OF DIGITAL CURRENCIES AND THEIR DERIVATIVES; AND (3) I SHALL NOT BE LIABLE FOR ANY SUCH RISKS OR ADVERSE OUTCOMES.
SOURCE CODE BELOW

Momentum Strategy for cryptos (V7.B.4)Here's a strategy for low time frames (30min suggested) for BTC, based on momentum Analysis using Stochastic RSI
By default the strategy will use the 50% of the specified capital for each trade; if "Gamble Sizing" is enabled, it will add the specified amount of capital (25% by default, until reaching the 100% limit or lower) for the next trade after having detected a loss in the previous trade; if the next trade is successful, the size for the next trade comes back to 50%
• Trend Filter LONG: If the fast exponential moving average is UNDER the slow exponential moving average, it won't open LONG positions
• Trend Filter SHORT: If the fast exponential moving average is ABOVE the slow exponential moving average, it won't open SHORT positions
• Bars delay: the strategy will wait the specified amount of bars before closing the current position; the counter is triggered as soon as the closing trade condition is verified
BY MAKING USE OF THIS STRATEGY, YOU ACKNOWLEDGE AND AGREE THAT: (1) YOU ARE AWARE OF THE RISKS ASSOCIATED WITH TRANSACTIONS OF DIGITAL CURRENCIES AND THEIR DERIVATIVES; (2) YOU SHALL ASSUME ALL RISKS RELATED TO THE USE OF THIS STRATEGY AND TRANSACTIONS OF DIGITAL CURRENCIES AND THEIR DERIVATIVES; AND (3) I SHALL NOT BE LIABLE FOR ANY SUCH RISKS OR ADVERSE OUTCOMES.

Momentum fader 1.0The strategy is based on a momentum gauge designed for lower timeframes. In the current iteration, trades are very conservative and closed quickly.
In a future version, I've planned to implement dynamic take profit and stoploss levels for ultimate accuracy and maximized profit:drawdown ratio.
The strategy is specifically made for ETH and works best on the 3-minute timeframe.
Enjoy!
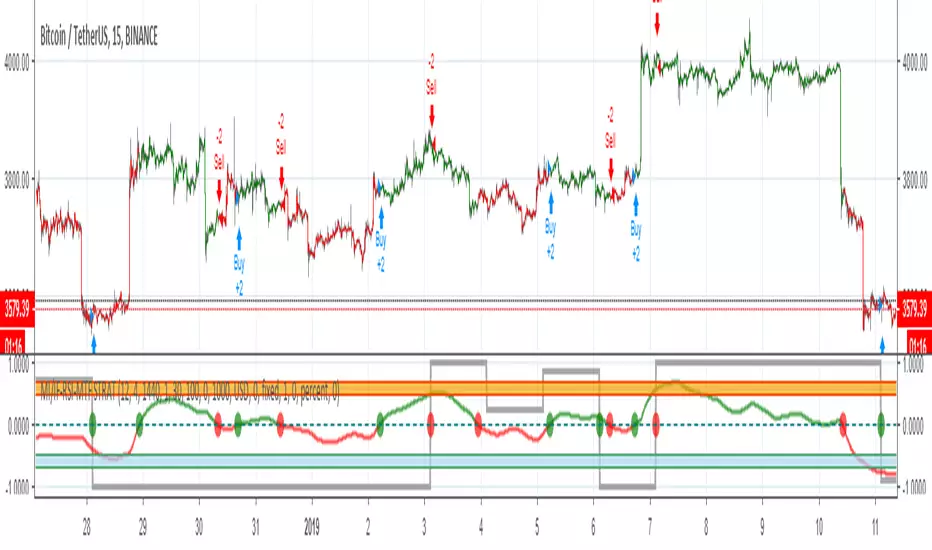
MOMENTUM INDICATOR / INVERS FISHER / RSI / MTF / STRAT// Strategy based on Momentum indicator and Inverse Fisher transform with Multi Time Frame function on Relative Strength Index (RSI)
// Greatest effect on 15M+ time frame
// Created and based on Binance chart
// Working with comission
// No repaints
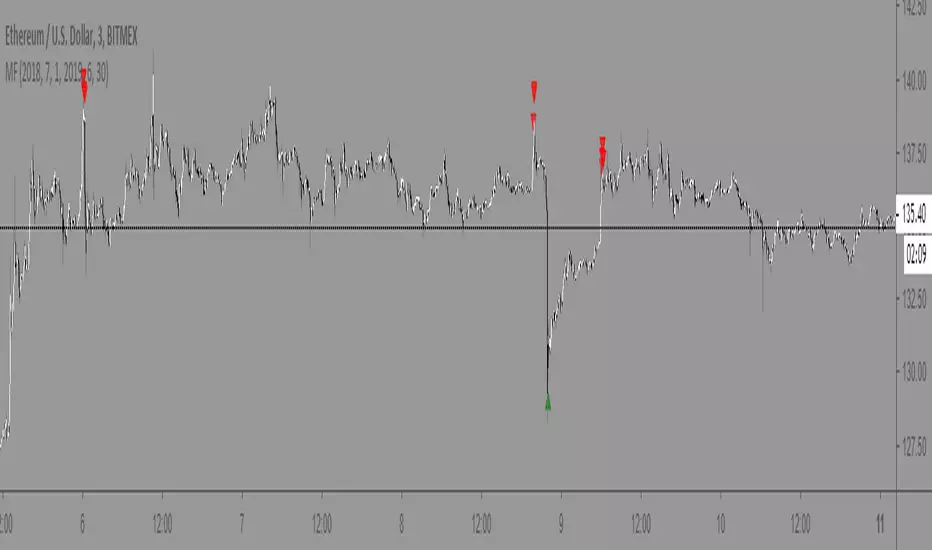
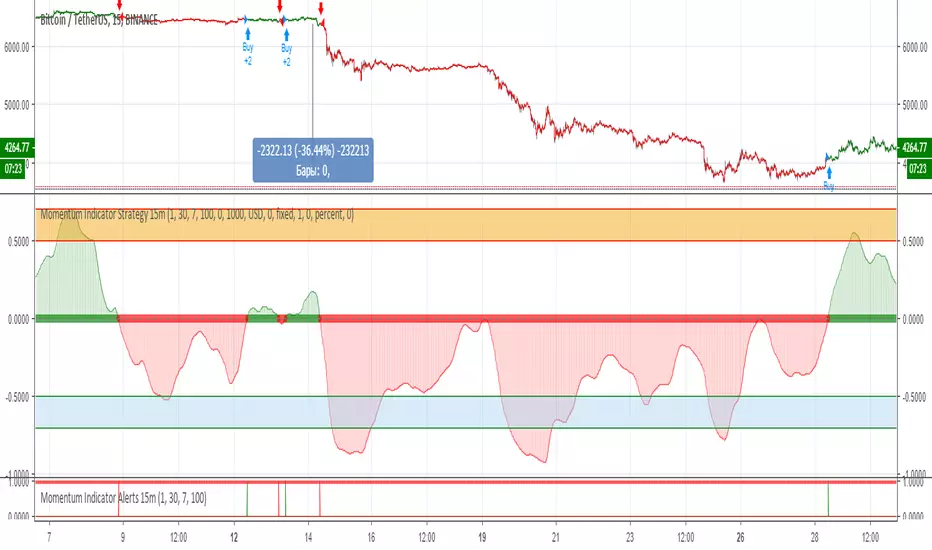
Momentum Indicator Strategy 15m// Strategy based on Momentum Indicator
// Greatest effect on 15M time frame
// Created and based on Binance chart
// Working with comission
// No repaints
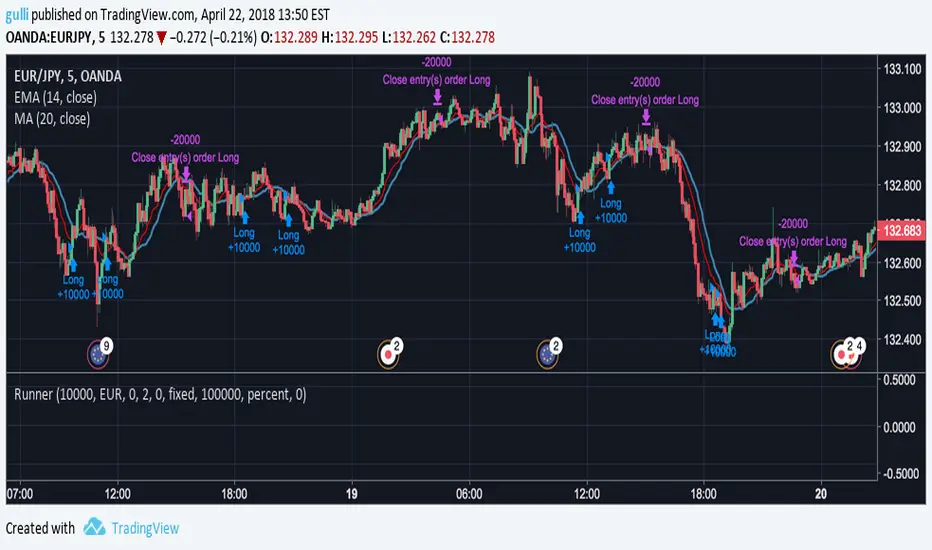
Runner 1.0This script uses moving average crosses together with momentum to try to optimalise entry and exit, based on the market info at that time.
It works best on the 5 minute chart, and pyramiding will increase profit - but lower the profit factor. Based on testing, it works with the most major currency pairs as well as commodities.
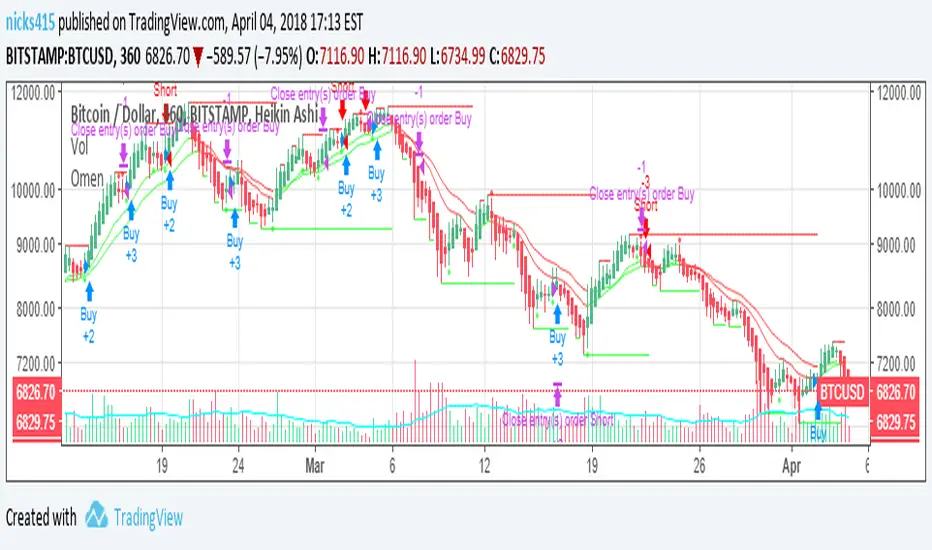
OmenImproved momentum-based trading algorithm based on my previous Merlin V6 script. Adjusted trade filtering rules to improve net return and profit factor on both long and short positions.
Works best with mid time-frame Heikin-Ashi data.
Gabriel's Witcher Strategy [65 Minute Trading Bot]Strategy Description: Gabriel's Witcher Strategy
Author: Gabriel
Platform: TradingView Pine Script (Version 5)
Backtested Asset: Avalanche (Coinbase Brokage for Volume adjustment)
Timeframe: 65 Minutes
Strategy Type: Comprehensive Trend-Following and Momentum Strategy with Scalping and Risk Management Features
Overview
Gabriel's Witcher Strategy is an advanced trading bot designed for the Avalanche pair on a 65-minute timeframe. This strategy integrates a multitude of technical indicators to identify and execute high-probability trading opportunities. By combining trend-following, momentum, volume analysis, and range filtering, the strategy aims to capitalize on both long and short market movements. Additionally, it incorporates scalping mechanisms and robust risk management features, including take-profit (TP) levels and commission considerations, to optimize trade performance and profitability.
====Key Components====
Source Selection:
Custom Source Flexibility: Allows traders to select from a wide range of price and volume sources (e.g., Close, Open, High, Low, HL2, HLC3, OHLC4, VWAP, On-Balance Volume, etc.) for indicator calculations, enhancing adaptability to various trading styles.
Various curves of Volume Analysis are employed:
Tick Volume Calculation: Utilizes tick volume as a fallback when actual volume data is unavailable, ensuring consistency across different data feeds.
Volume Indicators: Incorporates multiple volume-based indicators such as On-Balance Volume (OBV), Accumulation/Distribution (AccDist), Negative Volume Index (NVI), Positive Volume Index (PVI), and Price Volume Trend (PVT) for comprehensive market analysis.
Trend Indicators:
ADX (Average Directional Index): Measures trend strength using either the Classic or Masanakamura method, with customizable length and threshold settings. It's used to open positions when the mesured trend is strong, or exit when its weak.
Jurik Moving Average (JMA): A smooth moving average that reduces lag, configurable with various parameters including source, resolution, and repainting options.
Parabolic SAR: Identifies potential reversals in market trends with adjustable start, increment, and maximum settings.
Custom Trend Indicator: Utilizes highest and lowest price points over a specified timeframe to determine current and previous trend bases, visually represented with color-filled areas.
Momentum Indicators:
Relative Strength Index (RSI): Evaluates the speed and change of price movements, smoothed with a custom length and source. It's used to not enter the market for shorts in oversold or longs for overbought conditions, and to enter for long in oversold or shorts for overboughts.
Momentum-Based Calculations: Employs both Double Exponential Moving Averages (DEMA) on a MACD-based RSI to enhance momentum signal accuracy which is then further accelerated by a Hull MA. This is the technical analysis tool that determines bearish or bullish momentum.
OBV-Based Momentum Conditions: Uses two exponential moving averages of OBV to determine bullish or bearish momentum shifts, anomalities, breakouts where banks flow their funds in or Smart Money Concepts trade.
Moving Averages (MA):
Multiple MA Types: Includes Simple Moving Average (SMA), Exponential Moving Average (EMA), Weighted Moving Average (WMA), Hull Moving Average (HMA), and Volume-Weighted Moving Average (VWMA), selectable via input parameters.
MA Speed Calculation: Measures the percentage change in MA values to determine the direction and speed of the trend.
Range Filtering:
Variance-Based Filter: Utilizes variance and moving averages to filter out trades during low-volatility periods, enhancing trade quality.
Color-Coded Range Indicators: Visualizes range filtering with color changes on the chart for quick assessment.
Scalping Mechanism:
Heikin-Ashi Candles: Optionally uses Heikin-Ashi candles for smoother price action analysis.
EMA-Based Trend Detection: Employs fast, medium, and slow EMAs to determine trend direction and potential entry points.
Fractal-Based Filtering: Detects regular or BW (Black & White) fractals to confirm trade signals.
Take Profit (TP) Management:
Dynamic TP Levels: Calculates TP levels based on the number of consecutive long or short entries, adjusting targets to maximize profits.
TP Signals and Re-Entry: Plots TP signals on the chart and allows for automatic re-entry upon TP hit, maintaining continuous trade flow.
Risk Management:
Commission Integration: Accounts for trading commissions to ensure net profitability.
Position Sizing: Configured to use a percentage of equity for each trade, adjustable via input parameters.
Pyramiding: Allows up to one additional position per direction to enhance gains during strong trends.
Alerts and Visual Indicators:
Buy/Sell Signals: Plots visual indicators (triangles and flags) on the chart to signify entry and TP points.
Bar Coloring: Changes bar colors based on ADX and trend conditions for immediate visual cues.
Price Levels: Marks significant price levels related to TP and position entries with cross styles.
Input Parameters
Source Settings:
Custom Sources (srcinput): Choose from various price and volume sources to tailor indicator calculations.
ADX Settings:
ADX Type (ADX_options): Select between 'CLASSIC' and 'MASANAKAMURA' methods.
ADX Length (ADX_len): Defines the period for ADX calculation.
ADX Threshold (th): Sets the minimum ADX value to consider a strong trend.
RSI Settings:
RSI Length (len_3): Period for RSI calculation.
RSI Source (src_3): Source data for RSI.
Trend Strength Settings:
Channel Length (n1): Period for trend channel calculation.
Average Length (n2): Period for smoothing trend strength.
Jurik Moving Average (JMA) Settings:
JMA Source (inp): Source data for JMA.
JMA Resolution (reso): Timeframe for JMA calculation.
JMA Repainting (rep): Option to allow JMA to repaint.
JMA Length (lengths): Period for JMA.
Parabolic SAR Settings:
SAR Start (start): Initial acceleration factor.
SAR Increment (increment): Acceleration factor increment.
SAR Maximum (maximum): Maximum acceleration factor.
SAR Point Width (width): Visual width of SAR points.
Trend Indicator Settings:
Trend Timeframe (timeframe): Period for trend indicator calculations.
Momentum Settings:
Source Type (srcType): Select between 'Price' and 'VWAP'.
Momentum Source (srcPrice): Source data for momentum calculations.
RSI Length (rsiLen): Period for momentum RSI.
Smooth Length (sLen): Smoothing period for momentum RSI.
OBV Settings:
OBV Line 1 (e1): EMA period for OBV line 1.
OBV Line 2 (e2): EMA period for OBV line 2.
Moving Average (MA) Settings:
MA Length (length): Period for MA calculations.
MA Type (matype): Select MA type (1: SMA, 2: EMA, 3: HMA, 4: WMA, 5: VWMA).
Range Filter Settings:
Range Filter Length (length0): Period for range filtering.
Range Filter Multiplier (mult): Multiplier for range variance.
Take Profit (TP) Settings:
TP Long (tp_long0): Percentage for long TP.
TP Short (tp_short0): Percentage for short TP.
Scalping Settings:
Scalping Activation (ACT_SCLP): Enable or disable scalping.
Scalping Length (HiLoLen): Period for scalping indicators.
Fast EMA Length (fastEMAlength): Period for fast EMA in scalping.
Medium EMA Length (mediumEMAlength): Period for medium EMA in scalping.
Slow EMA Length (slowEMAlength): Period for slow EMA in scalping.
Filter (filterBW): Enable or disable additional fractal filtering.
Pullback Lookback (Lookback): Number of bars for pullback consideration.
Use Heikin-Ashi Candles (UseHAcandles): Option to use Heikin-Ashi candles for smoother trend analysis.
Strategy Logic
Indicator Calculations:
Volume and Source Selection: Determines the primary data source based on user input, ensuring flexibility and adaptability.
ADX Calculation: Computes ADX using either the Classic or Masanakamura method to assess trend strength.
RSI Calculation: Evaluates market momentum using RSI, further smoothed with custom periods.
Trend Strength Assessment: Utilizes trend channel and average lengths to gauge the robustness of current trends.
Jurik Moving Average (JMA): Smooths price data to reduce lag and enhance trend detection.
Parabolic SAR: Identifies potential trend reversals with adjustable parameters for sensitivity.
Momentum Analysis: Combines RSI with DEMA and OBV-based conditions to confirm bullish or bearish momentum.
Moving Averages: Employs multiple MA types to determine trend direction and speed.
Range Filtering: Filters out low-volatility periods to focus on high-probability trades.
Trade Conditions:
Long Entry Conditions:
ADX Confirmation: ADX must be above the threshold, indicating a strong uptrend.
RSI and Momentum: RSI below 70 and positive momentum signals.
JMA and SAR: JMA indicates an uptrend, and Parabolic SAR is below the price.
Trend Indicator: Confirms the current trend direction.
Range Filter: Ensures market is in an upward range.
Scalping Option: If enabled, additional scalping conditions must be met.
Short Entry Conditions:
ADX Confirmation: ADX must be above the threshold, indicating a strong downtrend.
RSI and Momentum: RSI above 30 and negative momentum signals.
JMA and SAR: JMA indicates a downtrend, and Parabolic SAR is above the price.
Trend Indicator: Confirms the current trend direction.
Range Filter: Ensures market is in a downward range.
Scalping Option: If enabled, additional scalping conditions must be met.
Position Management:
Entry Execution: Places long or short orders based on the identified conditions and user-selected position types (Longs, Shorts, or Both).
Take Profit (TP): Automatically sets TP levels based on predefined percentages, adjusting dynamically with consecutive trades.
Re-Entry Mechanism: Allows for automatic re-entry upon TP hit, maintaining active trading positions.
Exit Conditions: Closes positions when TP levels are reached or when opposing trend signals are detected.
Visual Indicators:
Bar Coloring: Highlights bars in green for bullish conditions, red for bearish, and orange for neutral.
Plotting Price Levels: Marks significant price levels related to TP and trade entries with cross symbols.
Signal Shapes: Displays triangle and flag shapes on the chart to indicate trade entries and TP hits.
Alerts:
Custom Alerts: Configured to notify traders of long entries, short entries, and TP hits, enabling timely trade management and execution.
Usage Instructions
Setup:
Apply the Strategy: Add the script to your TradingView chart set to BTCUSDT with a 65-minute timeframe.
Configure Inputs: Adjust the input parameters under their respective groups (e.g., Source Settings, ADX, RSI, Trend Strength, etc.) to match your trading preferences and risk tolerance.
Position Selection:
Choose Position Type: Use the Position input to select Longs, Shorts, or Both based on your market outlook.
Execution: The strategy will automatically execute and manage positions according to the selected type, ensuring targeted trading actions.
Signal Interpretation:
Buy Signals: Blue triangles below the bars indicate potential long entry points.
Sell Signals: Red triangles above the bars indicate potential short entry points.
Take Profit Signals: Flags above or below the bars signify TP hits for long and short positions, respectively.
Bar Colors: Green bars suggest bullish conditions, red bars indicate bearish conditions, and orange bars represent neutral or consolidating markets.
Risk Management:
Default Position Size: Set to 100% of equity. Adjust the default_qty_value as needed for your risk management strategy.
Commission: Accounts for a 0.1% commission per trade. Adjust the commission_value to match your broker's fees.
Pyramiding: Allows up to one additional position per direction to enhance gains during strong trends.
Backtesting and Optimization:
Historical Testing: Utilize TradingView's backtesting features to evaluate the strategy's performance over historical data.
Parameter Tuning: Optimize input parameters to align the strategy with current market dynamics and personal trading objectives.
Alerts Configuration:
Set Up Alerts: Enable and configure alerts based on the predefined alertcondition statements to receive real-time notifications of trade signals and TP hits.
Additional Features
Comprehensive Indicator Integration: Combines multiple technical indicators to provide a holistic view of market conditions, enhancing trade signal accuracy.
Scalping Options: Offers an optional scalping mechanism to capitalize on short-term price movements, increasing trading flexibility.
Dynamic Take Profit Levels: Adjusts TP targets based on the number of consecutive trades, maximizing profit potential during favorable trends.
Advanced Volume Analysis: Utilizes various volume indicators to confirm trend strength and validate trade signals.
Customizable Range Filtering: Filters trades based on market volatility, ensuring trades are taken during optimal conditions.
Heikin-Ashi Candle Support: Optionally uses Heikin-Ashi candles for smoother price action analysis and reduced noise.
====Recommendations====
Thorough Backtesting:
Historical Performance: Before deploying the strategy in a live trading environment, perform comprehensive backtesting to understand its performance under various market conditions. These are the premium settings for Avalanche Coinbase.
Optimization: Regularly review and adjust input parameters to ensure the strategy remains effective amidst changing market volatility and trends. Backtest the strategy for each crypto and make sure you are in the right brokage when using the volume sources as it will affect the overall outcome of the trading strategy.
Risk Management:
Position Sizing: Adjust the default_qty_value to align with your risk tolerance and account size.
Stop-Loss Implementation: Although the strategy includes TP levels, they're also consided to be a stop-loss mechanisms to protect against adverse market movements.
Commission Adjustment: Ensure the commission_value accurately reflects your broker's fees to maintain realistic backtesting results. Generally, 0.1~0.3% are most of the average broker's comission fees.
Slipage: The slip comssion is 1 Tick, since the strategy is adjusted to only enter/exit on bar close where most positions are available.
Continuous Monitoring:
Strategy Performance: Regularly monitor the strategy's performance to ensure it operates as expected and make adjustments as needed. A max-drawndown hit has been added to operate in case the premium Avalanche settings go wrong, but you can turn it off an adjust the equity percentage to 50% if you are confortable with the high volatile max-drown or even 100% if your account allows you to borrow cash.
Customization:
Indicator Parameters: Tailor indicator settings (e.g., ADX length, RSI period, MA types) to better fit your specific trading style and market conditions.
Scalping Options: Enable or disable scalping based on your trading preferences and risk appetite.
Conclusion
Gabriel's Witcher Strategy is a robust and versatile trading solution designed to navigate the complexities of the Crypto market. By integrating a wide array of technical indicators and providing extensive customization options, this strategy empowers traders to execute informed and strategic trades. Its comprehensive approach, combining trend analysis, momentum detection, volume evaluation, and range filtering, ensures that trades are taken during optimal market conditions. Additionally, the inclusion of scalping features and dynamic take-profit management enhances the strategy's adaptability and profitability potential. Unlike any trading strategy, with both diligent testing and continuous monitoring under the strategy tester, it's possible to achieve sustained success by adjusting the settings to the individual Crypto that need it, for example this one is preset for Avalanche Coinbase 65 Miinutes but it can be adjust for BTCUSD or Etherium if you backtest and search for the right settings.
