Strategy - Backtest Uber WAE - Waddah Attar Explosion [UTS]Backtest of WAE - Waddah Attar Explosion
Backtest with focus win/loss profitability.
Formula: profitability = win / (win+loss)
Default equity 100k USD
Default 2% Risk per trade
Default currency USD
Define backtest interval precisely by month, year, day
LONG and SHORT positions
Visualize SL and TP on chart
ATR (len: 14, smooth: SMA)
ATR based Stop-Loss, if hit trade will be closed and considered as loss
ATR based Take-Profit, if hit trade will be closed and considered as win
On TP or SL hit the trade is closed and marked as win/loss
Volatility

[astropark] 4h Crypto/USDT Strategy [strategy]Dear Followers,
today a new Swing and Scalper Tool , which works great for Cryptocurrencies on the USDT market on 4h timeframe .
This tool has some cool features:
it works on many timeframes, but best one is 4H timeframe : so you can enjoy both manual and bot trading by using a 24/7 running bot;
it comes in three working mode : default, alternative and high frequency ;
auto-stoploss: you can enable an stoploss in trade, bot will follow
It's always suggested to use a proper money and risk management in trades. This is not the "Holy Grail", it does not exist.
Strategy results are calculated from the beginning of 2018 till now, so more than 2 years, using 10000$ as initial capital and working at 1x leverage (no leverage at all!) and 0.1% trading fee already applied.
You can always DM me if you need any help to configure it on your preferred chart or if you want a customization of this bot for a specific pair.
This script will let you backtest this script and check profitability on your preferred market.
The alarms version of this indicator, which will let you set all notification alerts you may need in order to be alerted on each triggered signals, can be found by searching for astropark's "4h Crypto/USDT Strategy".
This is a premium indicator , so send me a private message in order to get access to this script.

KundaliniThe Kundalini is a technical indicator. Based on algorithm calculations, this indicator extrapolates the previous price for the next bar. Plus addition Multi time frame ATR volatility Reading environment for higher conditions
Here is how Dominator is calculated:
1. The study estimates the price projected for the next bar. The estimated price is based on the algorithm method.
2. The study extrapolates this value to find a projected price change for the next bar.
The resulting extrapolated value is shown as a histogram on a lower subgraph. By default, sections of the histogram where the extrapolated value is increasing are shown in green; sections corresponding to the decreasing value are shown in red.
Note: Value projection is purely mathematical as all calculations are based on algorithm averaging of previous values.
Overlay True
The strategy includes 3 different adjustable levels for the ladder , plus automatic adjustable stop loss and takes profit calculated from your average entry price after each ladder adds.
Adjustable BAcktest Window.
1 long signals
3 ladder long add signals
1 short signals
3 ladder short add signals
1 dynamic stop calculated from your average entry price
1 dynamic take profit calculated from your average entry price
Please Private Msg me if you like more info about the script Full pdf available or if you need access to it
thx for your time and support
Gap Trading Strategy: CME BitcoinI created a strategy which finds gaps on CME Futures market for Bitcoin, BTC1! and opens a long or short position on the crypto exchange depending on what kind of gap was found (up or down) on CME.
Up gap: today open price > previous day high price
Down gap: today open price < previous day low price
Two lines below the main chart show when gaps appear. The green line represents the size of up gaps, when it crosses zero it gives a long signal. The red line - represents the size of down gaps, when it crosses zero - short signal.
Instead of having to look between multiple charts, this simply overlays the past weeks open and close should a gap appear.
Usage:
Strategy flips long / short depending of indicator signals. It could cut the position by stop loss or take profit.
Features:
ability to set stop loss and take profit in %
ability to set delta for gaps (if you want to filter small ones)
ability to choose strategy type. Standart: Long Up/Short Down || Inverse: Short Up/Long Down.
Backtesting:
Backtested on BTCPERP ( FTX ) and XBTUSD (Bitmex).
It shows a low drawdown, a small number of trades and 50% of profit for the 2020.
For example, I set high delta for down gaps to filter small ones
Strategy doesn't repaint.

Cyato Grid Basic Buy & Sell [BACKTEST]Private indicator
This Grid bot strategy creates buy orders when the price goes down one level or more, and sell order when the price goes up one level or more.
To avoid useless trades, the lastest traded level is disabled until another level is crossed.
To create the grid, one upper level and one lower level is calculated. Those 2 levels are either given by the user using "MANUAL" mode or automatically calculated by an AI. The space between these two levels are then divided equally into several steps, creating the grid. The number of steps is chosen by the user, from 3 to 20.
HOW IT WORKS
This is the Backtest version meaning this is the one you should use with the Strategy Tester (more below).
Select either "MANUAL" or "AI" mode.
When using "MANUAL", you have to configure an upper level and a lower level.
When using "AI", the upper and lower level are automatically calculated from last 7 days high/low plus a 3% deviation. You can configure the timeframe and the deviation.
Select the grid quantity, from 3 to 20.
Example with 3:
Example with 10:
Example with 20:
You can choose between "Once Per Bar Close" or "Once Per Bar" alert type.
"Once Per Bar Close" will wait candle close to confirm a trade.
"Once Per Bar" will trigger a trade if the price crossed a step anytime inside a candle. Note that the backtest will still use bar close price in its calculation.
BACKTESTING
The strategy will buy 1 contract when a BUY signal appears and sell 1 contract when a SELL signal appears.
Here 1 contract = 1 BTC
The strategy can buy up to 20 contracts. Pyramiding is enabled.
The Backtest info panel is here to show how many trades are open in the backtest.
I know very well that a backtest has no value if several trades are left open. That is why I coded a feature to close all open trades at once on the last candle. This feature can be turned on and off.
To get this indicator, use the link in my signature below, thanks!

Mean Reversion w/ Bollinger BandsThis is a more advanced version of my original mean reversion script.
It employs the famous Bollinger Bands.
This robot will buy when price falls below the lower Bollinger Band, and sell when price moves above the upper Bollinger Band.
I've only tested it on the S&P 500, though you could try it out on other assets to see the backtest performance.
During the recent COVID-19 bear market drop, it produced several buy signals on the S&P which I followed, and made some nice gains so far.
I still think this would make a better investing strategy (buy undervalued / sell over-valued), rather than a trading strategy.
I use this robot for my long term portfolio.

TS - Long Term Trading Algorithm - StrategyStrategy to the bespoke TS - Trading Algorithm. Highly profitable cryptocurrency trading model.
This script is long only profitable strategy- there is a script coming in the next few days for shorter timeframe long & short trading.
- Backtesting is from 2017.
- 0.05% commission
- 100% capital allocation per trade.
Access to both the backtesting strategy & indicator is paid - PM me for details.

Scalping rubicointThe scalping strategy is very common in currency trading, since Forex is a market that generally presents very clear trends in very short periods of time. There are different indicators for scalping, such as the RSI (relative strength) or the investment volume, the important thing is to choose one and apply it correctly. An example of a one-minute scalping strategy is buying 20,000 euros in EUR / USD when the currency pair is trending upwards (such as + 0.33%). Since it is relatively rare for the trend to reverse in one minute, the trader following this Forex scalping trend would sell them after one minute. Typically at the end of the sale of the currency is that the investor will earn a margin close to + 0.33% for the total value of the investment.

GOLD SUPER TREND ARROW SIGNALS STRATEGY WITH PERFORMANCEThe strategy is based on combination of ATR, Moving Averages, Volatility indicators that was filtered and final strategy based on accurate arrows that catch trend and
also predict pivot points for intraday Gold ( XAUUSD ) charts.
The strategy script can be used for time frames 30 MIN, 45 MIN, 1Hour, 4 HOURS.
The goal was to create trending strategy with maximum profit and lowest drawdown.
For initial deposit $12000 time frame 30 MIN profit was 42% with maximum drawdown 6%:
For time frame 45 MIN profit was 30% with maximum drawdown 5%:

USDJPY 30 MIN STRATEGYThis strategy uses a combination linear regression moving averages and ATR, fine-tuned to the USD/JPY 30 minute chart. Without going into too much detail, the long/short signals are based upon linear regression moving average crosses and slope with ATR confirmation.
All code is based on one time frame with no security functions so zero repaint. Backtest is based upon compounding 100% of your capital using zero leverage.
PM me for access to the strategy. Alert indicator for this available for donation via BTC.
I'm not a professional coder, but the backtests speak for themselves. As with anything on Tradingview, your results may vary and use at your own risk. Past performance is no indication of future performance.
- Hoffdaddy

Intraday Trend Following Algorithm [Bitduke]Description :
Trend following strategy that constantly adjusts to volatility and avoids of most whipsaws; rapidly moves up or down according to a quickly changing market. Great strategy for high volatile markets, like crypto market.
Based on a couple of special moving averages with integrated smoother which helps to avoid whipsaws.
Backtesting
Backtested on BTCPERP ( FTX ). It shows much better results on 4h timeframe (more than 222% YTD) and relatively low drawdown which allows you to use up to x3 leverage without a fear of huge losses. I.e if we have 5% drawdown for this strategy and using x3 leverage then to be prepared to 15% drawdown maximum in this case.
Initial Capital: $1000
Capital per trade: $1000
Including fee: 0.075% (buy + sell) side, type "taker"
When we get a signal (green/red column on chart) algo opens a trade by the next candle open price.
Others:
Risk management: Stop loss/Take profit in %
Strategy doesn't repaint .
----------
To access: sign up on FTX using ref link from my signature.

Bollinger Bands Trend StrategyThis is a trading strategy for trend traders.
Buy signals are generated when price closes above upper band.
Sell signals are generated when price closes below lower band.
Good luck.

Squeeze Momentum Strategy SL TP v2Improved version of my Squeeze Momentum Strategy.
Changes:
Possible to change source: ohlc4, hl2, hlc3, close
Enter your stop loss and take profit in %, NOT ticks
Working and robust even without take profit / stop loss
Yearly drawdown lower than 20%
Backtesting
Backtested on BTCPERP (FTX). It shows much better results on 1h timeframe (about 200% yearly, 55% in 2020) and relatively low drawdown to date.
Initial Capital: $1000
Capital per trade: $1000
Including fee: 0.075% (buy + sell) side, type "taker"
Strategy doesn't repaint.
Shortly about Squeeze Momentum Indicator:
This is a derivative of John Carter's "TTM Squeeze" volatility indicator, as discussed in his book "Mastering the Trade" (chapter 11).
----------
To access : sign up on FTX using ref link from my signature.

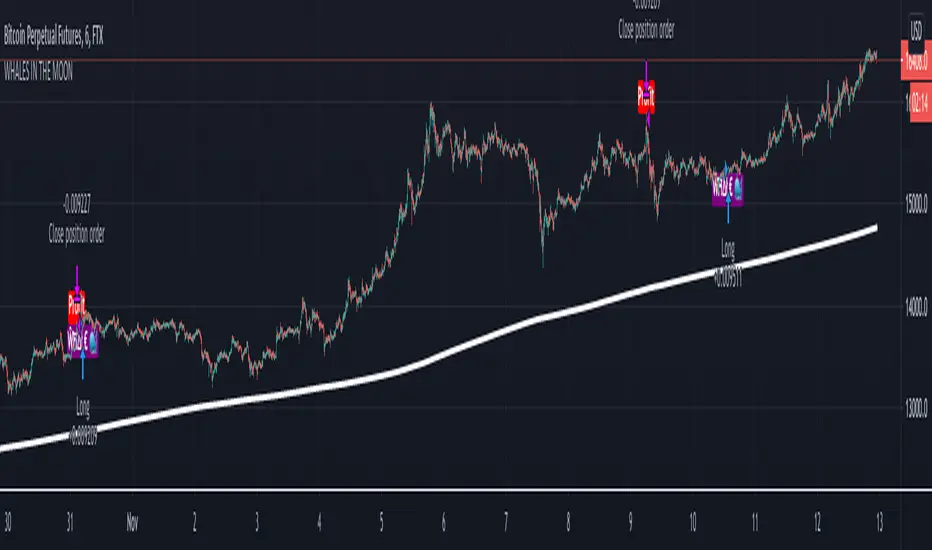
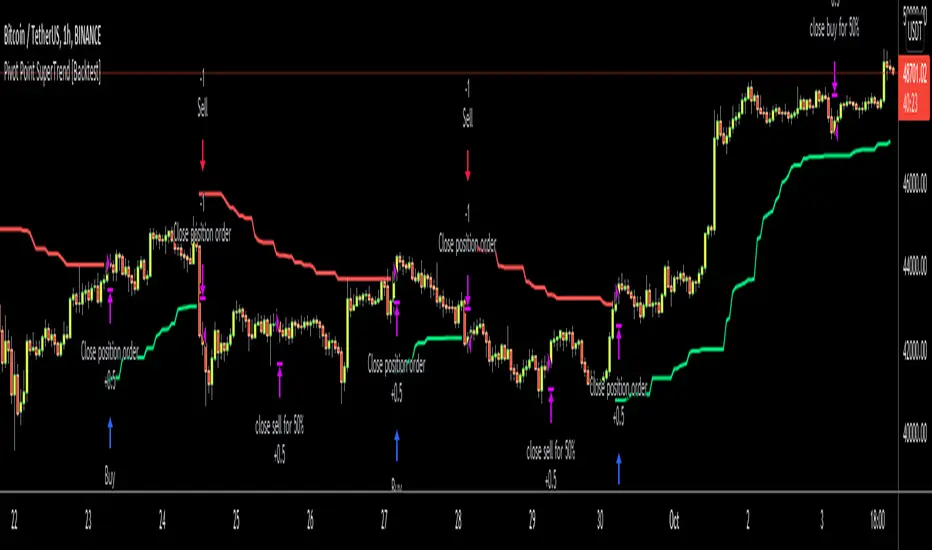
Pivot Point SuperTrend [Backtest]Hello All,
This is backtesting result of following indicator/strategy. I didn't work on adding other indicators. maybe in the future I can try to combine this with other indicators.
You can visit following link to see "Pivot Point SuperTrend" . by using this backtesting tool, you can test&find better options
There is option "Use Center Line to Close Entry for 50%" . by default it's not enabled. if you enable this option, pivot point center line may push you to close your entry for 50% (can be used as early stoploss/take profit line if you think it's risky)
Enjoy!
Takashi Bows Autopilot | 2nd Gen | [Strategy]This is a strategy tester for Takashi Bows Autopilot indicator. Please check for more details and instructions at our website.
Takashi Bows Autopilot is the ultimate trading tool. Effortless, its signals put traders inside strong trends, locking big profits that cover all loss generated during sideways trends.
An upgrade version of Takashi Bows v1, this script is the result of some operations developed by us, it can easily adapt to different markets and time frames. Now ranging from level 1 to 20, traders can select the amount of signals to be displayed on the chart. Based on price movement, it signals entries after strong movement up or down.
Take Profit included. If a position is opened in one direction, it should be closed at take profit levels or when a position in the opposite direction is opened.
Inputs
Level
Integer input. Sets a level for signals generated up and down. The higher the level, more signals on chart, and vice-versa.
Take Profit %
Float input. Sets a percent of take profit for exiting previous open position.
Rule
Float input. Sets a ruler for more accuracy on less volatile markets. Standard value 1 for high volatile markets, higher values for low volatile markets.
Disclaimer:
Back-tests do not guarantee performance on the future. Even if a trading setup is profitable in historical data. it could be unprofitable in the future.
To get access to this and other scripts check links below.

888 BOT #backtest█ 888 BOT #backtest
This is an Expert Advisor 'EA' or Automated trading script for ‘longs’ and ‘shorts’, which uses only a Take Profit or, in the worst case, a Stop Loss to close the trade.
It's a much improved version of the previous ‘Repanocha’. It doesn`t use 'Trailing Stop' or 'security()' functions (although using a security function doesn`t mean that the script repaints) and all signals are confirmed, therefore the script doesn`t repaint in alert mode and is accurate in backtest mode.
Apart from the previous indicators, some more and other functions have been added for Stop-Loss, re-entry and leverage.
It uses 8 indicators, (many of you already know what they are, but in case there is someone new), these are the following:
1. Jurik Moving Average
It's a moving average created by Mark Jurik for professionals which eliminates the 'lag' or delay of the signal. It's better than other moving averages like EMA, DEMA, AMA or T3.
There are two ways to decrease noise using JMA. Increasing the 'LENGTH' parameter will cause JMA to move more slowly and therefore reduce noise at the expense of adding 'lag'
The 'JMA LENGTH', 'PHASE' and 'POWER' parameters offer a way to select the optimal balance between 'lag' and over boost.
Green: Bullish, Red: Bearish.
2. Range filter
Created by Donovan Wall, its function is to filter or eliminate noise and to better determine the price trend in the short term.
First, a uniform average price range 'SAMPLING PERIOD' is calculated for the filter base and multiplied by a specific quantity 'RANGE MULTIPLIER'.
The filter is then calculated by adjusting price movements that do not exceed the specified range.
Finally, the target ranges are plotted to show the prices that will trigger the filter movement.
Green: Bullish, Red: Bearish.
3. Average Directional Index (ADX Classic) and (ADX Masanakamura)
It's an indicator designed by Welles Wilder to measure the strength and direction of the market trend. The price movement is strong when the ADX has a positive slope and is above a certain minimum level 'ADX THRESHOLD' and for a given period 'ADX LENGTH'.
The green color of the bars indicates that the trend is bullish and that the ADX is above the level established by the threshold.
The red color of the bars indicates that the trend is down and that the ADX is above the threshold level.
The orange color of the bars indicates that the price is not strong and will surely lateralize.
You can choose between the classic option and the one created by a certain 'Masanakamura'. The main difference between the two is that in the first it uses RMA () and in the second SMA () in its calculation.
4. Parabolic SAR
This indicator, also created by Welles Wilder, places points that help define a trend. The Parabolic SAR can follow the price above or below, the peculiarity that it offers is that when the price touches the indicator, it jumps to the other side of the price (if the Parabolic SAR was below the price it jumps up and vice versa) to a distance predetermined by the indicator. At this time the indicator continues to follow the price, reducing the distance with each candle until it is finally touched again by the price and the process starts again. This procedure explains the name of the indicator: the Parabolic SAR follows the price generating a characteristic parabolic shape, when the price touches it, stops and turns (SAR is the acronym for 'stop and reverse'), giving rise to a new cycle. When the points are below the price, the trend is up, while the points above the price indicate a downward trend.
5. RSI with Volume
This indicator was created by LazyBear from the popular RSI.
The RSI is an oscillator-type indicator used in technical analysis and also created by Welles Wilder that shows the strength of the price by comparing individual movements up or down in successive closing prices.
LazyBear added a volume parameter that makes it more accurate to the market movement.
A good way to use RSI is by considering the 50 'RSI CENTER LINE' centerline. When the oscillator is above, the trend is bullish and when it is below, the trend is bearish.
6. Moving Average Convergence Divergence (MACD) and (MAC-Z)
It was created by Gerald Appel. Subsequently, the histogram was added to anticipate the crossing of MA. Broadly speaking, we can say that the MACD is an oscillator consisting of two moving averages that rotate around the zero line. The MACD line is the difference between a short moving average 'MACD FAST MA LENGTH' and a long moving average 'MACD SLOW MA LENGTH'. It's an indicator that allows us to have a reference on the trend of the asset on which it is operating, thus generating market entry and exit signals.
We can talk about a bull market when the MACD histogram is above the zero line, along with the signal line, while we are talking about a bear market when the MACD histogram is below the zero line.
There is the option of using the MAC-Z indicator created by LazyBear, which according to its author is more effective, by using the parameter VWAP (volume weighted average price) 'Z-VWAP LENGTH' together with a standard deviation 'STDEV LENGTH' in its calculation.
7. Volume Condition
Volume indicates the number of participants in this war between bulls and bears, the more volume the more likely the price will move in favor of the trend. A low trading volume indicates a lower number of participants and interest in the instrument in question. Low volumes may reveal weakness behind a price movement.
With this condition, those signals whose volume is less than the volume SMA for a period 'SMA VOLUME LENGTH' multiplied by a factor 'VOLUME FACTOR' are filtered. In addition, it determines the leverage used, the more volume, the more participants, the more probability that the price will move in our favor, that is, we can use more leverage. The leverage in this script is determined by how many times the volume is above the SMA line.
The maximum leverage is 8.
8. Bollinger Bands
This indicator was created by John Bollinger and consists of three bands that are drawn superimposed on the price evolution graph.
The central band is a moving average, normally a simple moving average calculated with 20 periods is used. ('BB LENGTH' Number of periods of the moving average)
The upper band is calculated by adding the value of the simple moving average X times the standard deviation of the moving average. ('BB MULTIPLIER' Number of times the standard deviation of the moving average)
The lower band is calculated by subtracting the simple moving average X times the standard deviation of the moving average.
the band between the upper and lower bands contains, statistically, almost 90% of the possible price variations, which means that any movement of the price outside the bands has special relevance.
In practical terms, Bollinger bands behave as if they were an elastic band so that, if the price touches them, it has a high probability of bouncing.
Sometimes, after the entry order is filled, the price is returned to the opposite side. If price touch the Bollinger band in the same previous conditions, another order is filled in the same direction of the position to improve the average entry price, (% MINIMUM BETTER PRICE ': Minimum price for the re-entry to be executed and that is better than the price of the previous position in a given %) in this way we give the trade a chance that the Take Profit is executed before. The downside is that the position is doubled in size. 'ACTIVATE DIVIDE TP': Divide the size of the TP in half. More probability of the trade closing but less profit.
█ STOP LOSS and RISK MANAGEMENT.
A good risk management is what can make your equity go up or be liquidated.
The % risk is the percentage of our capital that we are willing to lose by operation. This is recommended to be between 1-5%.
% Risk: (% Stop Loss x % Equity per trade x Leverage) / 100
First the strategy is calculated with Stop Loss, then the risk per operation is determined and from there, the amount per operation is calculated and not vice versa.
In this script you can use a normal Stop Loss or one according to the ATR. Also activate the option to trigger it earlier if the risk percentage is reached. '% RISK ALLOWED'
'STOP LOSS CONFIRMED': The Stop Loss is only activated if the closing of the previous bar is in the loss limit condition. It's useful to prevent the SL from triggering when they do a ‘pump’ to sweep Stops and then return the price to the previous state.
█ BACKTEST
The objective of the Backtest is to evaluate the effectiveness of our strategy. A good Backtest is determined by some parameters such as:
- RECOVERY FACTOR: It consists of dividing the 'net profit' by the 'drawdown’. An excellent trading system has a recovery factor of 10 or more; that is, it generates 10 times more net profit than drawdown.
- PROFIT FACTOR: The ‘Profit Factor’ is another popular measure of system performance. It's as simple as dividing what win trades earn by what loser trades lose. If the strategy is profitable then by definition the 'Profit Factor' is going to be greater than 1. Strategies that are not profitable produce profit factors less than one. A good system has a profit factor of 2 or more. The good thing about the ‘Profit Factor’ is that it tells us what we are going to earn for each dollar we lose. A profit factor of 2.5 tells us that for every dollar we lose operating we will earn 2.5.
- SHARPE: (Return system - Return without risk) / Deviation of returns.
When the variations of gains and losses are very high, the deviation is very high and that leads to a very poor ‘Sharpe’ ratio. If the operations are very close to the average (little deviation) the result is a fairly high 'Sharpe' ratio. If a strategy has a 'Sharpe' ratio greater than 1 it is a good strategy. If it has a 'Sharpe' ratio greater than 2, it is excellent. If it has a ‘Sharpe’ ratio less than 1 then we don't know if it is good or bad, we have to look at other parameters.
- MATHEMATICAL EXPECTATION: (% winning trades X average profit) + (% losing trades X average loss).
To earn money with a Trading system, it is not necessary to win all the operations, what is really important is the final result of the operation. A Trading system has to have positive mathematical expectation as is the case with this script: ME = (0.87 x 30.74$) - (0.13 x 56.16$) = (26.74 - 7.30) = 19.44$ > 0
The game of roulette, for example, has negative mathematical expectation for the player, it can have positive winning streaks, but in the long term, if you continue playing you will end up losing, and casinos know this very well.
PARAMETERS
'BACKTEST DAYS': Number of days back of historical data for the calculation of the Backtest.
'ENTRY TYPE': For '% EQUITY' if you have $ 10,000 of capital and select 7.5%, for example, your entry would be $ 750 without leverage. If you select CONTRACTS for the 'BTCUSDT' pair, for example, it would be the amount in 'Bitcoins' and if you select 'CASH' it would be the amount in $ dollars.
'QUANTITY (LEVERAGE 1X)': The amount for an entry with X1 leverage according to the previous section.
'MAXIMUM LEVERAGE': It's the maximum allowed multiplier of the quantity entered in the previous section according to the volume condition.
The settings are for Bitcoin at Binance Futures (BTC: USDTPERP) in 30 minutes.
For other pairs and other timeframes, the settings have to be adjusted again. And within a month, the settings will be different because we all know the market and the trend are changing.
█ 888 BOT (SPANISH)
Este es un Expert Advisor 'EA' o script de trading automatizado para ‘longs’ y ‘shorts’, el cual, utiliza solo un Take Profit o, en el peor de los casos, un Stop Loss para cerrar el trade.
Es una versión muy mejorada del anterior ‘Repanocha’. No utiliza ‘Trailing Stop’, ni funciones ‘security()’ (aunque usar una función security no significa que el script repinte) y todas las señales son confirmadas, por consiguiente, el script no repinta en modo alertas y es preciso en en el modo backtest.
Aparte de los anteriores indicadores se han añadido algunos más y otras funciones para Stop-Loss, de re-entrada y apalancamiento.
Utiliza 8 indicadores, (muchos ya sabéis sobradamente lo que son, pero por si hay alguien nuevo), son los siguientes:
1. Jurik Moving Average
Es una media móvil creada por Mark Jurik para profesionales la cual elimina el ‘lag’ o retardo de la señal. Es mejor que otras medias móviles como la EMA, DEMA, AMA o T3.
Hay dos formas de disminuir el ruido utilizando JMA. El aumento del parámetro 'LENGTH' hará que JMA se mueva más lentamente y, por lo tanto, reducirá el ruido a expensas de añadir ‘lag’
Los parámetros 'JMA LENGTH', 'PHASE' y 'POWER' ofrecen una forma de seleccionar el equilibrio óptimo entre ‘lag’ y sobre impulso.
Verde : Alcista, Rojo: Bajista.
2. Range filter
Creado por Donovan Wall, su función es la de filtrar o eliminar el ruido y poder determinar mejor la tendencia del precio a corto plazo.
Primero, se calcula un rango de precio promedio uniforme 'SAMPLING PERIOD' para la base del filtro y se multiplica por una cantidad específica 'RANGE MULTIPLIER'.
A continuación, el filtro se calcula ajustando los movimientos de precios que no exceden el rango especificado.
Por último, los rangos objetivo se trazan para mostrar los precios que activarán el movimiento del filtro.
Verde : Alcista, Rojo: Bajista.
3. Average Directional Index (ADX Classic) y (ADX Masanakamura)
Es un indicador diseñado por Welles Wilder para medir la fuerza y dirección de la tendencia del mercado. El movimiento del precio tiene fuerza cuando el ADX tiene pendiente positiva y está por encima de cierto nivel mínimo 'ADX THRESHOLD' y para un periodo dado 'ADX LENGTH'.
El color verde de las barras indica que la tendencia es alcista y que el ADX está por encima del nivel establecido por el threshold.
El color Rojo de las barras indica que la tendencia es bajista y que el ADX está por encima del nivel de threshold.
El color naranja de las barras indica que el precio no tiene fuerza y seguramente lateralizará.
Se puede elegir entre la opción clásica y la creada por un tal 'Masanakamura'. La diferencia principal entre los dos es que en el primero utiliza RMA() y en el segundo SMA() en su cálculo.
4. Parabolic SAR
Este indicador, creado también por Welles Wilder, coloca puntos que ayudan a definir una tendencia. El Parabolic SAR puede seguir al precio por encima o por debajo, la particularidad que ofrece es que cuando el precio toca al indicador, este salta al otro lado del precio (si el Parabolic SAR estaba por debajo del precio salta arriba y viceversa) a una distancia predeterminada por el indicador. En este momento el indicador vuelve a seguir al precio, reduciendo la distancia con cada vela hasta que finalmente es tocado otra vez por el precio y se vuelve a iniciar el proceso. Este procedimiento explica el nombre del indicador: el Parabolic SAR va siguiendo al precio generando una característica forma parabólica, cuando el precio lo toca, se para y da la vuelta (SAR son las siglas en inglés de ‘stop and reverse’), dando lugar a un nuevo ciclo. Cuando los puntos están por debajo del precio, la tendencia es alcista, mientras que los puntos por encima del precio indica una tendencia bajista.
5. RSI with Volume
Este indicador lo creo un tal LazyBear de TV a partir del popular RSI.
El RSI es un indicador tipo oscilador utilizado en análisis técnico y creado también por Welles Wilder que muestra la fuerza del precio mediante la comparación de los movimientos individuales al alza o a la baja de los sucesivos precios de cierre.
LazyBear le añadió un parámetro de volumen que lo hace más preciso al movimiento del mercado.
Una buena forma de usar el RSI es teniendo en cuenta la línea central de 50 'RSI CENTER LINE'. Cuando el oscilador está por encima, la tendencia es alcista y cuando está por debajo la tendencia es bajista.
6. Moving Average Convergence Divergence (MACD) y (MAC-Z)
Fue creado por Gerald Appel. Posteriormente se añadió el histograma para anticipar el cruce de medias. A grandes rasgos podemos decir que el MACD es un oscilador consistente en dos medias móviles que van girando en torno a la línea de cero. La línea del MACD no es más que la diferencia entre una media móvil corta 'MACD FAST MA LENGTH' y una media móvil larga 'MACD SLOW MA LENGTH'. Es un indicador que nos permite tener una referencia sobre la tendencia del activo sobre el cual se está operando, generando de este modo señales de entrada y salida del mercado.
Podemos hablar de mercado alcista cuando el histograma del MACD se sitúe por encima de la línea cero, junto con la línea de señal, mientras que hablaremos de mercado bajista cuando el histograma MACD se situará por debajo de la línea cero.
Está la opción de utilizar el indicador MAC-Z creado por LazyBear que según su autor es más eficaz, por utilizar el parámetro VWAP (precio medio ponderado por volumen) 'Z-VWAP LENGTH' junto con una desviación standard 'STDEV LENGTH' en su cálculo.
7. Volume Condition
El volumen indica el número de participantes en esta guerra entre toros y osos, cuanto más volumen más probabilidad de que se mueva el precio a favor de la tendencia. Un volumen bajo de negociación indica un menor número de participantes e interés por el instrumento en cuestión. Los bajos volúmenes pueden revelar debilidad detrás de un movimiento de precios.
Con esta condición se filtran aquellas señales cuyo volumen es inferior a la SMA de volumen para un periodo 'SMA VOLUME LENGTH' multiplicado por un factor 'VOLUME FACTOR'. Además, determina el apalancamiento utilizado, a más volumen, más participantes, más probabilidad de que se mueva el precio a nuestro favor, es decir, podemos utilizar más apalancamiento. El apalancamiento en este script lo determina las veces que está el volumen por encima de la línea de la SMA.
El apalancamiento máximo es de 8.
8. Bollinger Bands
Este indicador fue creado por John Bollinger y consiste en tres bandas que se dibujan superpuestas al gráfico de evolución del precio.
La banda central es una media móvil, normalmente se emplea una media móvil simple calculada con 20 períodos. ('BB LENGTH' Número de periodos de la media móvil)
La banda superior se calcula sumando al valor de la media móvil simple X veces la desviación típica de la media móvil. ('BB MULTIPLIER' Número de veces la desviación típica de la media móvil)
La banda inferior de calcula restando a la media móvil simple X veces la desviación típica de la media móvil.
la franja comprendida entre las bandas superior e inferior contiene, estadísticamente, casi un 90% de las posibles variaciones del precio, lo que significa que cualquier movimiento del precio fuera de las bandas tiene especial relevancia.
En términos prácticos, las bandas de Bollinger se comporta como si de una banda elástica se tratara de manera que, si el precio las toca, éste tiene mucha probabilidad de rebotar.
En ocasiones, después de rellenarse la orden de entrada, el precio se devuelve hacia el lado contrario. Si toca la banda de Bollinger se rellena otra orden en la misma dirección de la posición para mejorar el precio medio de entrada, (% MINIMUM BETTER PRICE': Precio mínimo para que se ejecute la re-entrada y que sea mejor que el precio de la posición anterior en un % dado) de esta manera damos una oportunidad al trade de que el Take Profit se ejecute antes. La desventaja es que se dobla el tamaño de la posición. 'ACTIVATE DIVIDE TP': Divide el tamaño del TP a la mitad. Más probabilidad de que se cierre el trade pero menos ganancias.
█ STOP LOSS y RISK MANAGEMENT.
Una buena gestión de las pérdidas o gestión del riesgo es lo que puede hacer que tu cuenta suba o se liquide en poco tiempo.
El % de riesgo es el porcentaje de nuestro capital que estamos dispuestos a perder por operación. Este se aconseja que debe estar comprendido entre un 1-5%.
% Risk = (% Stop Loss x % Equity per trade x Leverage) / 100
Primero se calcula la estrategia con Stop Loss, después se determina el riesgo por operación y a partir de ahí se calcula el monto por operación y no al revés.
En este script puedes usar un Stop Loss normal o uno según el ATR. También activar la opción de que salte antes si se alcanza el porcentaje de riesgo. '% RISK ALLOWED'
'STOP LOSS CONFIRMED': Solamente se activa el Stop Loss si el cierre de la barra anterior se encuentra en la condición de límite de pérdidas. Es útil para evitar que se dispare el SL cuando hacen un ‘pump’ para barrer Stops y luego se devuelve el precio a la normalidad.
█ BACKTEST
El objetivo del Backtest es evaluar la eficacia de nuestra estrategia. Un buen Backtest lo determinan algunos parámetros como son:
- RECOVERY FACTOR: Consiste en dividir el ‘beneficio neto’ entre el ‘drawdown’. Un excelente sistema de trading tiene un recovery factor de 10 o más; es decir, genera 10 veces más beneficio neto que drawdown.
- PROFIT FACTOR: El ‘Profit Factor’ es otra medida popular del rendimiento de un sistema. Es algo tan simple como dividir lo que ganan las operaciones con ganancias entre lo que pierden las operaciones con pérdidas. Si la estrategia es rentable entonces por definición el ‘Profit Factor’ va a ser mayor que 1. Las estrategias que no son rentables producen factores de beneficio menores que uno. Un buen sistema tiene un profit factor de 2 o más. Lo bueno del ‘Profit Factor’ es que nos dice lo que vamos a ganar por cada dolar que perdemos. Un profit factor de 2.5 nos dice que por cada dolar que perdamos operando vamos a ganar 2.5.
- SHARPE: (Retorno sistema – Retorno sin riesgo) / Desviación de los retornos.
Cuando las variaciones de ganancias y pérdidas son muy altas, la desviación es muy elevada y eso conlleva un ratio de ‘Sharpe’ muy pobre. Si las operaciones están muy cerca de la media (poca desviación) el resultado es un ratio de ‘Sharpe’ bastante elevado. Si una estrategia tiene un ratio de ‘Sharpe’ mayor que 1 es una buena estrategia. Si tiene un ratio de ‘Sharpe’ mayor que 2, es excelente. Si tiene un ratio de ‘Sharpe’ menor que 1 entonces no sabemos si es buena o mala, hay que mirar otros parámetros.
- MATHEMATICAL EXPECTATION:(% operaciones ganadoras X ganancia media) + (% operaciones perdedoras X pérdida media).
Para ganar dinero con un sistema de Trading, no es necesario ganar todas las operaciones, lo verdaderamente importante es el resultado final de la operativa. Un sistema de Trading tiene que tener esperanza matemática positiva como es el caso de este script.
El juego de la ruleta, por ejemplo, tiene esperanza matemática negativa para el jugador, puede tener rachas positivas de ganancias, pero a la larga, si se sigue jugando se acabará perdiendo, y esto los casinos lo saben muy bien.
PARAMETROS
'BACKTEST DAYS': Número de días atrás de datos históricos para el calculo del Backtest.
'ENTRY TYPE': Para % EQUITY si tienes 10000$ de capital y seleccionas 7.5% tu entrada sería de 750$ sin apalancamiento. Si seleccionas CONTRACTS para el par BTCUSDT sería la cantidad en Bitcoins y si seleccionas CASH sería la cantidad en dólares.
'QUANTITY (LEVERAGE 1X)': La cantidad para una entrada con apalancamiento X! según el apartado anterior.
'MAXIMUM LEVERAGE': Es el máximo multiplicador permitido de la cantidad introducida en el apartado anterior según la condición de volumen.
Los settings son para Bitcoin en Binance Futures (BTC:USDTPERP) en 30 minutos.
Para otro pares y otras temporalidades se tienen que ajustar las opciones de nuevo. Además para dentro de un mes, los ajustes serán otros distintos ya que el mercado y la tendencia es cambiante.

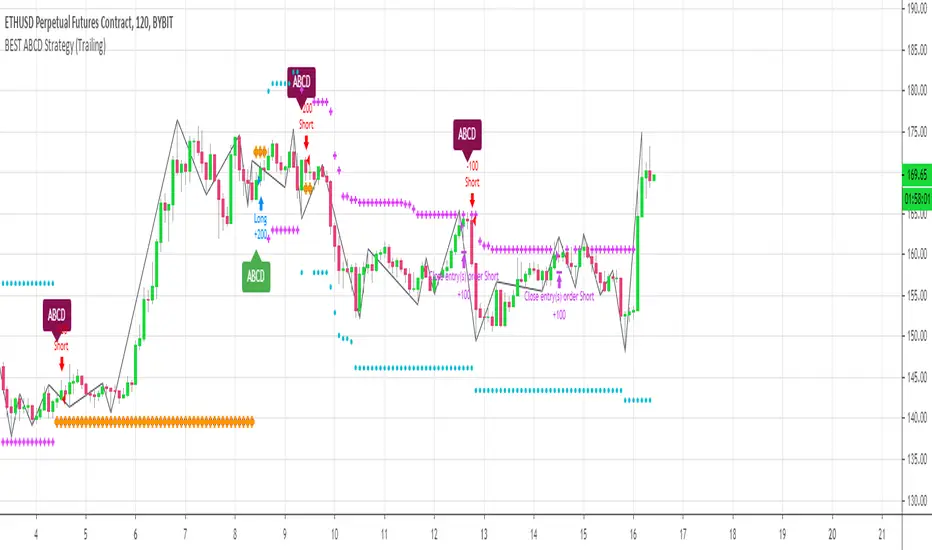
[Daveatt] BEST ABCD Pattern Strategy (Trailing SL + TP)Hello traders
This is the strategy version of my ABCD pattern. I added the Trailing Stop and Trailing Profit upon a follower request
I - Concept
I present to you, ladies and gentlemen, the first screener for harmonic patterns .
Starting with an ACBD pattern screener this time!!
I used the calculations from Ricardo Santo's script
In short, he's using fractals (regular or Bill Williams ) for the pattern calculations. A masterpiece !!!
II - Definitions
The ABCD pattern ( AB=CD ) is one of the classic chart patterns which is repeated over and over again.
The ABCD pattern shows perfect harmony between price and time.
The Williams Fractal is an indicator, developed by Bill Williams , that aims to detect reversal points (highs and lows) and marks them with arrows.
Up fractals and down fractals have specific shapes. The Williams Fractal indicator helps users determine in which direction price will develop
💎Strategy filters💎
I included some cool backtest filters:
- Trailing stop with trigger concept coming from this Trailing Stop Strategy
- Trailing profit with trigger coming from this Trailing Profit Strategy
Last words
It works for all asset classes (Forex, crypto, indices, etc...) and does not repaint
All the BEST
Dave
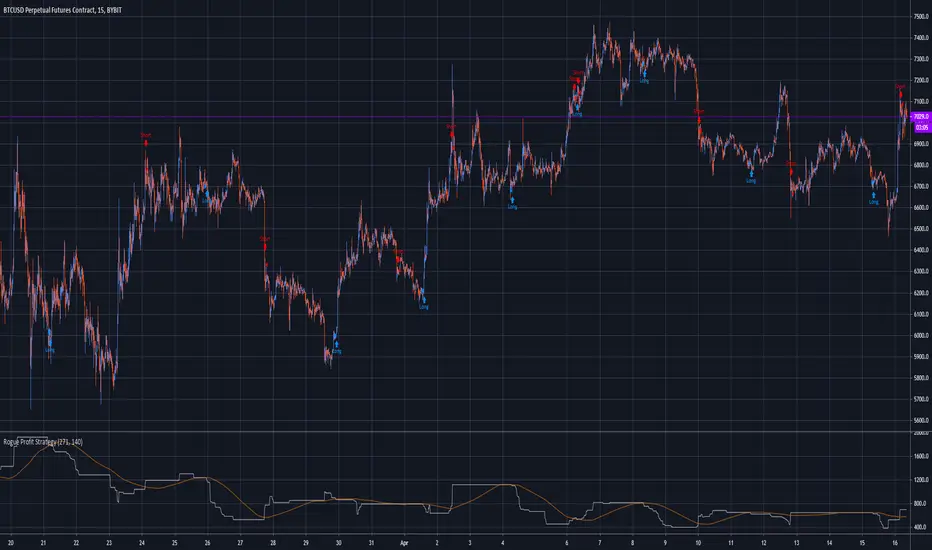
Rogue Profit StrategyThis is a complex script developed to measure specific volatility parameters and enter trades based on predetermined rules which are proprietary and will not be released, so don't ask for specific strategy settings.
The strategy keeps you in the market at all times either long or short. Parameters can be changed to better suit the asset your are trading, time frame and your particular trading style but the overall volatility rules for entering and exiting remain the same. It can be used to trade any asset but be aware the parameters you use for one asset, lets say Bitcoin, will not work with another asset like Forex. If the asset is on TradingView, you can use this indicator to trade it.
It is meant to trade pure price action candlesticks so do not use anything but a typical candlestick chart. You are going to have to put in some work and play around with the input parameters to make this strategy the most profitable for your trading style. Trading is hard but hopefully this strategy will help flatten the learning curve. This strategy is accompanied by an indicator study named "Rogue Profit Alert Indicator" that will work with setting alerts for manual or automated trading.
This strategy does NOT repaint.
This is a very powerful and profitable script that will simplify your trading and has been in development and tested for three years. Message for details on how to obtain access. Please allow up to 24 hours for a response.
Donchian Channel StrategyLong and Short entries based on the Donchian Channel indicator. The entry can be set to Higher High/Lower Low or the basis line.

Swingtrade strategy for volatile assets on the hourly chartThe strategy of this script is based on a setup that I used in 2016 for swingtrade on PETR4 and other IBOV actions. The intention of this script was to carry out a study to validate the effectiveness of the strategy precisely.
- This strategy works only to operate bought on the 1h (one hour) chart;
- The strategy is based on the strength of the market, which is measured according to moving averages;
- The setup uses targets of 3% above the input signal price and 11.5% stoploss for all operations;
- The stoploss is bigger than the target, this causes the hit rate to be high, but when there is a loss, the damage can be large;
- The setup performed well in some shares of the Brazilian stock market and cryptocurrencies of the dollar pair;

FTSMA - Trend is your frendThis my new solid strategy: if you belive that "TREND IS YOUR FRIEND" this is for you!
I have tested with many pairs and at many timeframes and have profit with just minor changes in settings.
I suggest to use it for intraday trading .
VERY IMPORTANT NOTE: this is a trend following strategy, so the target is to stay in the trade as much as possible. If your trading style is more focused on scalping and/or pullbaks, this strategy is not for you.
This strategy uses moving averages applied to Fourier waves for forecasting trend direction.
How strategy works:
- Buy when fast MA is above mid MA and price is above slow MA, which acts as a trend indicator.
- Sell when fast MA is below mid MA and price is below slow MA, which acts as a trend indicator.
Strategy uses a lot of pyramiding orders because when you are in a flat market phase it will close 1 or 2 orders with a loss, but when a big trend starts, it will have profit in a lot of orders.
So, if you analize carefully the strategy results, you will note that "Percent Profitable" is very low (30% in this case) because strategy opened a lot of orders also in flat markets with small losses, BUT "Avg # bars in winning trades" is very high and overall Profit is very high: when a big trend starts, orders are kept open for long time generating big profits.
Thanks to all pinescripters mentioned in the code for their snippets.
I have also a study with alerts. Next improvement (only to whom is interested to this script and follows me): study with alerts on multiple tickers all at one. Leave a comment if you want to have access to study.
HOW TO USE STRATEGY AND STUDY TOGHETER:
1- Add to chart the strategy first, so your workspace will be as clean as possible.
2- Open the Strategy Tester tab at footer of the page.
3- Modify settings to get best results (Profit, Profit Factor, Drawdown).
4- Add study with alerts to your chart with same setting of strategy.
I WILL PROVIDE A DETAILED QUICK INSTALLATION GUIDE WITH THE STUDY!
Please use comment section for any feedback or contact me if you need support.

RWI StrategyA test of the RWI used purely for long/short signals proves surprisingly profitable on 3H and 4H XBTUSD and ETHUSD.

TARI FX USOILHi guys,
this is my new strategy for USOIL WTI!
It works in Daily chart, so you need just a few seconds per day to work with it, very short time to get nice profit!
Stop Loss is set in 500 pips, Take Profit in 600 pips, but for OANDA TP 6.000 and SL 5.000.
The backtest started 36 years ago, so the equity is very solid!
I used 1.000$ as initial capital, and 30 contracts per trade, getting 18% of income per year, and a Max DD of 30% only.
Ask for a free trial, and check by yourself what income whould have been generated investin 100% of the equity!!
Enjoy your wallet!
Tari.

TARI FX USOILHi guys,
this is a brand new strategy for USOIL, WTI.
It works on daily chart, so basically you can watch it just a few seconds per day. Not much time, but consistent profit.
Stop Loss is set on 500 pips, Take Profit on 600 pips, for USOIL on TVC, if you prefer OANDA set 5.000 and 6.000 pips each.
This strategy has been backtested since 1983, almost 36 years, and had nice results, 18% return per year and Max DD 30% with initial capital 1.000$ and 30 contracts size per trade.
Ask for a free trial to enjoy! And look yourself how much whould have been the profit using 100% of the equity!
Enjoy your wallet!
Tari.
