Explore the community
Get inspiration for your next trade. Don't reinvent the wheel.

The TradingView Show: Breakout Charts with TradeStationWatch our latest episode of The TradingView Show and dive deep into the markets with TradeStation and their Head of Strategy. We examine breakout charts, significant money movements, and invaluable educational insights for traders of all levels.
For daily charts and research, visit the TradeStat

Bitcoin: Double Bottom Long To 64K.Bitcoin has confirmed a double bottom within the 60K major support area. The scenario that I outlined in my previous analysis is STILL in play (see illustration on chart). An inside bar is also present on this time frame along with a break of the high of that candle. As a result of all of this, a ne

Navigating Frothy US Equities with S&P SpreadsNavigating frothiness in US equities requires both caution and tact. With the S&P 500 nearing its all-time high amid flashing recession signals, investors must be vigilant with volatility during upcoming earnings season, driven by outsized expectations.
This paper explores the persistent recession

Amazon at $2 Trillion: What’s Driving the Stock to Record Highs?Tripled profits, a bet on AI, and a strategy to take on rising rivals from the East have propelled the ecommerce and cloud computing giant to the lofty price tag.
Innovation on Amazon’s Mind
Amazon (ticker: AMZN ) hit $2 trillion in market value just before the year clocked out for the first

NIKE - Dead or a Cheap Opportunity? Nike has been on a rough patch recently & this past week didn't help as it saw it's worst day in over 20 years.
Now the question is, is Nike dead in the water or has price gotten so cheap that it makes for a good investment opportunity?
Now, I'm not here to tell you that you should or shouldn't

AUD/USD swing trade setup
This AUD/USD pair could completed its correction already
Wave (1) = diagonal
Wave (2) = complex correction W-X-Y (expanded triangle)
Wave 1-2 (expanded flat completed last night 26/6/2024) of 3
If this wave count is valid, possible short term target (days-weeks) are
1) 0.68
2) 0.694
Price s

GOLDTrend Analysis
Downward Trend Line: There is a red downward trend line indicating that gold has been in a downtrend. This line acts as a resistance level.
Support Zone: There is a green support zone around the $2,318.00 level. This indicates that there is buying interest around this price, and it

Ichimoku Watch: Nvidia Eyeing Ichimoku Cloud Support In three successive days of selling, triggered after a bearish outside reversal formed on Thursday last week from all-time highs of $140.76, Nvidia (ticker: NVDA) has shed approximately -15.0% from the peak.
The company’s market value dropped more than US$500 billion to US$2.91 trillion, consequent

Nvidia - Massive rejection soon!NASDAQ:NVDA is clearly overextended after the +1.000% rally and ready for a correction.
Trees simply do not grow to the sky. And neither do stocks, especially Nvidia. I know that a lot of people are calling price targets of $250 and beyond, but we still have to respect gravity and the nature of

See all editors' picks ideas
Learn the ins and outs of trading.
Developing Emotional Resilience: Bouncing Back from LossesOkay, fellow TradingViewers, it’s time we tackle a topic that may make you a bit uncomfortable. But, rest assured — it’s for your own good! Today, we explore the realm of emotional resilience and, more precisely, how to bounce back from losses.
Losses are inevitable. Ask anyone — even the big dogs

Applying a Champions Mindset to TradingWith the Wimbledon tennis championships starting this week, it seems only appropriate that we take inspiration from tennis GOAT Roger Federer, whose wisdom extends far beyond the court.
It’s Only a Point
In a recent speech at Dartmouth College in the US, Roger Federer, a 20-time major winner, s

10-Year T-Note vs. 10-Year Yield Futures: Which One To Trade?Introduction:
The 10-Year T-Note Futures and 10-Year Yield Futures are two prominent instruments in the financial markets, offering traders unique opportunities to capitalize on interest rate movements. This video compares these two products, focusing on their key characteristics, liquidity, and t

FULL ANALYSIS GUIDE - (Using ICT's Concepts)Hey guys,
In this video I will show you my process for performing analysis. Yes, it takes some work, but generally once you get into the swing of it, it doesn't take long, and the higher timeframes only require analysis once in awhile. It allows me to have a higher win-rate and be more on side with

Price Action Fluency As A Second LanguageThis is the most important educational video I have shared.
Reading price action is akin to acquiring a second or foreign language. Just as fluency in a new language provides fluency and articulation, mastering price action offers traders a nuanced understanding of market dynamics. One would not e

How to Read the MACD Indicator and Use It in Your TradingTechnical analysis is a vast field with thousands of indicators, which may be confusing to those among us who are just starting out. In this Idea, we look at one of the most popular indicators and also one of the easiest ones to fire up and start using from Day 1.
MACD (Moving Average Convergence

EBS Base Breakout SetupHey everybody got my camera working for this trade idea. Here we have the ebs stock setting up for a breakout in an uptrend and we're hoping for a bullish continuation here. I describe my entry points my stop loss and my profit target one and the logic behind them and how to position your share coun

Trade the TREND with 4 Trend Indicators4 Trend Indicators you can use to identify the current MACRO Trend.
It's always important to know where your market is currently trading. Is it bullish, bearish, or range trading? If you have established the trend, you can trade with the trend instead of against it. Trading against the trend ( for

Is It Possible to Define the Probability of an Effective Trade?Is It Possible to Define the Probability of an Effective Trade?
Traders are constantly trying to figure out the secret of effective trading. However, the inherent unpredictability of markets minimises the ability to accurately determine the probability of an effective trade. This FXOpen article fo

Why you need to have rules in your trading careerHello,
The importance of rules cannot be underestimated in any business. This must not be different in trading/investing since it must be viewed at all times as a business.
Below are my rules as a wave trader. Wave trading is a trading strategy that combines technical analysis with Elliott Wave Th

See all editors' picks ideas
Trading explainers – why read when you can watch instead?
10-Year T-Note vs. 10-Year Yield Futures: Which One To Trade?Introduction:
The 10-Year T-Note Futures and 10-Year Yield Futures are two prominent instruments in the financial markets, offering traders unique opportunities to capitalize on interest rate movements. This video compares these two products, focusing on their key characteristics, liquidity, and t
FULL ANALYSIS GUIDE - (Using ICT's Concepts)Hey guys,
In this video I will show you my process for performing analysis. Yes, it takes some work, but generally once you get into the swing of it, it doesn't take long, and the higher timeframes only require analysis once in awhile. It allows me to have a higher win-rate and be more on side with
The TradingView Show: Breakout Charts with TradeStationWatch our latest episode of The TradingView Show and dive deep into the markets with TradeStation and their Head of Strategy. We examine breakout charts, significant money movements, and invaluable educational insights for traders of all levels.
For daily charts and research, visit the TradeStat
NIKE - Dead or a Cheap Opportunity? Nike has been on a rough patch recently & this past week didn't help as it saw it's worst day in over 20 years.
Now the question is, is Nike dead in the water or has price gotten so cheap that it makes for a good investment opportunity?
Now, I'm not here to tell you that you should or shouldn't
Price Action Fluency As A Second LanguageThis is the most important educational video I have shared.
Reading price action is akin to acquiring a second or foreign language. Just as fluency in a new language provides fluency and articulation, mastering price action offers traders a nuanced understanding of market dynamics. One would not e
EBS Base Breakout SetupHey everybody got my camera working for this trade idea. Here we have the ebs stock setting up for a breakout in an uptrend and we're hoping for a bullish continuation here. I describe my entry points my stop loss and my profit target one and the logic behind them and how to position your share coun
Trade the TREND with 4 Trend Indicators4 Trend Indicators you can use to identify the current MACRO Trend.
It's always important to know where your market is currently trading. Is it bullish, bearish, or range trading? If you have established the trend, you can trade with the trend instead of against it. Trading against the trend ( for
Nvidia - Massive rejection soon!NASDAQ:NVDA is clearly overextended after the +1.000% rally and ready for a correction.
Trees simply do not grow to the sky. And neither do stocks, especially Nvidia. I know that a lot of people are calling price targets of $250 and beyond, but we still have to respect gravity and the nature of

See all editors' picks ideas
Trading indicators and strategies built by our community.
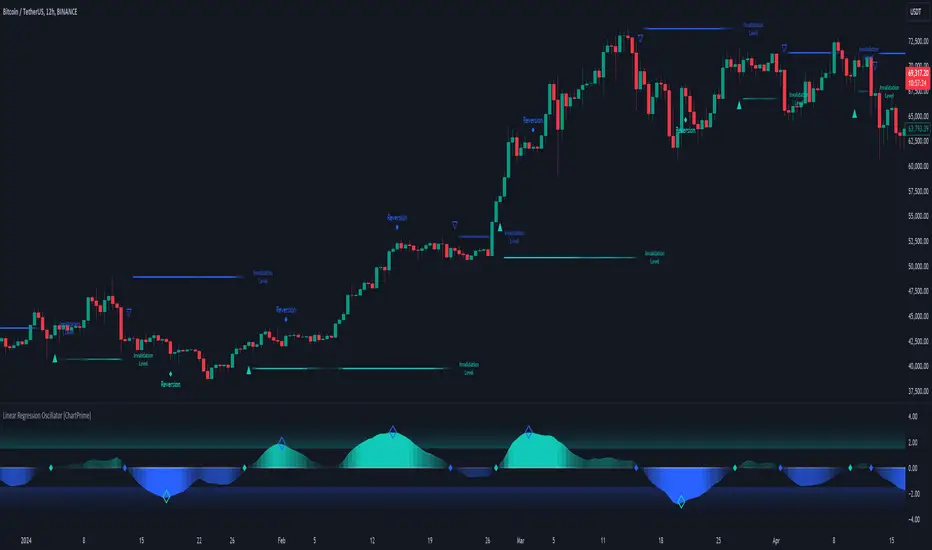
Linear Regression Oscillator [ChartPrime]Linear Regression Oscillator Indicator
Overview:
The Linear Regression Oscillator is a custom TradingView indicator designed to provide insights into potential mean reversion and trend conditions. By calculating a linear regression on the closing prices over a user-defined period, this oscillato
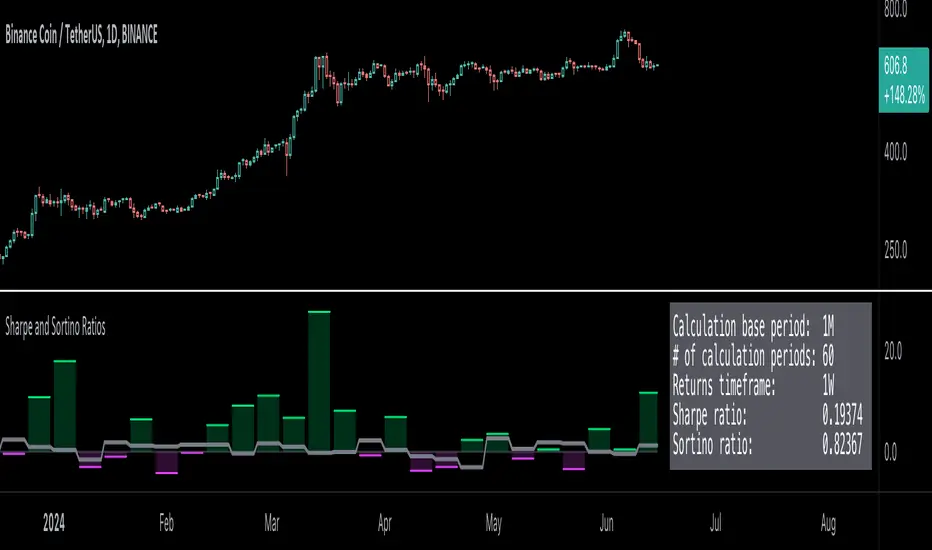
Sharpe and Sortino Ratios█ OVERVIEW
This indicator calculates the Sharpe and Sortino ratios using a chart symbol's periodic price returns, offering insights into the symbol's risk-adjusted performance. It features the option to calculate these ratios by comparing the periodic returns to a fixed annual rate of retur
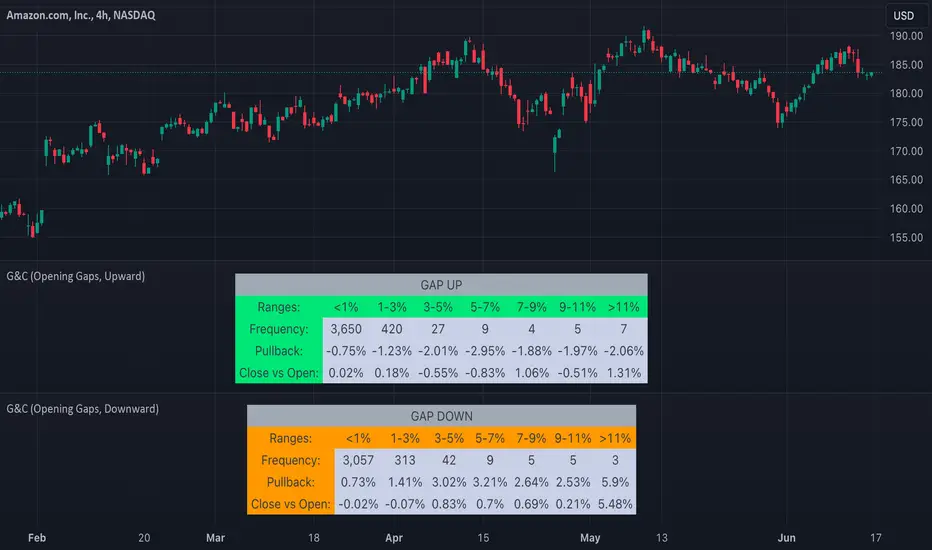
TASC 2024.07 Gaps and Extreme Closes█ OVERVIEW
This script, inspired by Perry Kaufman's article "Trading Opening Gaps and Extreme Closes in Stocks" from the TASC's July 2024 edition of Traders' Tips , provides analytical insights into stock price behaviors following significant price moves. The information about the frequency, pullb
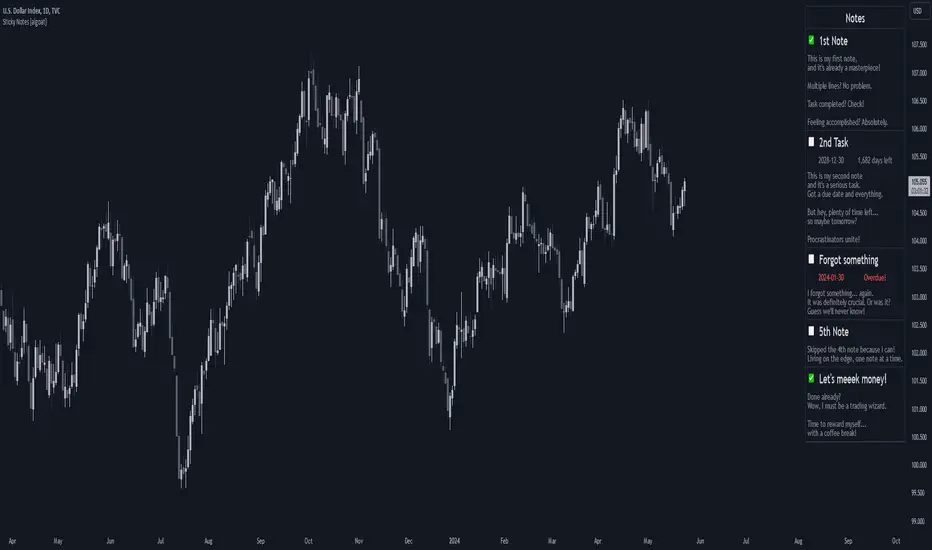
Sticky Notes, Checklist, To-do, Journal [algoat]I forgot to bring my notes again...
Ever feel like your trading notes are all over the place, much like your portfolio after a market dip? Worry not! With this script, you'll have all your trading notes, tasks, and brilliant (or not so brilliant) ideas neatly organized right on your chart. It's li
Ichimoku Theories [LuxAlgo]The Ichimoku Theories indicator is the most complete Ichimoku tool you will ever need. Four tools combined into one to harness all the power of Ichimoku Kinkō Hyō.
This tool features the following concepts based on the work of Goichi Hosoda:
Ichimoku Kinkō Hyō: Original Ichimoku indicator with

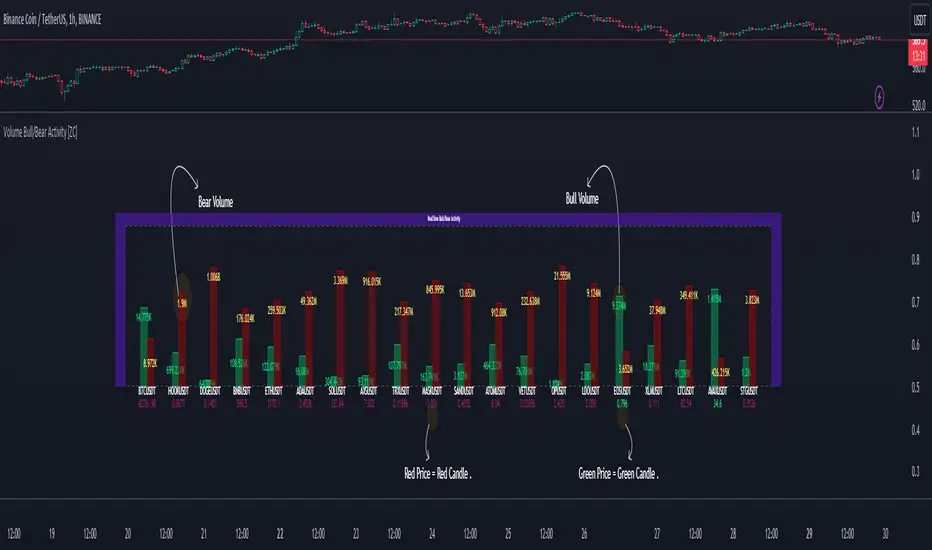
Volume Bull/Bear Activity [ZC]Volume Bull/Bear Activity Summary
This indicator generates a summary of bull/bear activity for 20 symbols.
For each symbol, two bars are displayed, colored green and red.
The green bar indicates bull volume, reflecting activity within the last candle of the symbol.
The red bar signifie
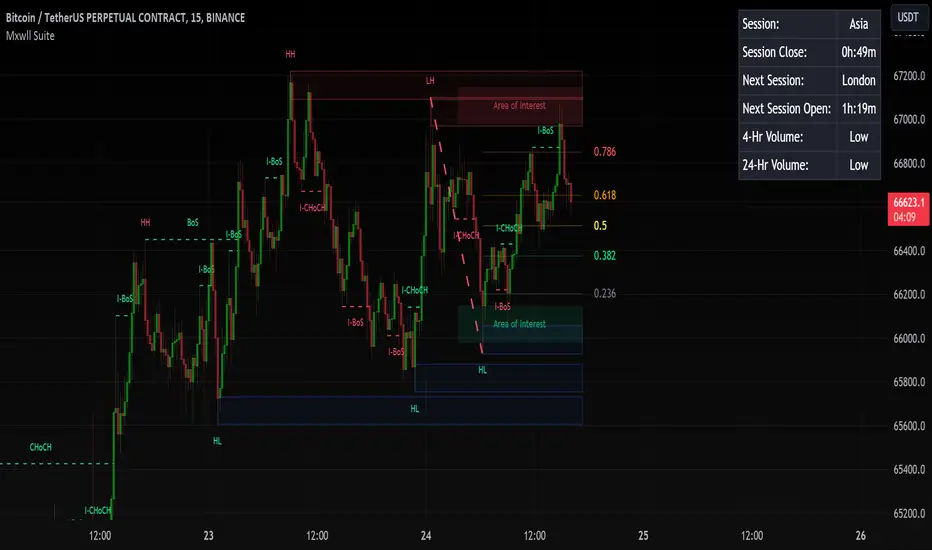
Mxwll Price Action Suite [Mxwll]Introducing the Mxwll Price Action Suite!
The Mxwll Price Action Suite is an all-in-one analysis indicator incorporating elements of SMC and also ideas extending beyond the trading methodology!
Features
Internal structures
External structures
Customizable Sensitivities
BoS/CHoCH
Order B
Percent Rank HistogramThis Pine script indicator is designed to create a visual representation of the percent rank for multiple financial instruments. Here's a breakdown of its key features:
Percent Rank Calculation:
The core functionality of this Pine script indicator revolves around the calculation of the percent r

Heat Map SeasonsHeat Map Seasons indicator
Indicator offers traders a unique perspective on market dynamics by visualizing seasonal trends and deviations from typical price behavior. By blending regression analysis with a color-coded heat map, this indicator highlights periods of heightened volatility and helps

Index Generator [By MUQWISHI]▋ INTRODUCTION :
The “Index Generator” simplifies the process of building a custom market index, allowing investors to enter a list of preferred holdings from global securities. It aims to serve as an approach for tracking performance, conducting research, and analyzing specific aspects of the glob

See all editors' picks scripts